Analysis toolbars(分析工具栏)
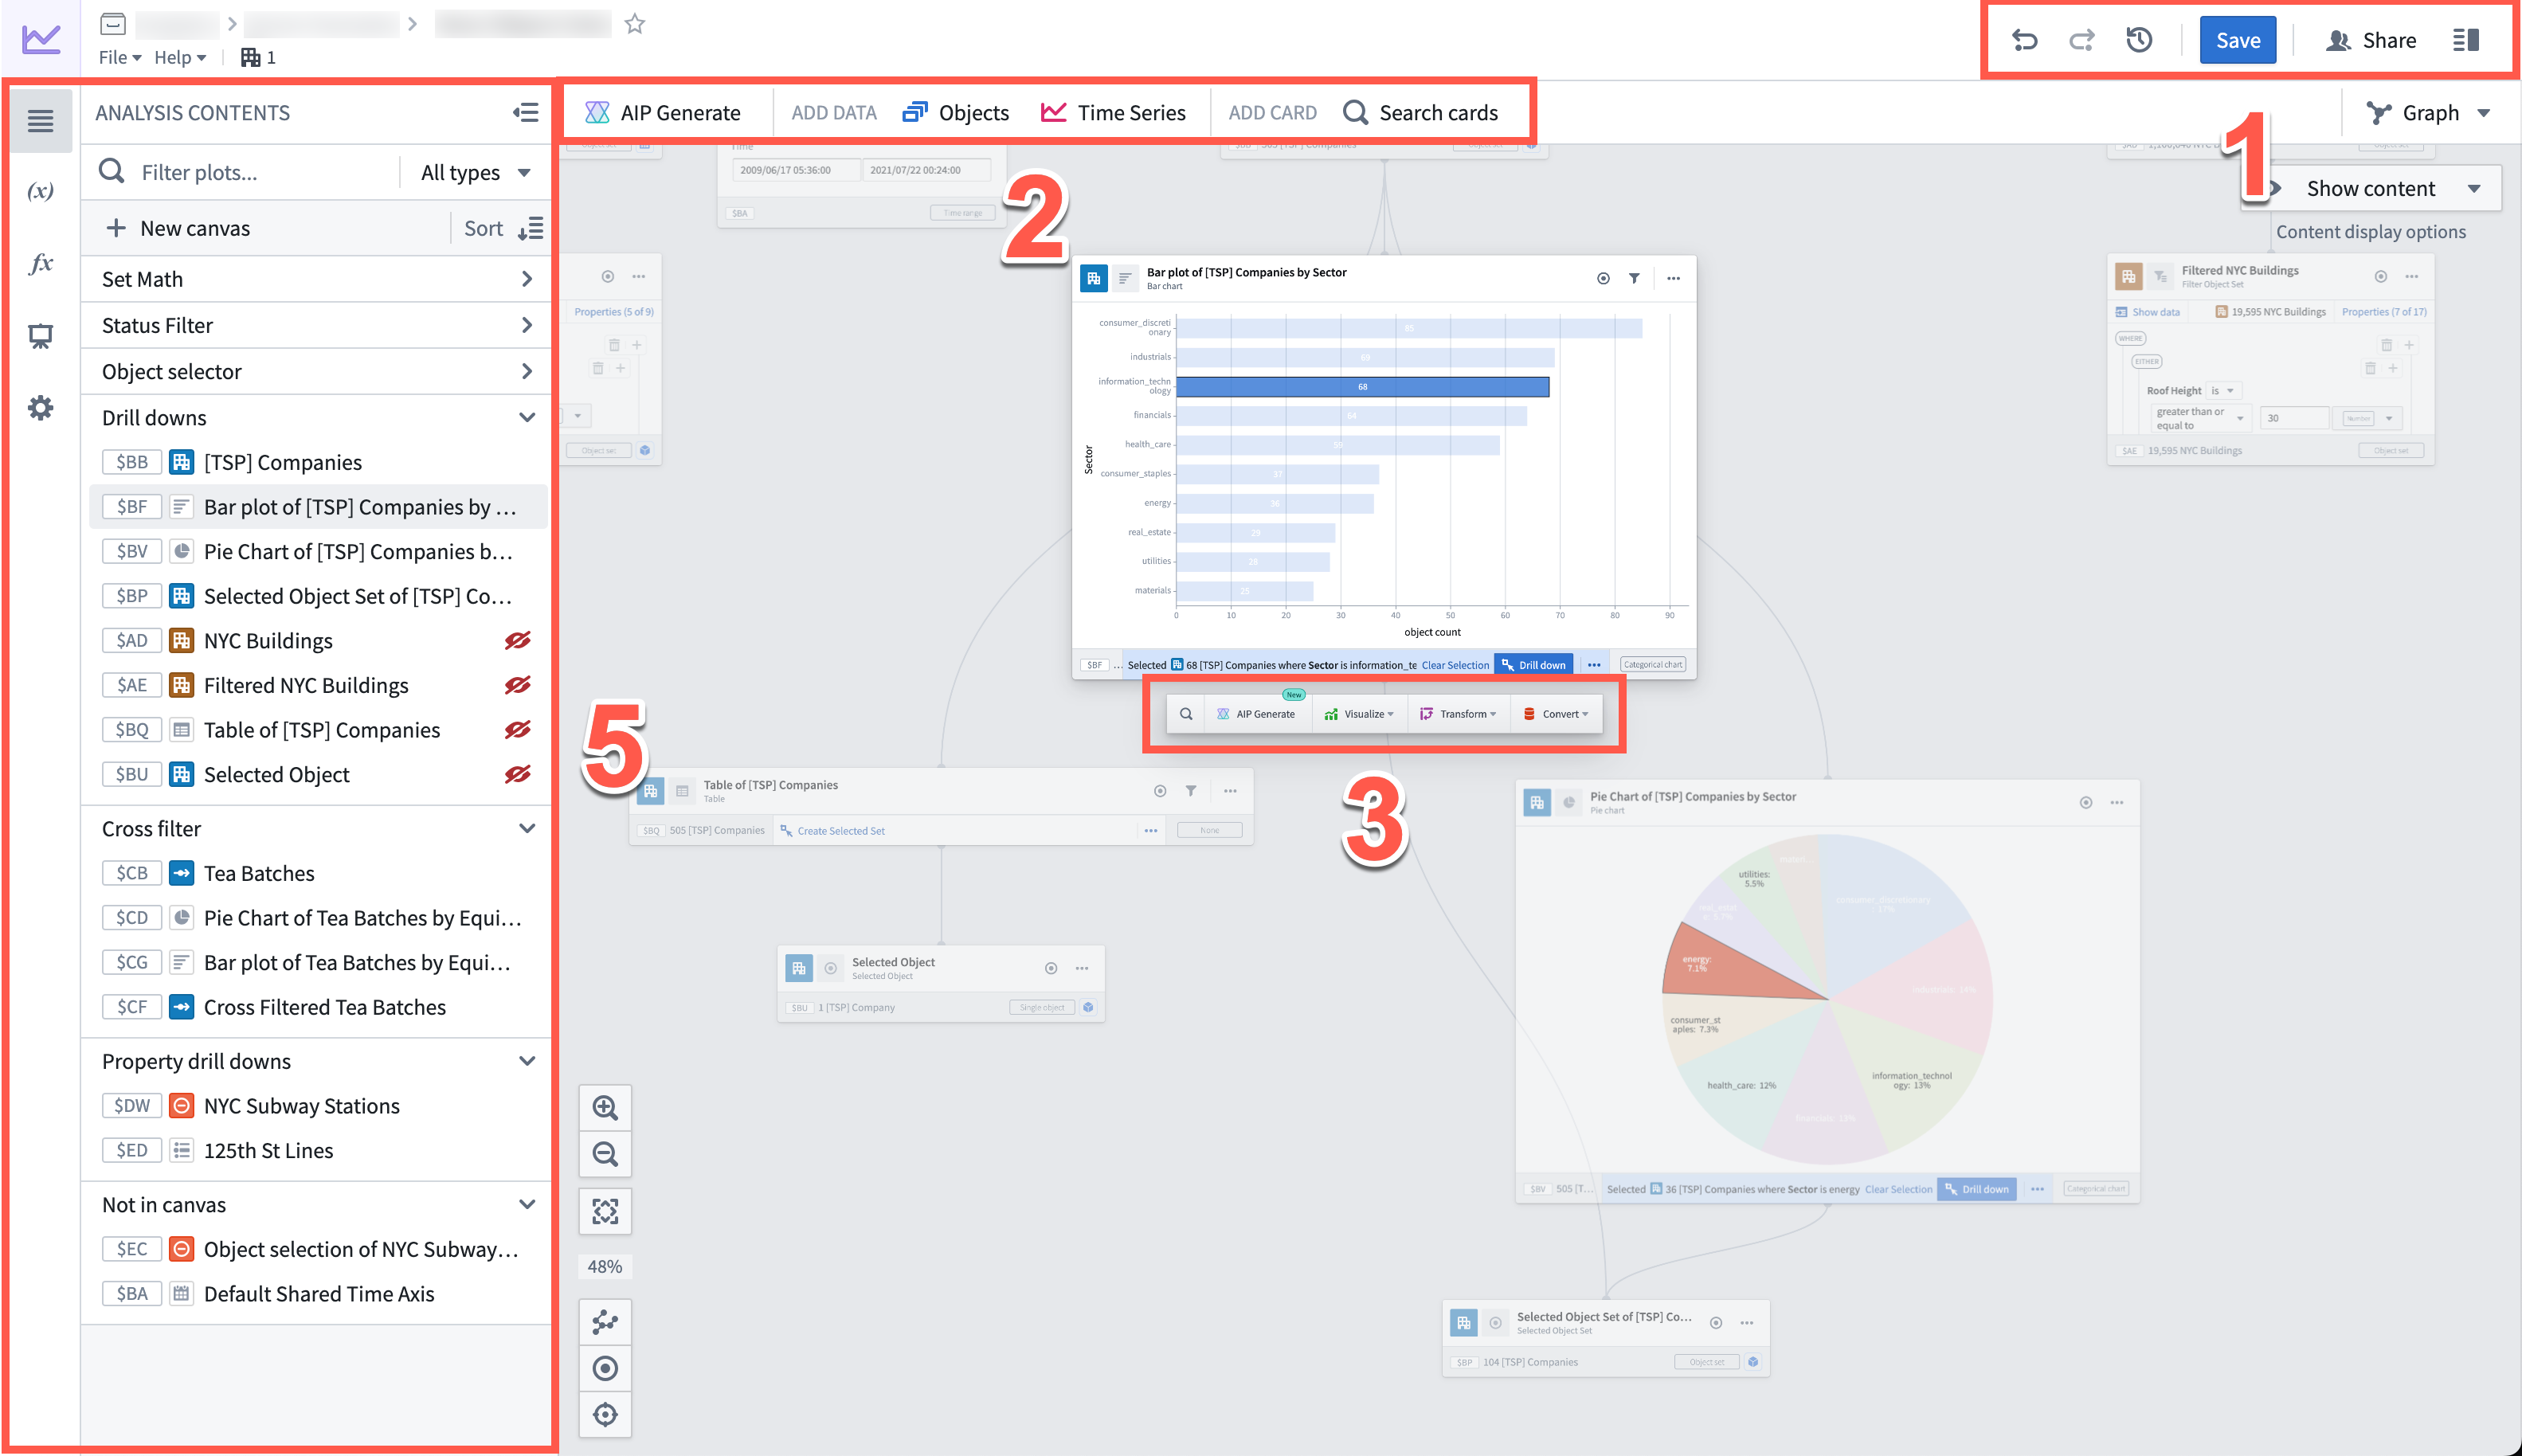
Whether you are conducting your analysis in canvas mode or graph mode, you will have access to the same analysis workspace toolbars, consisting of the following components:
- Analysis workspace header
- Analysis top bar
- Next actions menu
- Search bar
- Side panels
- Analysis Contents panel
- Parameters panel
- Visual Functions panel
- Dashboards panel
- Settings panel
Analysis workspace header
Marked as 1 in the image, the analysis workspace header provides the following capabilities from left to right:
- Undo / Redo: These buttons allow you to undo or redo actions within your analysis.
- Analysis history (
 ): Access previous saved versions of your analysis or dashboard.
 - Save: Save your analysis.
- Share: Share your analysis.
- Details panel: To manage access, collaborators, and other analysis metadata.
Analysis top bar
Marked as 2 in the image above, the analysis top bar allows you to add data and add cards to your analysis.
- Data cards: Opens the search bar to add objects or time series to your analysis.
- Search cards: Opens the search bar, allowing you to search through and interact with all available cards.
Next actions menu
Marked as 3 in the image above and below, the next actions menu is a toolbar that appears when you hover over a card or a time series plot on the canvas or the graph. From the next actions menu, you can find and perform common actions related to the selected card. Actions are grouped by categories such as filtering, visualizing, calculating, joining, transforming, and converting data.
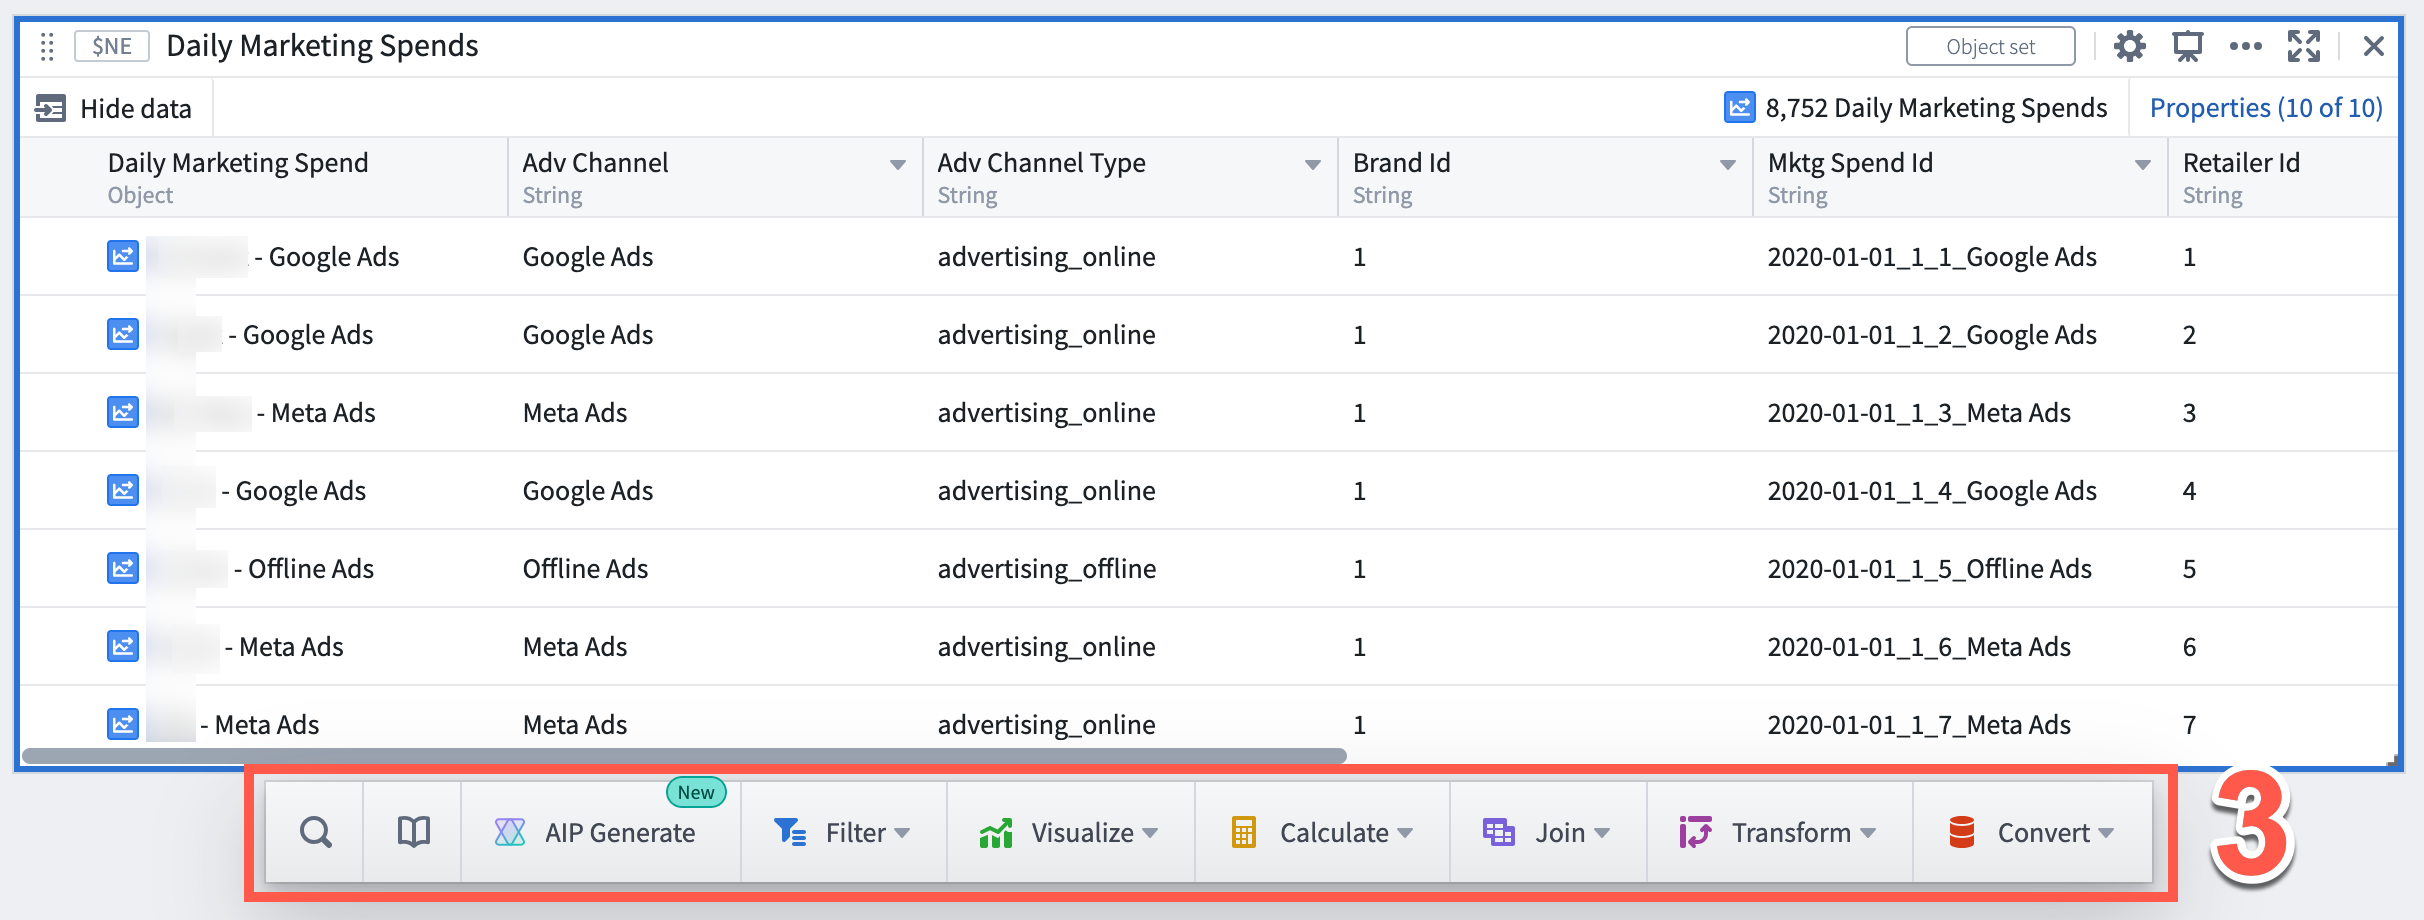
Note that the specific set of options in the next actions menu will vary depending on the output type of the selected card.
Search for actions across all categories or search within a specific category by using the search option ( ). Results will include matches from within the category and also highlight matches from other categories.
Available for object and object set cards, use the Library option ( ) to discover existing Foundry resources such as Ontology Actions and functions, published Quiver dashboards and Quiver visual functions that can take the selected object type as input. Selecting an artifact will add the relevant Quiver card preconfigured with that artifact as input. For example, when selecting an Ontology Action, a Quiver Action button will be added to the analysis preconfigured with the selected Action.
Open AIP Generate using the selected card as input to generate an analysis using natural language.
Search bar
Marked as 4 in the image below, the search bar provides a single point of access to all cards supported in Quiver.
Open the search bar by selecting any item on the analysis top bar. Alternatively, you can open the search bar by selecting:
- + Add data to analysis in an empty analysis.
- + Add data in an empty Analysis Contents panel.
- New card in the Analysis Contents panel (hovering on the canvas name).
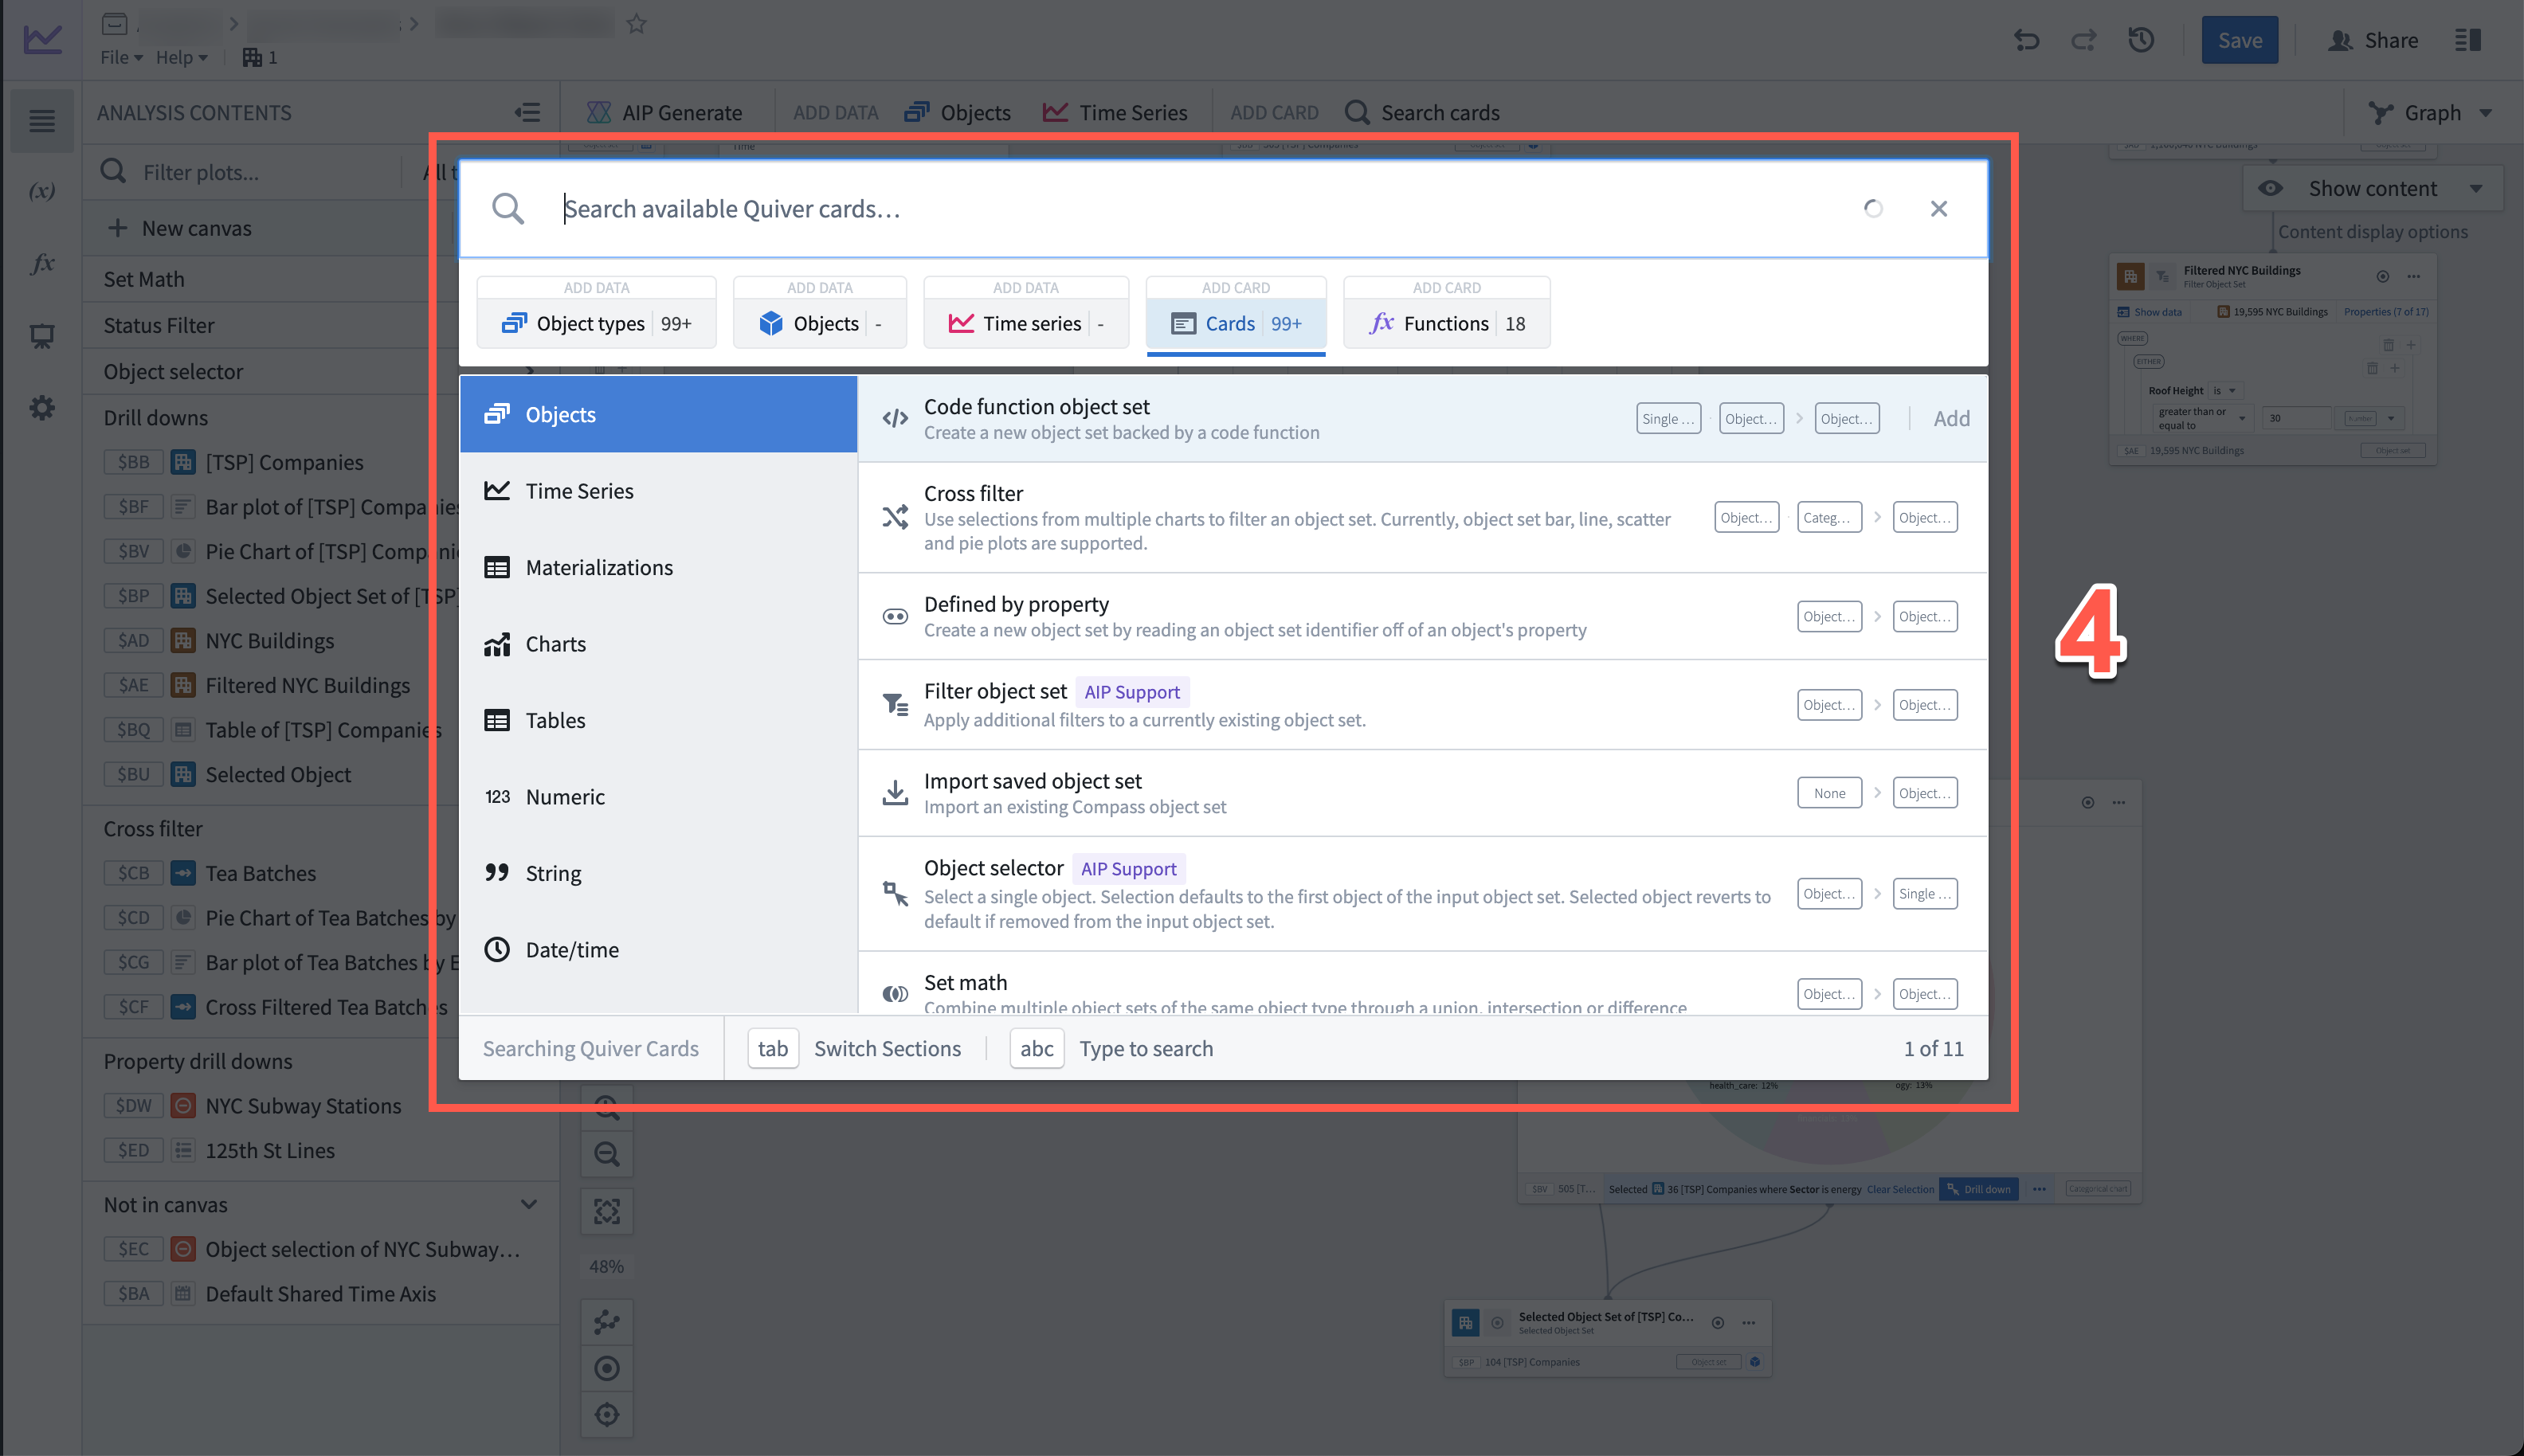
Cards are grouped in the following tabs:
- Object types: Add one or more object sets. This tab features a left-side menu that includes all objects that have configured time series and the Ontology groups configured in your Ontology.
- Objects: Add one or more specific objects. This tab features a left-side menu with the available object types.
- Time series: Add one or more time series objects. This tab features a left-side menu with the available object configured with time series properties.
- Cards: Add one of the cards to interact with data. This tab features a left-side menu to categorize cards according to the analytical objective of each. The data type labels can help you identify the inputs and outputs supported by each card.
- Functions: Search through all available Functions and add them, split by functions for time series and those for objects.
Side panels
Marked as 5 in the image at the top of the page, select one of the icons on the left side to open the side panels. There are five side panels:
Analysis Contents panel
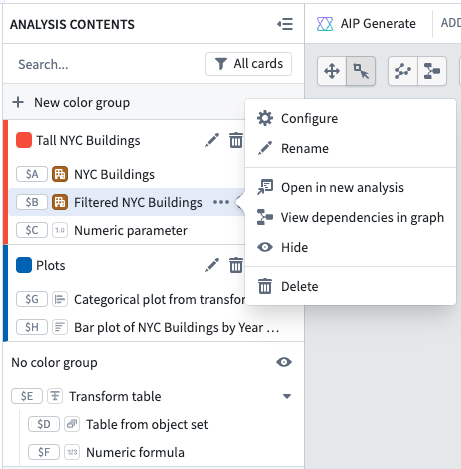
The Analysis Contents panel allows you to organize your analysis. There are several functions that can be completed directly in the panel, including:
- Find and organize content
- Search for specific cards by typing their global ID or title
- Filter by text and data type
- Drag and drop content to move between sections (or rearrange on canvas when in canvas mode)
In canvas mode, every card is listed in the order it appears on the canvas. The following actions are available:
- Configure: Open the editor to configure a card
- Duplicate: Create a copy of the card in the same analysis
- Rename: Edit the card title
- Open in new analysis: Duplicate the card along with its upstream dependencies to a new analysis
- View dependencies in graph: Switch to graph mode in a dependency view
- Hide: Hide a card from the canvas
- Delete: Remove the card from the analysis. If the card has downstream dependencies, you will get a dialog with options on how to handle it.
Card actions can be found by selecting the More actions icon ( ) that appears when hovering over a card in the list.

In graph mode, cards are listed based on the color group they belong to. You can also filter the graph based on data type or by canvases/dashboards/visual functions. The actions available from the Analysis Contents panel include:
- Configure: Open the editor to configure a card
- Rename: Edit the card title
- Open in new analysis: Duplicate the card along with its upstream dependencies to a new analysis
- View dependencies in graph: Switch to graph mode in a dependency view
- Hide: Hide a card on the graph
- Delete: Remove the card from the analysis. If the card has downstream dependencies, you will get a dialog with options on how to handle it.
Parameters panel
More information about the Parameters panel can be found in the documentation on how to parameterize an analysis.
Visual Functions panel
More information about the Visual Functions panel can be found in the documentation on how to use visual functions.
Dashboards panel
More information about the Dashboards panel can be found in the documentation on how to use dashboards.
Settings panel
More information about the Settings panel can be found in the documentation on how to change the analysis settings.
中文翻译
分析工具栏
无论您是在画布模式还是图形模式下进行分析,都可以使用相同的分析工作区工具栏,包含以下组件:
分析工作区标题栏
如图中标注为 1 的部分,分析工作区标题栏从左到右提供以下功能:
- 撤销/重做: 这些按钮允许您在分析中撤销或重做操作。
- 分析历史记录 ():访问分析或仪表板之前的已保存版本。
- 保存:保存您的分析。
- 共享:共享您的分析。
- 详情面板: 用于管理访问权限、协作者和其他分析元数据。
分析顶部栏
如上图中标注为 2 的部分,分析顶部栏允许您向分析中添加数据和卡片。
下一步操作菜单
如上图和下图中标注为 3 的部分,下一步操作菜单是一个工具栏,当您将鼠标悬停在画布或图形上的卡片或时间序列图上时会出现。通过下一步操作菜单,您可以找到并执行与所选卡片相关的常见操作。操作按类别分组,例如过滤、可视化、计算、连接、转换和数据转换。
请注意,下一步操作菜单中的具体选项集将根据所选卡片的输出类型而有所不同。
使用搜索选项()可以跨所有类别搜索操作,或在特定类别内搜索。搜索结果将包括类别内的匹配项,并高亮显示其他类别中的匹配项。
适用于对象和对象集卡片,使用库选项()可以发现现有的 Foundry 资源,例如本体操作和函数、已发布的 Quiver 仪表板和 Quiver 可视化函数,这些资源可以将所选对象类型作为输入。选择某个工件将添加相应的 Quiver 卡片,并预配置该工件作为输入。例如,选择本体操作时,将向分析中添加一个预配置了所选操作的 Quiver 操作按钮。
使用所选卡片作为输入,打开 AIP 生成 以使用自然语言生成分析。
搜索栏
如下图所示中标注为 4 的部分,搜索栏提供了对 Quiver 中所有支持卡片的单一访问点。
通过选择分析顶部栏上的任意项目来打开搜索栏。或者,您也可以通过选择以下选项打开搜索栏:
卡片按以下选项卡分组:
- 对象类型: 添加一个或多个对象集。此选项卡具有左侧菜单,包含所有已配置时间序列的对象以及本体中配置的本体组。
- 对象: 添加一个或多个特定对象。此选项卡具有左侧菜单,显示可用的对象类型。
- 时间序列: 添加一个或多个时间序列对象。此选项卡具有左侧菜单,显示已配置时间序列属性的可用对象。
- 卡片: 添加一个卡片以与数据交互。此选项卡具有左侧菜单,可根据每个卡片的分析目标对卡片进行分类。数据类型标签可以帮助您识别每个卡片支持的输入和输出。
- 函数: 搜索所有可用的函数并添加它们,按时间序列函数和对象函数进行拆分。
侧面板
如页面顶部图片中标注为 5 的部分,选择左侧的图标之一即可打开侧面板。共有五个侧面板:
分析内容面板
分析内容面板允许您组织分析。可以直接在面板中完成多项功能,包括:
- 查找和组织内容
- 通过输入全局 ID 或标题搜索特定卡片
- 按文本和数据类型过滤
- 拖放内容以在部分之间移动(或在画布模式下重新排列画布上的内容)
在画布模式下,每张卡片按其在画布上出现的顺序列出。可用的操作包括:
- 配置: 打开编辑器以配置卡片
- 复制: 在同一分析中创建卡片的副本
- 重命名: 编辑卡片标题
- 在新分析中打开: 将卡片及其上游依赖项复制到新分析中
- 在图形中查看依赖项: 切换到依赖项视图的图形模式
- 隐藏: 从画布中隐藏卡片
- 删除: 从分析中移除卡片。如果卡片有下游依赖项,将出现对话框,提供处理选项。
卡片操作可以通过选择列表中卡片悬停时出现的 更多操作 图标()来找到。
在图形模式下,卡片根据其所属的颜色组列出。您还可以根据数据类型或按画布/仪表板/可视化函数过滤图形。分析内容面板中可用的操作包括:
- 配置: 打开编辑器以配置卡片
- 重命名: 编辑卡片标题
- 在新分析中打开: 将卡片及其上游依赖项复制到新分析中
- 在图形中查看依赖项: 切换到依赖项视图的图形模式
- 隐藏: 在图形上隐藏卡片
- 删除: 从分析中移除卡片。如果卡片有下游依赖项,将出现对话框,提供处理选项。
参数面板
有关参数面板的更多信息,请参阅如何参数化分析的文档。
可视化函数面板
有关可视化函数面板的更多信息,请参阅如何使用可视化函数的文档。
仪表板面板
有关仪表板面板的更多信息,请参阅如何使用仪表板的文档。
设置面板
有关设置面板的更多信息,请参阅如何更改分析设置的文档。