Categorical formula plot(分类公式图(Categorical formula plot))
Create a new categorical (bar, line, scatter) plot by computing a formula on overlapping categories of existing categorical plots. Numerics, from aggregations or parameters, can also be in the formula.
Input type
Categorical chart, number
Output type
Categorical chart, object selection
Examples
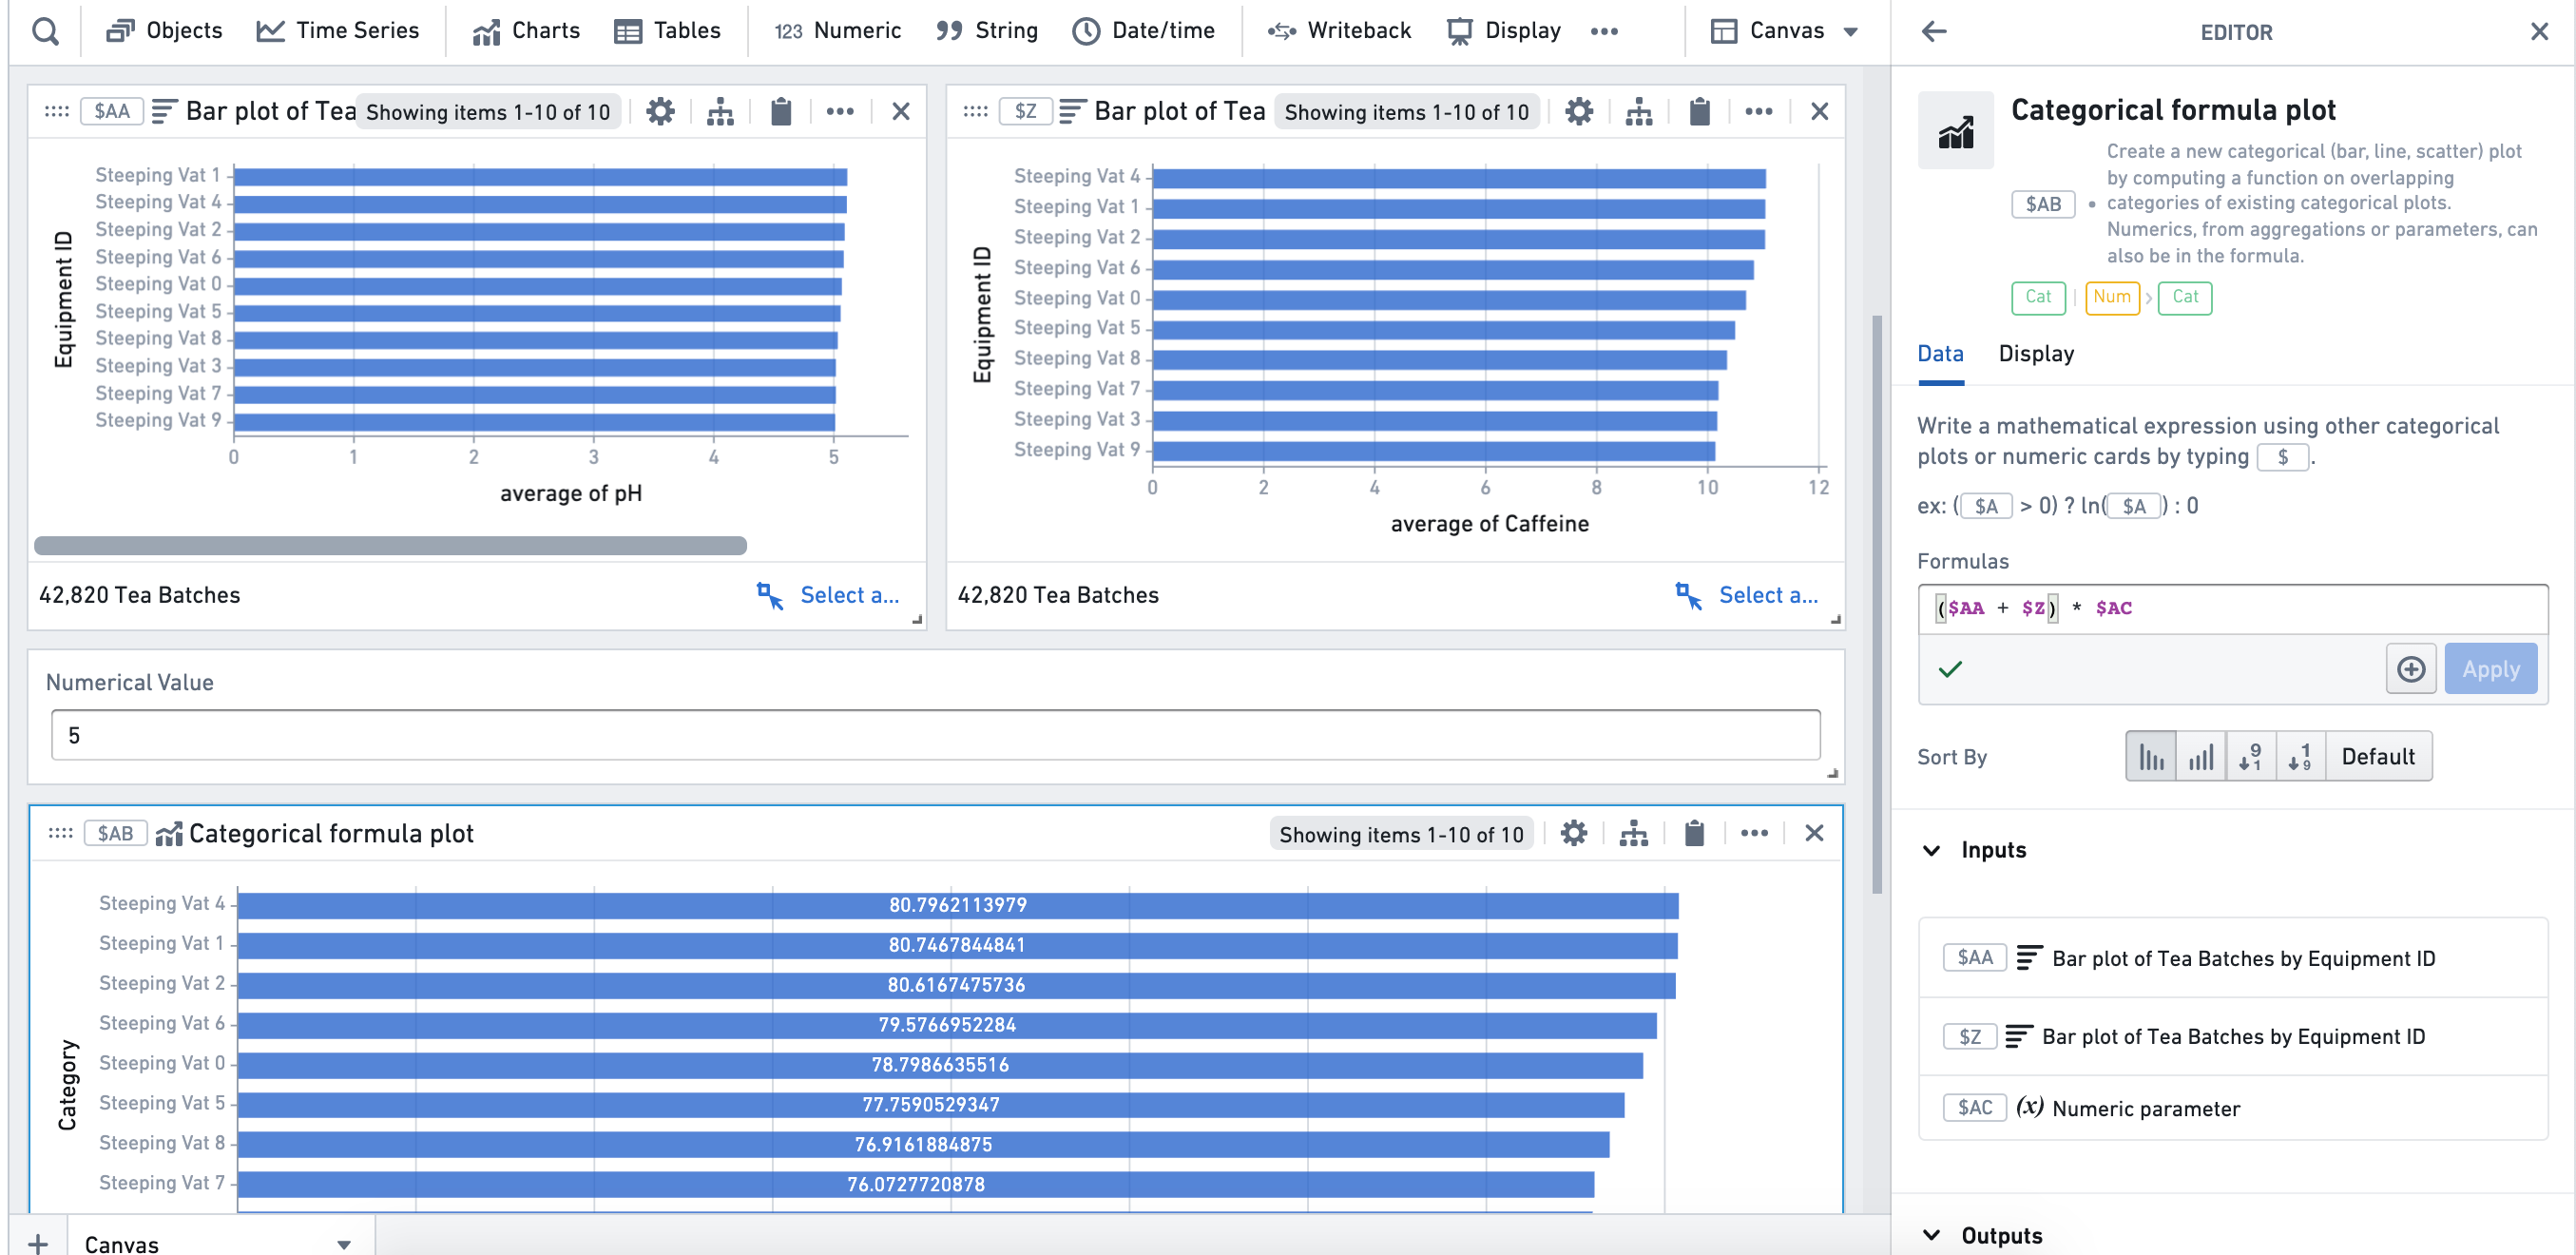
In the example below, we add two bar plots together and multiply by the value of a numeric parameter. When writing formulas here, computation between bar plots will be run on matching segments and group-by categories. Single numerical values will be applied to all bars.
Usage information
| Functionality | Availability |
|---|---|
| Standard Quiver card | Supported |
| Transform table transform | Unsupported |
中文翻译
分类公式图(Categorical formula plot)
通过对现有分类图的交叠类别计算公式,创建新的分类图(柱状图、折线图、散点图)。公式中也可包含来自聚合或参数的数值。
输入类型
分类图表,数值
输出类型
分类图表,对象选择
示例
在以下示例中,我们将两个柱状图相加,再乘以一个数值参数的值。在此编写公式时,柱状图之间的计算将基于匹配的片段和分组类别进行。单个数值将应用于所有柱状条。
使用信息
| 功能 | 支持情况 |
|---|---|
| 标准 Quiver 卡片 | 支持 |
| 转换表转换 | 不支持 |