Derivative(导数(Derivative))
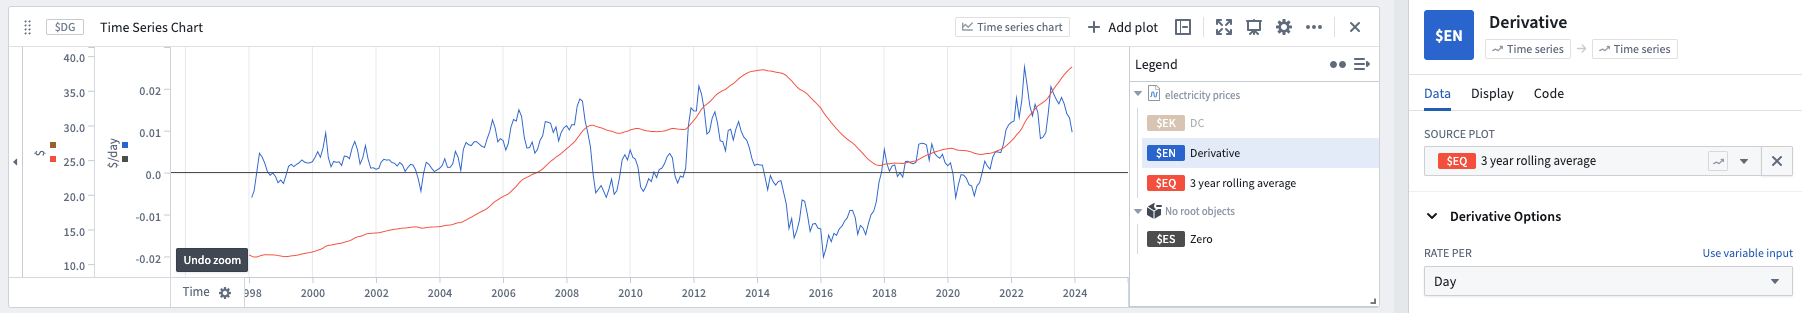
The Derivative plot shows the rate of change at each given point in the selected input series.
- The default is to calculate the rate of change per second. This can be changed to several other options. Note that this does not affect the shape of the curve, only the y-axis units.
- Derivatives are useful for identifying when the slope of a series is flat (that is, not changing.) To find periods where a series is not changing, you can do a Time Series Search for periods when the derivative of the series is close to zero.
Input type
Time series
Output type
Time series
Example
Usage information
| Functionality | Availability |
|---|---|
| Standard Quiver card | Supported |
| Transform table transform | Supported |
中文翻译
导数(Derivative)
导数图显示所选输入序列中每个给定点的变化率。
- 默认情况下,计算每秒的变化率。可更改为其他几种选项。请注意,这不会影响曲线的形状,仅影响 y 轴的单位。
- 导数有助于识别序列斜率何时为平缓(即无变化)。要查找序列无变化的时间段,可执行时间序列搜索(Time Series Search),搜索导数接近零的时间段。
输入类型
时间序列(Time series)
输出类型
时间序列(Time series)
示例
使用信息
| 功能 | 可用性 |
|---|---|
| 标准 Quiver 卡片(Standard Quiver card) | 支持 |
| 转换表转换(Transform table transform) | 支持 |