Event comparison plot(事件对比图(Event comparison plot))
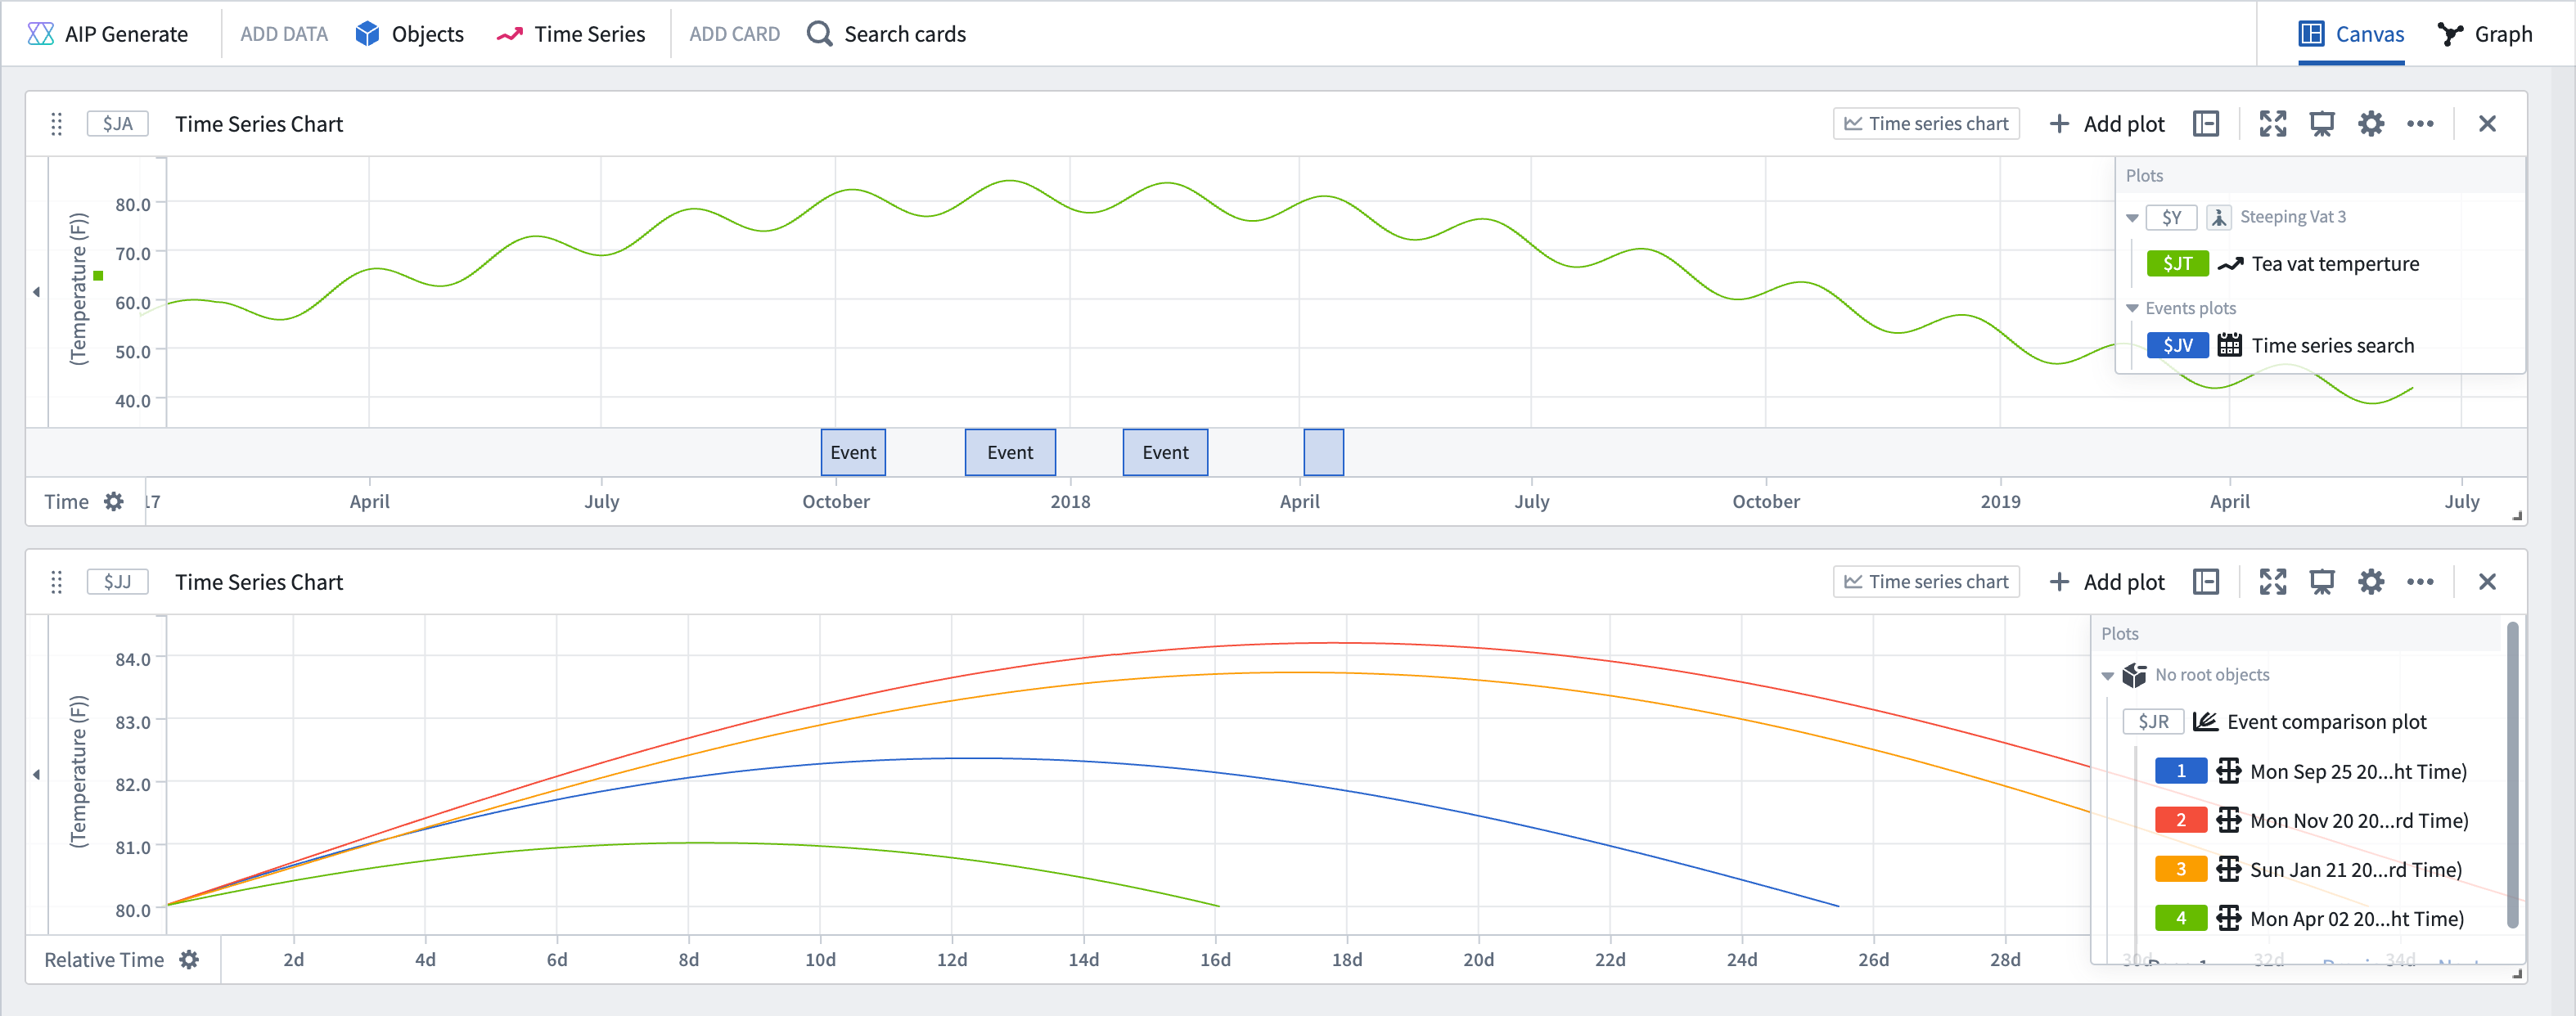
Compare the behavior of a time series across multiple events by isolating and aligning the segments of the time series where each event is occurring. The plot displays the time series segments in relative time, so that the value at the each event's start time is aligned to zero. The image below shows how the event comparison plot can be used to visualize the behavior of temperature in a tea vat over 80 degrees.
Input type
Time series + event set
Output type
Time series group
Examples
Usage information
| Functionality | Availability |
|---|---|
| Standard Quiver card | Supported |
| Transform table transform | Unsupported |
See also
中文翻译
事件对比图(Event comparison plot)
通过隔离并对齐时间序列中每个事件发生的片段,比较时间序列在多个事件中的行为表现。该图表以相对时间显示时间序列片段,使得每个事件起始时刻的值对齐到零点。下图展示了如何使用事件对比图来可视化茶缸温度超过80度时的行为。
输入类型
时间序列(Time series) + 事件集(Event set)
输出类型
时间序列组(Time series group)
示例
使用信息
| 功能 | 可用性 |
|---|---|
| 标准Quiver卡片 | 支持 |
| 转换表变换 | 不支持 |