Relative time(相对时间(Relative time))
The relative axis plot type can be used to plot series against a time-axis that is not absolute. Instead, you can plot relative to the source plot used.
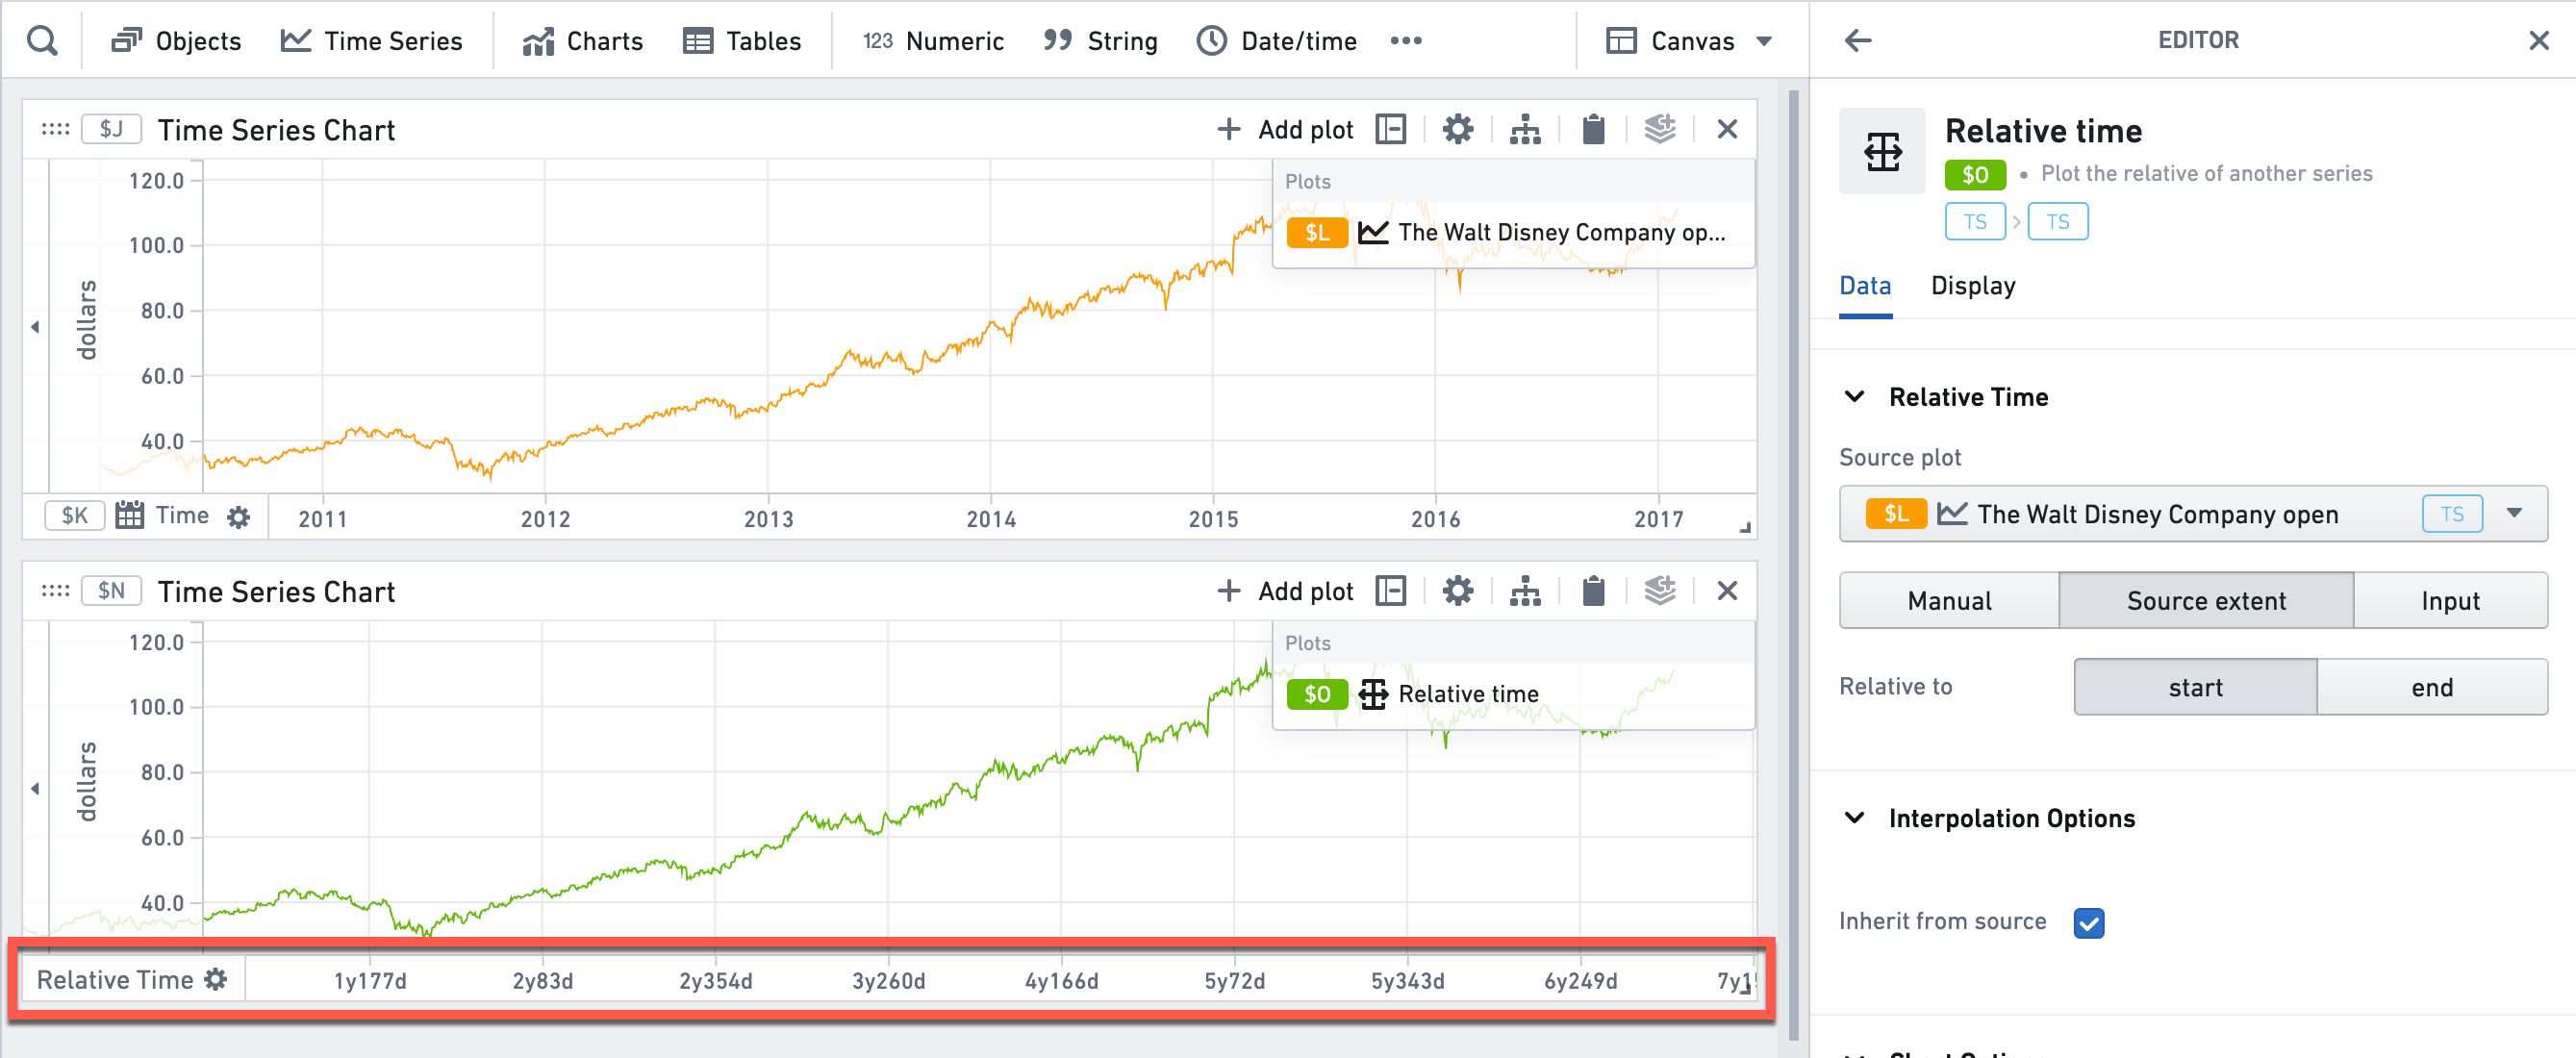
- In the example below, the relative axis is aligned to the start time of the series. Therefore, the X axis displays days/years since the first time point, instead of the absolute time.
- In addition to aligning to the source plot, you can also align to arbitrary time ranges, time series searches, or arbitrary custom dates.
Learn more about how to use relative time.
Input type
Time series
Output type
Time series
Examples
Usage information
| Functionality | Availability |
|---|---|
| Standard Quiver card | Supported |
| Transform table transform | Supported |
See also
中文翻译
相对时间(Relative time)
相对时间轴图表类型可用于绘制相对于非绝对时间轴的时间序列。您可以将其绘制为相对于所使用的源图表。
- 在下面的示例中,相对时间轴与序列的起始时间对齐。因此,X轴显示的是自第一个时间点以来的天数/年数,而非绝对时间。
- 除了与源图表对齐外,您还可以将其与任意时间范围(Time ranges)、时间序列搜索或任意自定义日期对齐。
了解更多关于如何使用相对时间的信息。
输入类型(Input type)
时间序列(Time series)
输出类型(Output type)
时间序列(Time series)
示例(Examples)
使用信息(Usage information)
| 功能 | 可用性 |
|---|---|
| 标准Quiver卡片(Standard Quiver card) | 支持 |
| 转换表转换(Transform table transform) | 支持 |