Scatter plot regression(散点图回归)
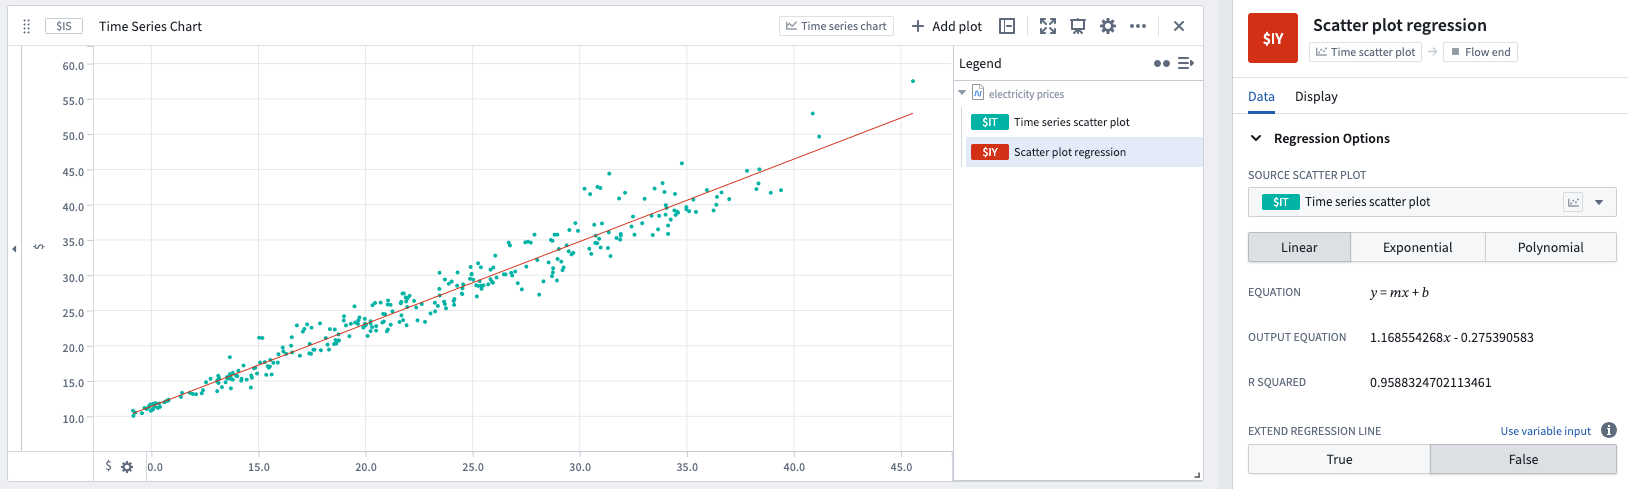
Scatter plot regression is used to view the best-fit regression line over a time series scatter plot.
- Linear, polynomial (of degree 0-13), or exponential regression fits can be chosen.
- The time range used to compute the best fit line is set by default to be the source plot zoom range, but can be modified to match a range instead.
Input type
Time series scatter plot
Output type
Time series
Examples
Usage information
| Functionality | Availability |
|---|---|
| Standard Quiver card | Supported |
| Transform table transform | Supported |
See also
中文翻译
散点图回归
散点图回归用于在时间序列散点图上查看最佳拟合回归线。
- 可选择线性、多项式(0-13阶)或指数回归拟合。
- 用于计算最佳拟合线的时间范围默认设置为源图表的缩放范围,但也可修改为匹配指定的范围。
输入类型
时间序列散点图
输出类型
时间序列
示例
使用信息
| 功能 | 可用性 |
|---|---|
| 标准 Quiver 卡片 | 支持 |
| 转换表转换 | 支持 |