Time series distribution(时间序列分布)
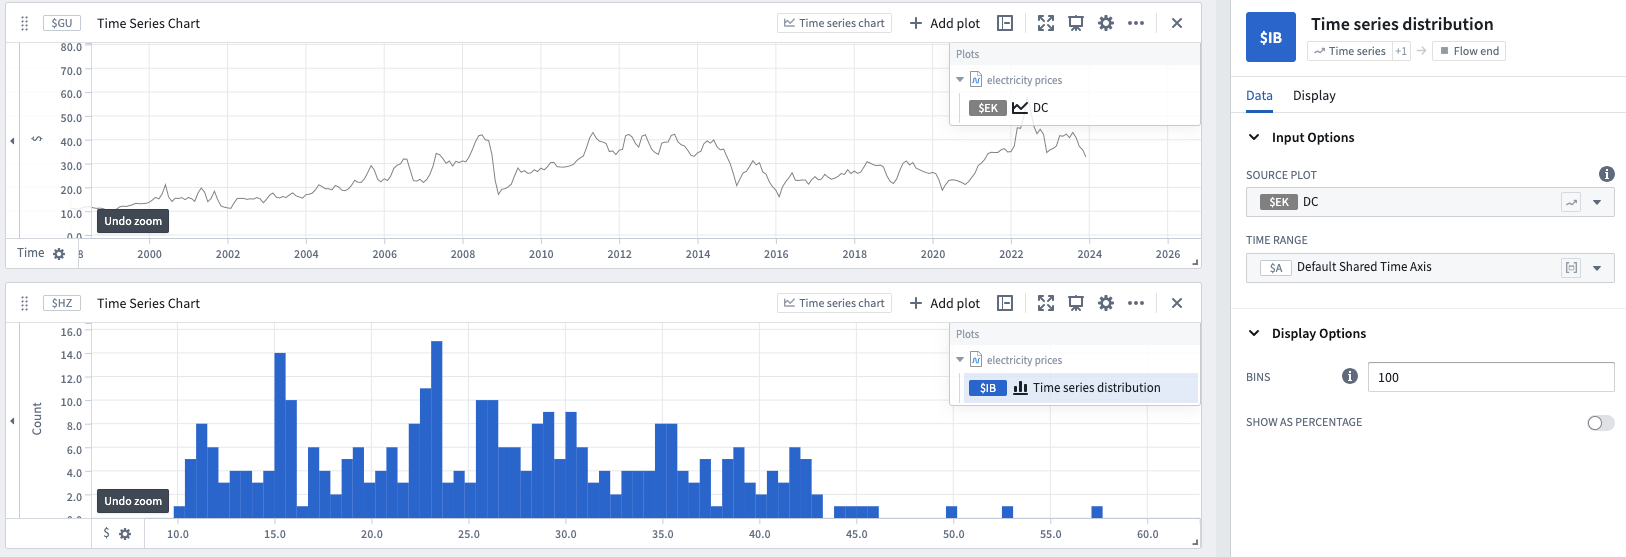
Distribution charts show the aggregate counts of the y-axis value of series.
- By default, the entire time range is used, but a time range parameter can be used to specify a certain time range.
- The number of bins can also be specified to change the frequency of the graph.
Input type
Time series
Output type
Flow end
Examples
Usage information
| Functionality | Availability |
|---|---|
| Standard Quiver card | Supported |
| Transform table transform | Unsupported |
中文翻译
时间序列分布
分布图展示序列中 y 轴数值的聚合计数。
- 默认情况下,使用整个时间范围,但可以通过时间范围参数来指定特定时间范围。
- 还可以指定分组数量(bins)来调整图表的频率。
输入类型
时间序列(Time series)
输出类型
流程终点(Flow end)
示例
使用信息
| 功能 | 支持情况 |
|---|---|
| 标准 Quiver 卡片 | 支持 |
| 转换表转换 | 不支持 |