Time series heat grid(时间序列热力图(Time series heat grid))
Heat grids display a two-dimensional aggregate value grid of two time series. Heat grids are similar to scatter plots, but instead color by the density of points appearing in the same bucket.
Input type
Time series
Output type
Flow end
Examples
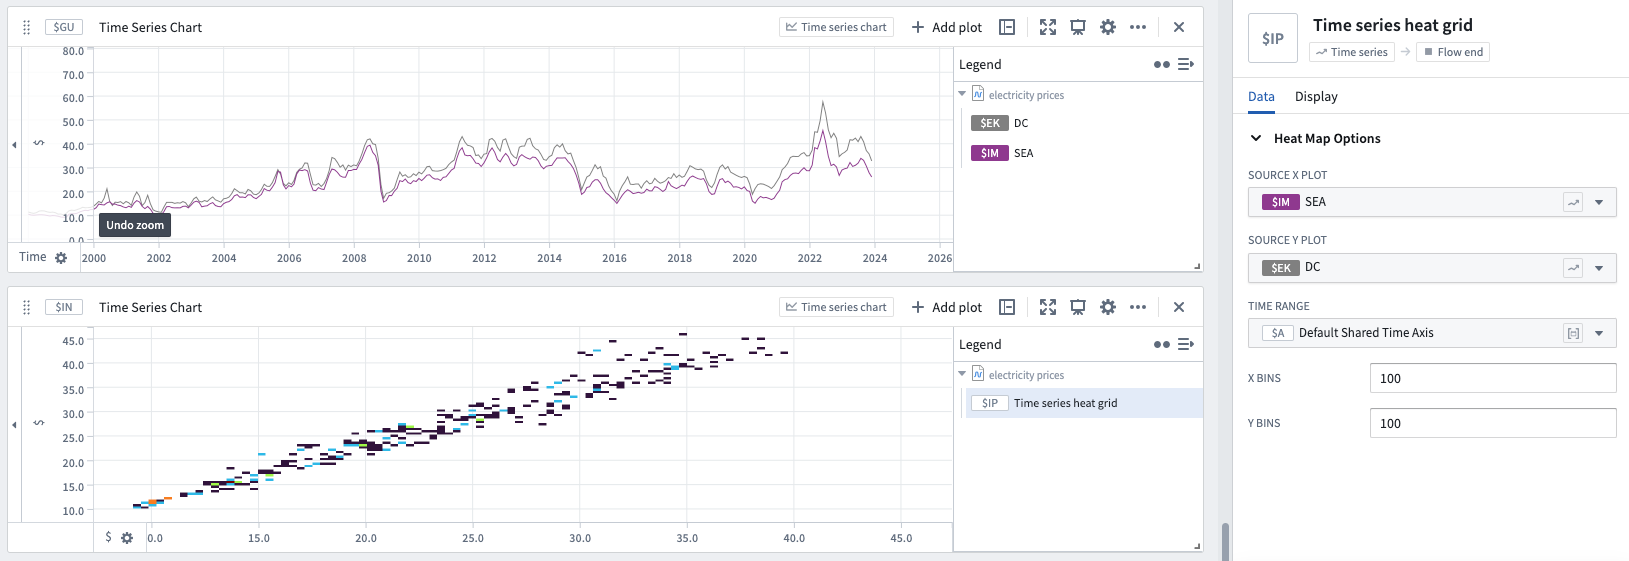
Usage information
| Functionality | Availability |
|---|---|
| Standard Quiver card | Supported |
| Transform table transform | Unsupported |
See also
中文翻译
时间序列热力图(Time series heat grid)
热力图以二维聚合值网格的形式展示两个时间序列的数据。热力图与散点图类似,但不同之处在于,它通过颜色来表示落入同一数据桶(bucket)中的点的密度。
输入类型
时间序列(Time series)
输出类型
流程终点(Flow end)
示例
使用信息
| 功能 | 支持情况 |
|---|---|
| 标准 Quiver 卡片 | 支持 |
| 转换表转换 | 不支持 |