Time series scatter plot(时间序列散点图)
Scatter plots can be used to plot two series against each other. Points of the underlying series will automatically be aggregated (using the average value over buckets that are 1/1000 of the underlying time range) before plotting.
- Both the bucketing strategy (the number of buckets and points per bucket), and the bucket value (for example, average, sum, max) can be specified.
- The range for each series included in the cross plot is automatically set to underlying the plot zoom range, but can be modified to a manual range instead.
Input type
Time series
Output type
Time series scatter plot
Examples
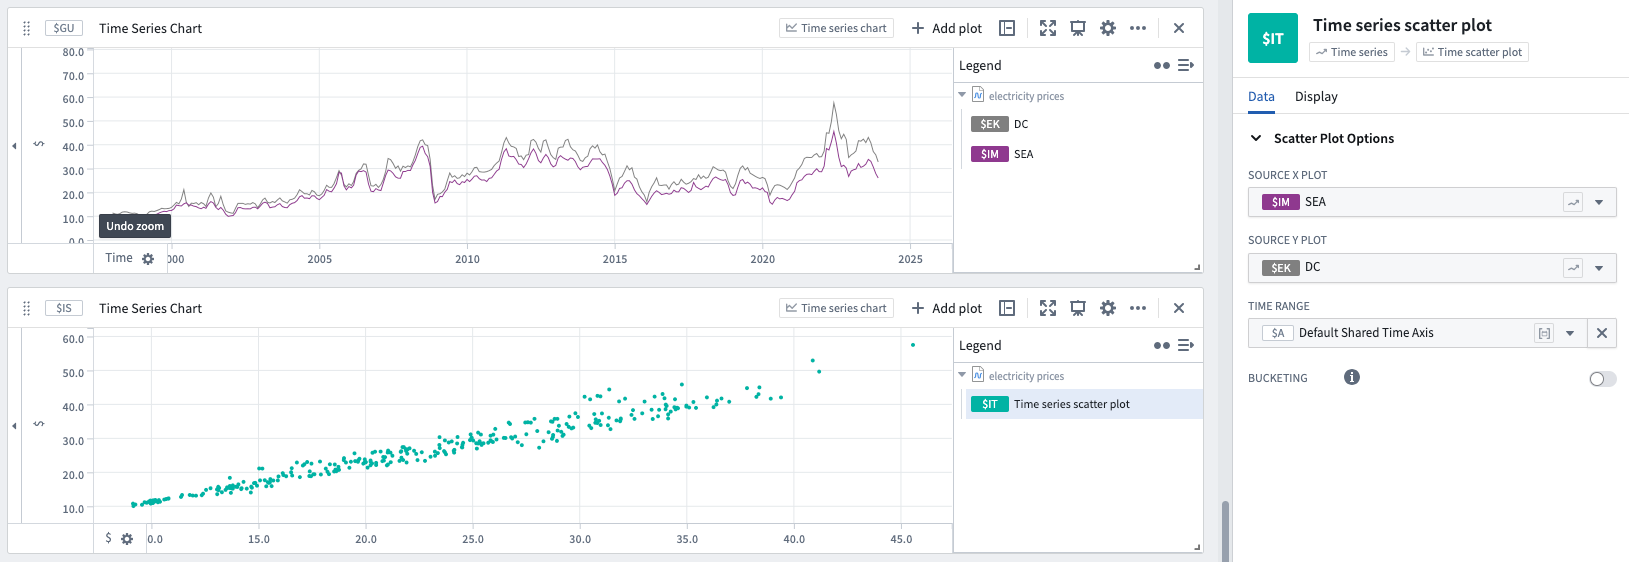
Usage information
| Functionality | Availability |
|---|---|
| Standard Quiver card | Supported |
| Transform table transform | Supported |
See also
中文翻译
时间序列散点图
散点图可用于将两个序列相互绘制。在绘图前,底层序列的数据点将自动进行聚合(使用底层时间范围1/1000的桶内平均值)。
- 可以指定分桶策略(桶的数量和每个桶内的点数)以及桶值(例如平均值、总和、最大值)。
- 交叉图中包含的每个序列的范围会自动设置为底层绘图缩放范围,但也可以修改为手动范围。
输入类型
时间序列
输出类型
时间序列散点图
示例
使用信息
| 功能 | 可用性 |
|---|---|
| 标准 Quiver 卡片 | 支持 |
| 转换表转换 | 支持 |