Event set cards(事件集卡片)
Back to: Index of cards
Cards in this section are used to visualize and analyze events in bulk. An event consists of a start and end timestamp, similar to a time range, but can also be enriched with other data to support analysis. To learn more about common events-based workflows, see the Analyze events data page.
:::callout{theme="neutral"} It is no longer required to configure an object set with event capabilities in Ontology Manager for event visualizations. Any object set with a timestamp property can be converted to an event set using the event set from tabular data card. :::
The following cards accept an event set and return an event set:
The following cards accept time ranges and return an event set:
The following cards accept a table and return an event set:
The following cards accept a time series and return an event set:
- Linked event set - this card also accepts an object as an input
- Time series search
The following are available visualizations for events:
Events plots
Every event set is visualized using an Events plot, which plots events on a time axis at the bottom of the chart. This feature can help to contextualize a time series plot or correlate events with observed phenomenon in the time series.
- Hovering over each event will show the details of that event. You can configure what details to display for each event through the Tooltip settings.
- Events are grouped based on the zoom level of the chart. Hovering over an event group shows a list of events in that group.
- The input data must have a date or timestamp property or column for it to be plottable as multiple events.
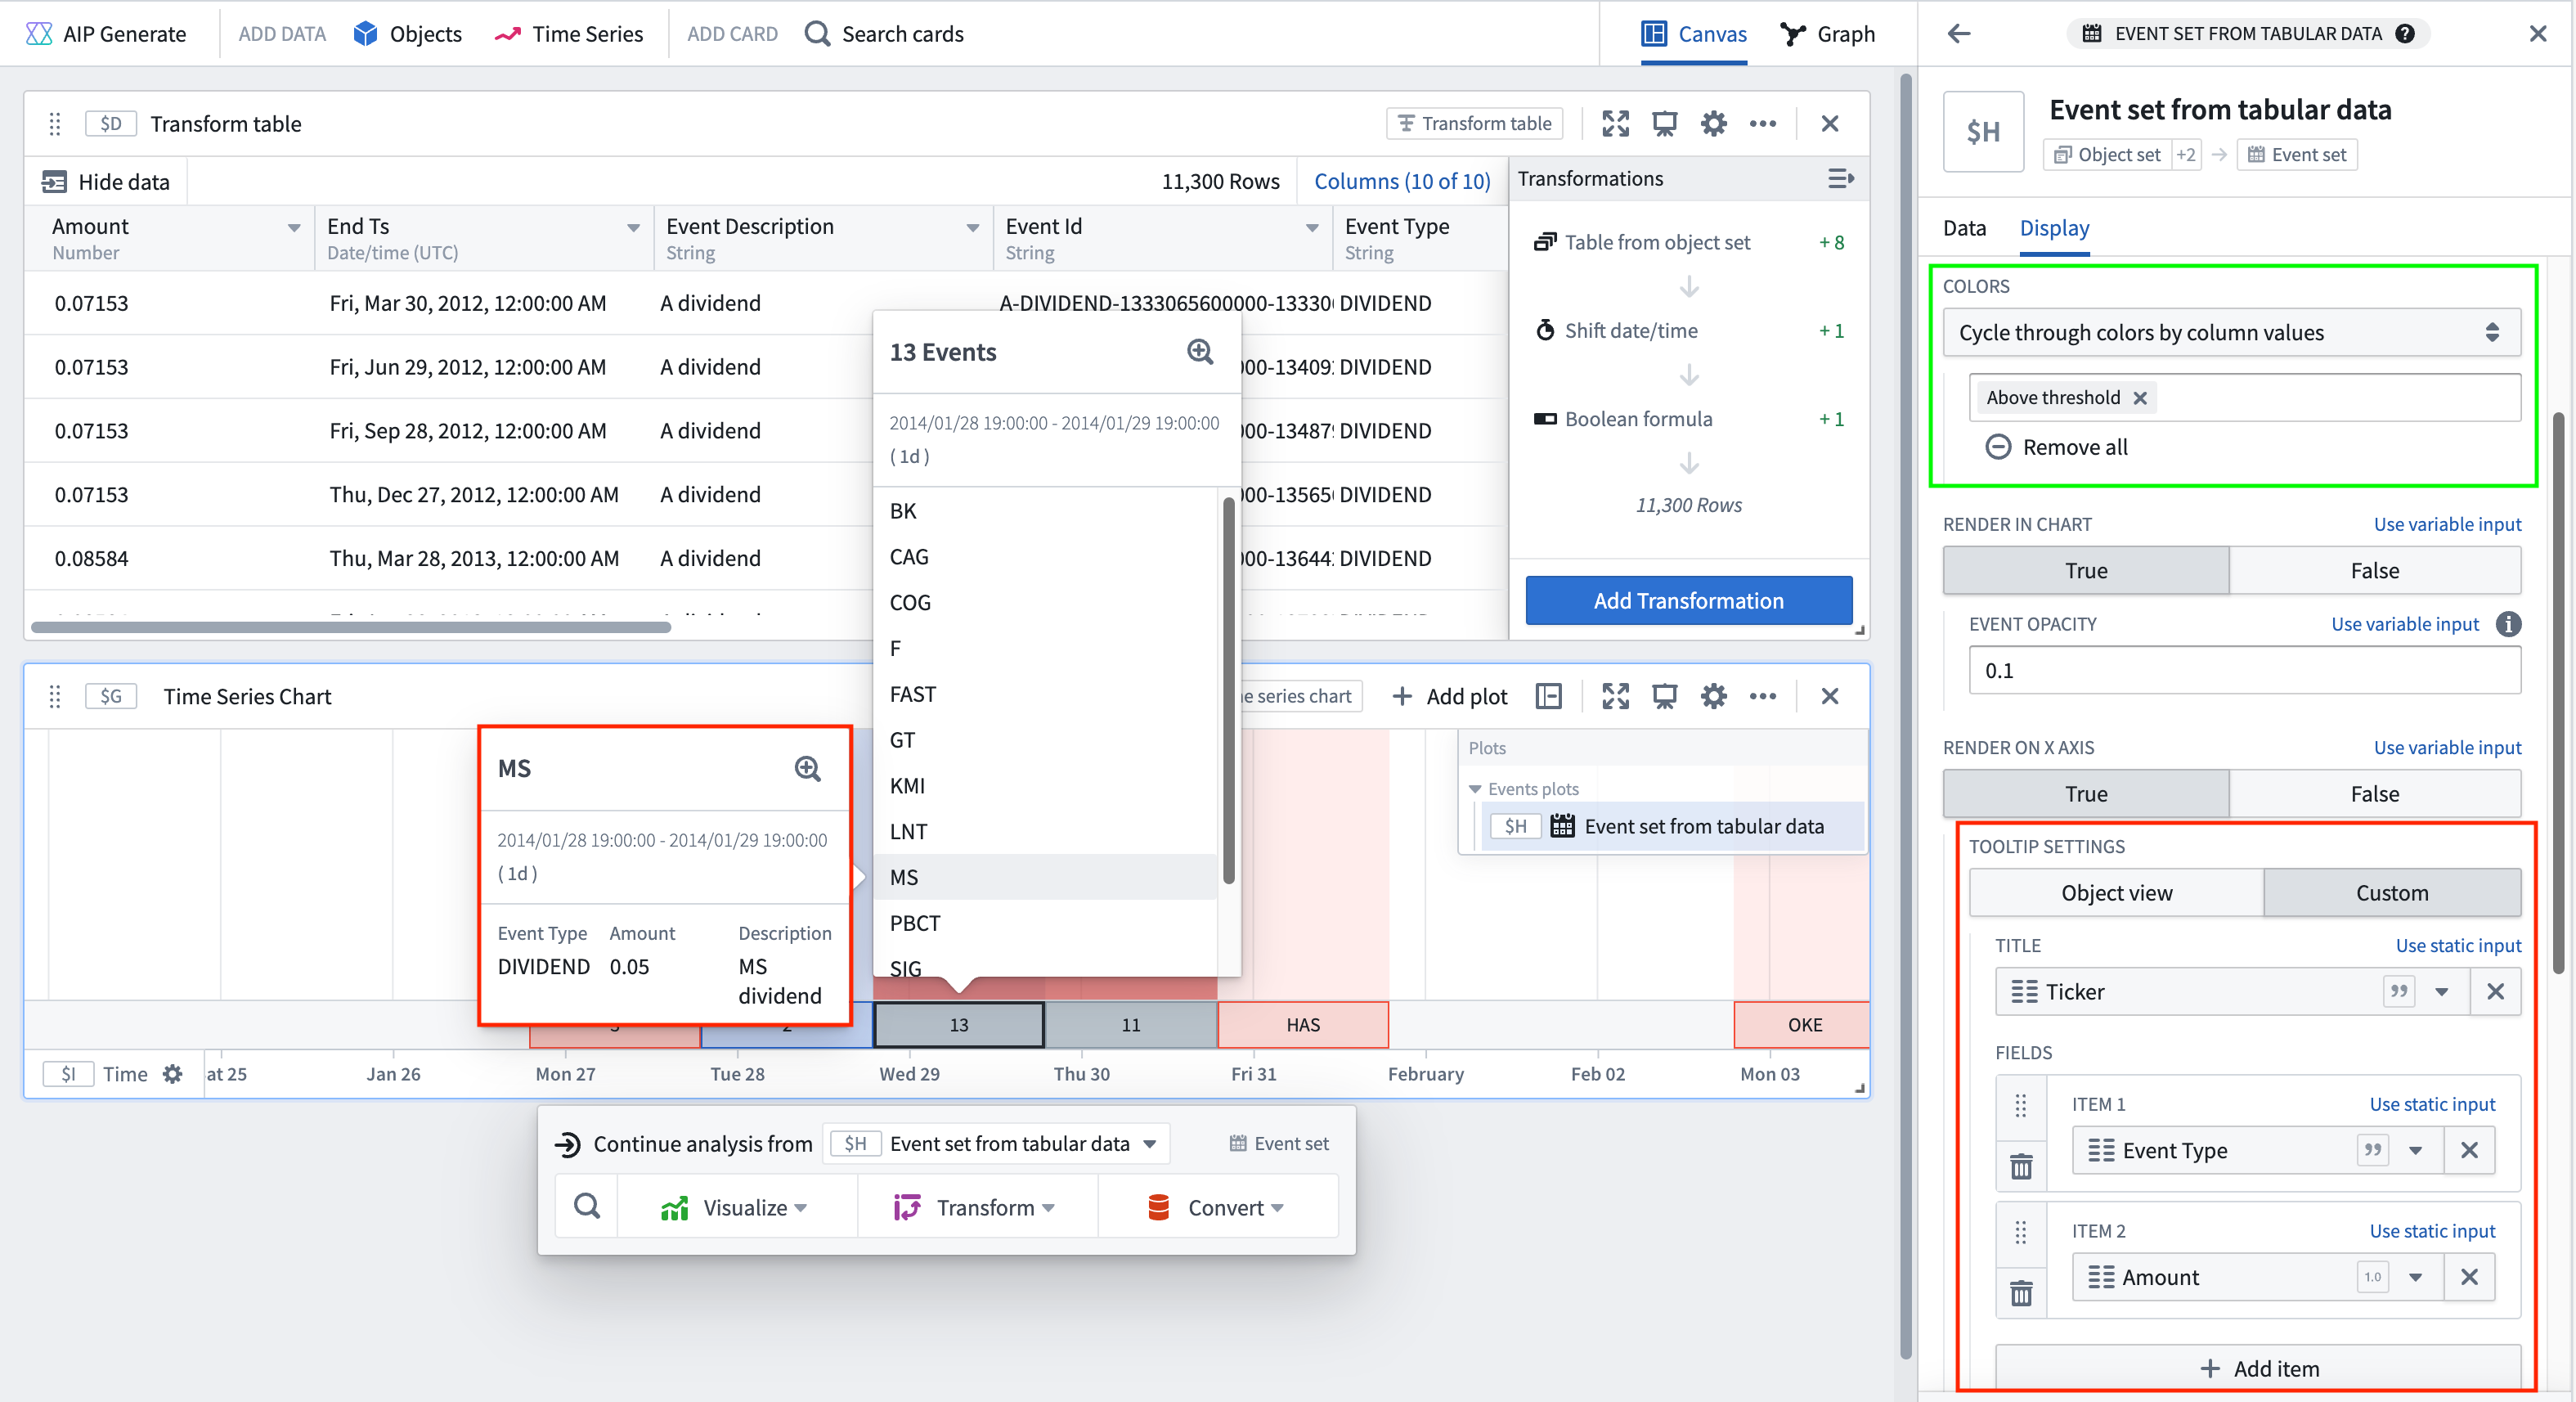
Event sets and events plots are backed by transform tables, where each row is treated as a single event. The backing transform table can be accessed through the next actions menu of the event set by selecting Convert > New transform table. You can use the backing transform table to modify or enrich the underlying event data. For example, you may want to compute a color label column for each event. You can then use the column to color code in the Colors settings under Event Options in the Display tab of the Editor panel.
Display options
From the Display tab of any events plot configuration, you can control how events are rendered on the chart, including the color, opacity, tooltip content, and location. Most settings can be applied at the individual event level by selecting an event column to supply the value, allowing for granular customization.
- Time series chart visibility: Quickly toggle the event set onto multiple time series charts to maintain context across visualizations. This is especially useful when comparing different time series over the same set of events. Note that as an events plot is only present on one time series chart, toggling it off of that chart will remove the plot from your analysis. Learn more.
- Colors: Configure how the color for each event is determined.
- Select color
- Single: Apply one color to all events in the event set.
- Variable: Use a property or column of the event set to supply the color for each event (represented by a hexadecimal color string).
- Cycle through colors by column value: Assign a different color for each value of a chosen property or column; colors are automatically assigned.
- Render in chart: Display events as highlights on the chart, with customizable opacity to control the visual prominence of events.
- Render on X axis: Show an events axis and customizable tooltips for each event on-hover. All tooltips show the event range and duration. The following tooltip options are available:
- Object view: Display the title and prominent properties of the object, as configured in the Ontology. This option is only supported if the event set is based on an object set or includes an object column.
- Custom: Select from the event set's columns to define the title and description for the event tooltip. Additional fields can be shown, along with event range and duration.
Events timeline
View an object set of events through time, segmented into categories if desired.
Does not support transform tables and only takes in an object set as input. Consider using Vega plots as an alternative visualization for an events timeline.
:::callout{theme="warning"} The events timeline chart only supports coloring if the number of events does not exceed the configured single event threshold. To adjust the event threshold, navigate to the Data tab and adjust the number in the Single event threshold field. Note that raising the threshold number may impact performance.
Alternatively, you can zoom in to a selected time frame to reduce the number of events in the chart view. :::
中文翻译
事件集卡片
返回:卡片索引
本节中的卡片用于批量可视化和分析事件。一个事件(event)由开始和结束时间戳组成,类似于时间范围,但还可以通过其他数据进行丰富以支持分析。要了解更多关于常见事件工作流的信息,请参阅分析事件数据页面。
:::callout{theme="neutral"} 现在不再需要在本体管理器中为事件可视化配置具有事件功能的对象集。任何带有时间戳属性的对象集都可以使用从表格数据创建事件集卡片转换为事件集。 :::
以下卡片接受事件集并返回事件集:
以下卡片接受时间范围并返回事件集:
以下卡片接受表格并返回事件集:
以下卡片接受时间序列并返回事件集:
以下是可用的事件可视化方式:
事件图
每个事件集都使用事件图(Events plot)进行可视化,该图在图表底部的时间轴上绘制事件。此功能有助于为时间序列图提供上下文,或将事件与时间序列中观察到的现象关联起来。
- 悬停在每个事件上会显示该事件的详细信息。您可以通过工具提示设置配置每个事件要显示的内容。
- 事件根据图表的缩放级别进行分组。悬停在事件组上会显示该组中的事件列表。
- 输入数据必须具有日期或时间戳属性或列,才能作为多个事件进行绘制。
事件集和事件图由转换表支持,其中每一行被视为一个单独的事件。可以通过事件集的下一步操作菜单访问底层转换表,选择转换 > 新建转换表。您可以使用底层转换表修改或丰富底层事件数据。例如,您可能希望为每个事件计算一个颜色标签列。然后,您可以在编辑器面板的显示选项卡中的事件选项下的颜色设置中使用该列进行颜色编码。
显示选项
在任何事件图配置的显示选项卡中,您可以控制事件在图表上的渲染方式,包括颜色、不透明度、工具提示内容和位置。大多数设置可以通过选择提供值的事件列在单个事件级别应用,从而实现精细的自定义。
- 时间序列图表可见性: 快速将事件集切换到多个时间序列图表上,以保持跨可视化上下文的连贯性。这在比较同一组事件上的不同时间序列时特别有用。请注意,由于事件图仅存在于一个时间序列图表上,将其从该图表上关闭将从您的分析中移除该图。了解更多。
- 颜色: 配置如何确定每个事件的颜色。
- 选择颜色
- 单一: 为事件集中的所有事件应用一种颜色。
- 变量: 使用事件集的属性或列来提供每个事件的颜色(以十六进制颜色字符串表示)。
- 按列值循环颜色: 为所选属性或列的每个值分配不同的颜色;颜色会自动分配。
- 在图表中渲染: 将事件显示为图表上的高亮,可通过自定义不透明度控制事件的视觉突出程度。
- 在X轴上渲染: 显示事件轴,并为每个事件悬停时显示可自定义的工具提示。所有工具提示都显示事件范围和持续时间。以下工具提示选项可用:
- 对象视图: 显示对象的标题和突出属性,按本体中的配置显示。仅当事件集基于对象集或包含对象列时才支持此选项。
- 自定义: 从事件集的列中选择以定义事件工具提示的标题和描述。可以显示其他字段以及事件范围和持续时间。
事件时间线
按时间查看事件的对象集,如果需要,可以按类别分段。
不支持转换表,仅接受对象集作为输入。考虑使用Vega图作为事件时间线的替代可视化方式。
:::callout{theme="warning"} 事件时间线图表仅在事件数量不超过配置的单个事件阈值时才支持着色。要调整事件阈值,请导航到数据选项卡,并调整单个事件阈值字段中的数字。请注意,提高阈值数字可能会影响性能。
或者,您可以缩放到选定的时间范围以减少图表视图中的事件数量。 :::