Writeback cards(写回卡片 (Writeback cards))
Back to: Index of cards
Action buttons can be added to your Quiver analysis canvas, time series charts, and dashboards to allow users to write data back to the Ontology; for example, by creating objects, updating properties on existing objects, or modifying object links.
- Add and configure an Action button
- Invoke Ontology Actions directly from a time series chart
- Use selection boundary values as input to Ontology Actions
- Customize the button display
Examples
This capability can be used to enhance a variety of workflows, including:
Example 1: Create an Annotation object instance
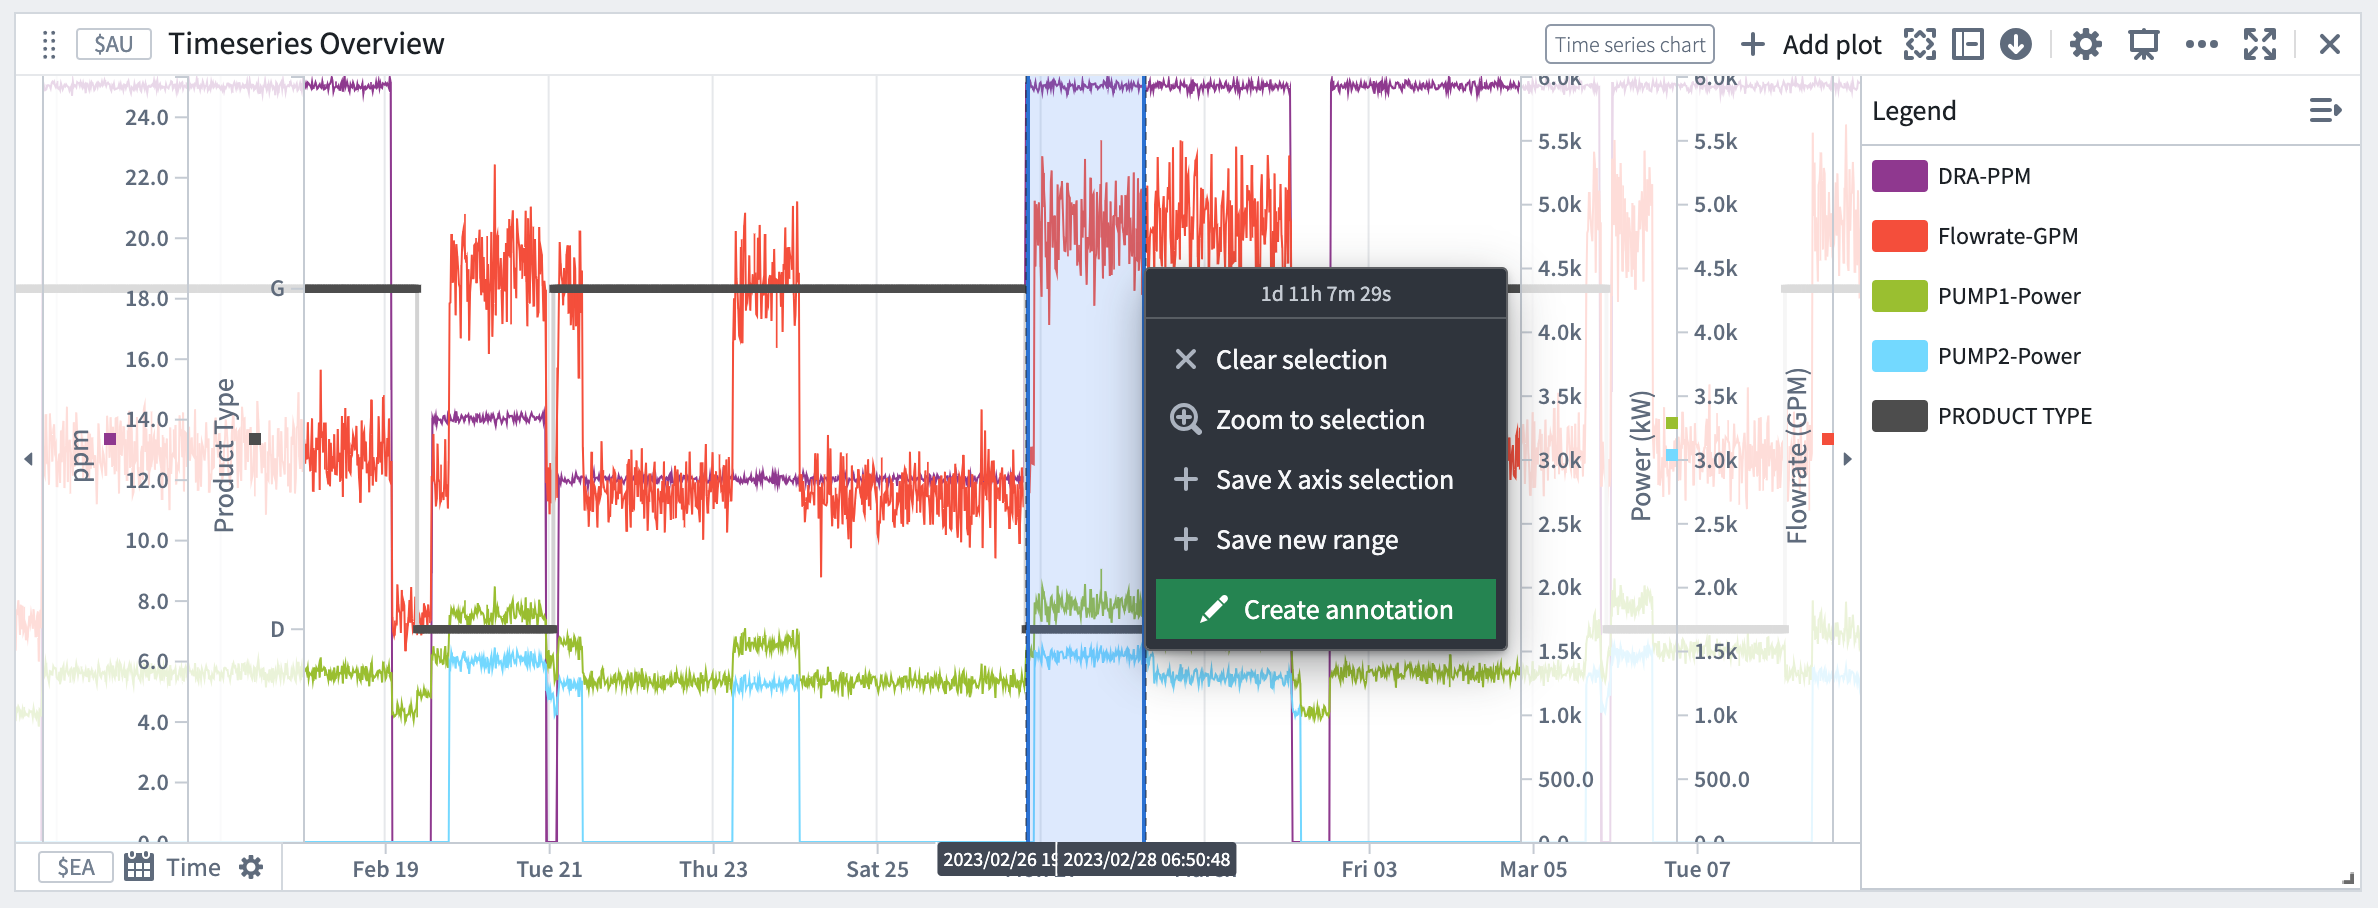
Within a time series chart, you can create an object that captures context on an observed phenomenon, such as reasons for a machinery malfunction or a market macro event that affected a stock index. The start and end temporal values of the x-axis selection are passed as inputs to the Create annotation Ontology Action, resulting in an annotation event. The ability to annotate the plot with multiple events provides greater clarity on the data visuals at hand.
Example 2: Adjust operational values
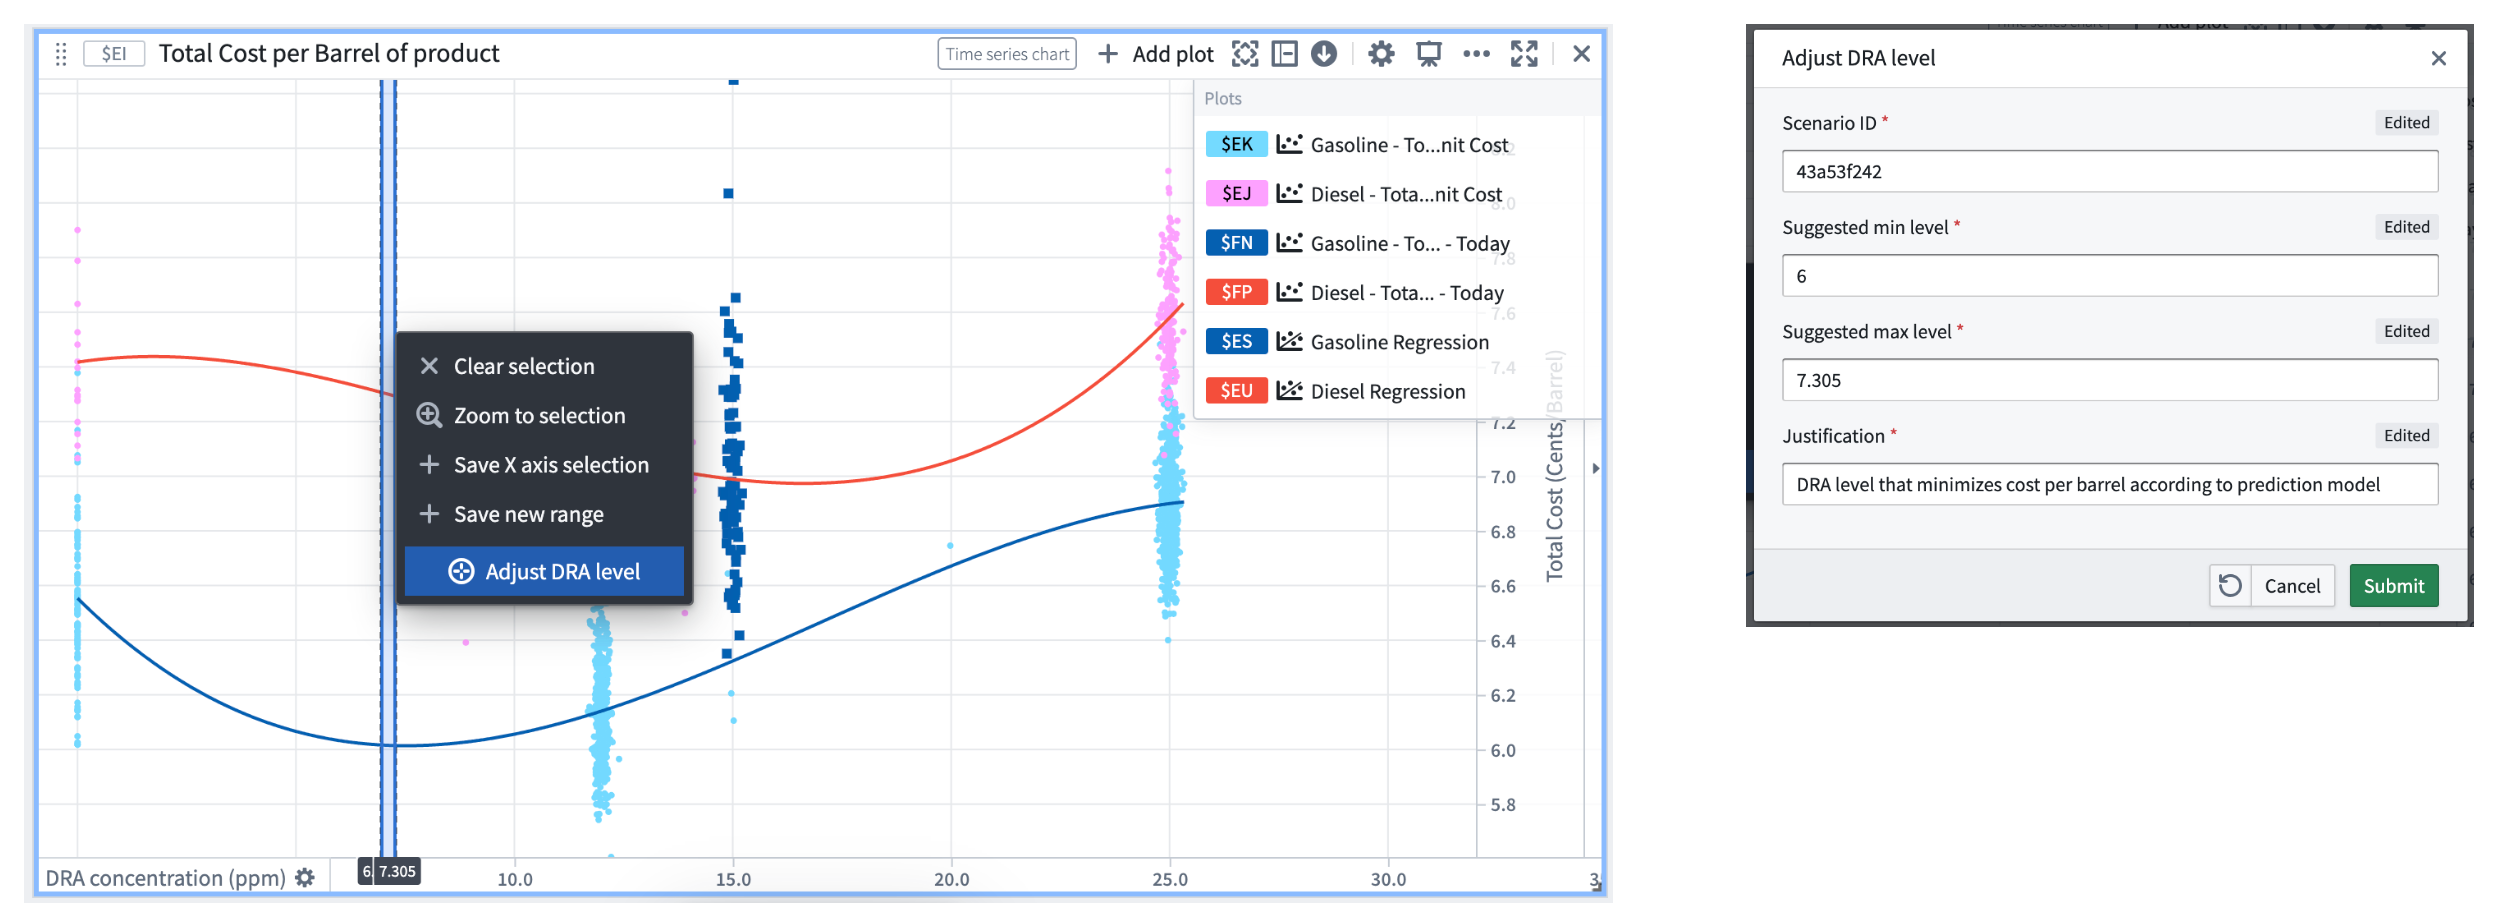
You can also invoke an Ontology Action to update a property value based on an observed phenomenon. For example, the time series chart below displays two curves that show the predicted total cost per barrel for two types of products, Gasoline (in blue) and Diesel (in red). We can note that today’s actual total cost per barrel (y-axis) for Gasoline (dark blue dots) ranges from 6.35 to 8.45 cents/barrel and is far from the minimal predicted total cost which is 6.01 cents/barrel. To lower the production cost we can adjust the DRA concentration rate from 15 ppm to a value closer to 6.5 ppm. By selecting a range around 6 on the x-axis, we can then select the Adjust DRA level Ontology Action which will be set with the selection boundary values automatically.
Add and configure an Action button
To add an Action button to an analysis:
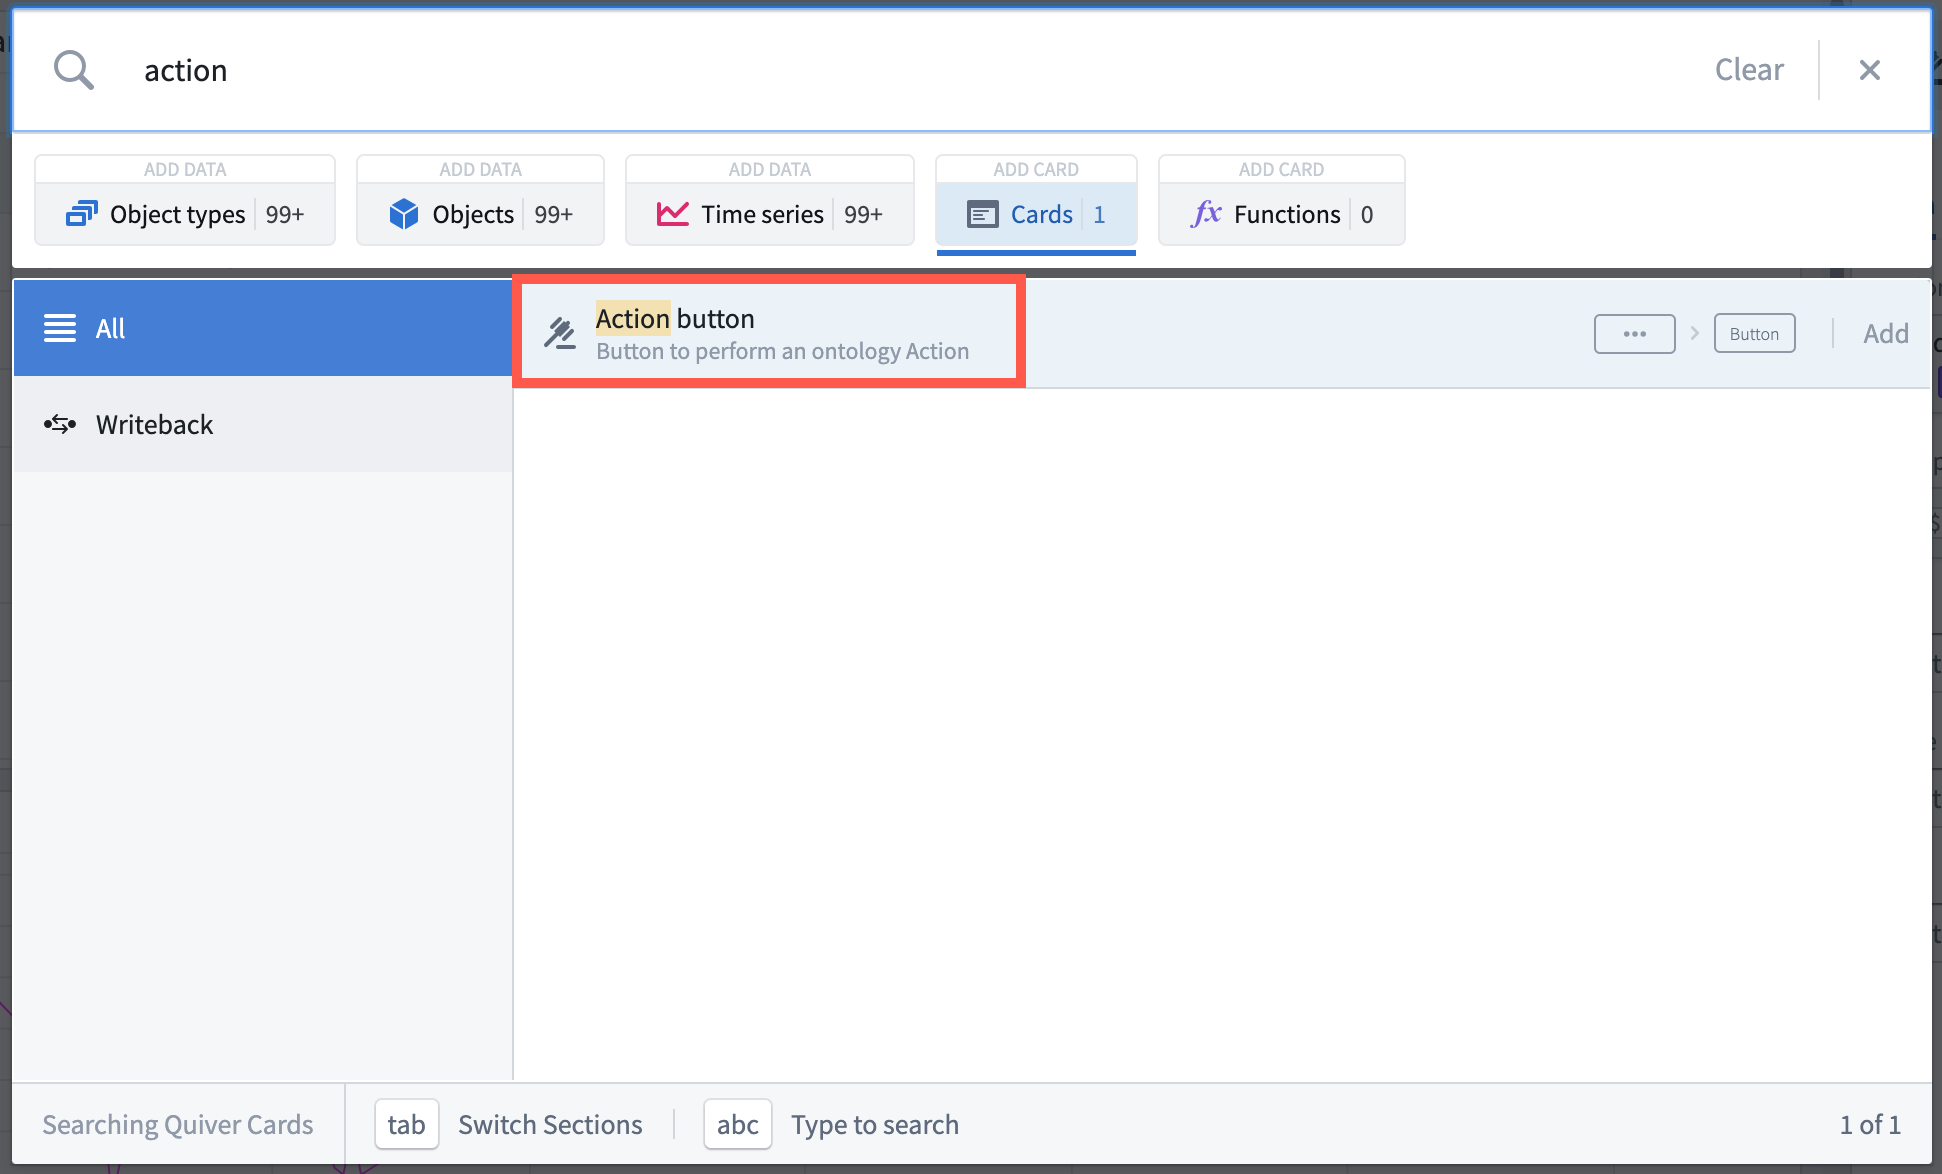
- Open the search bar by selecting Search cards from the analysis top bar.
- Search for
actionor navigate to the Writeback category on the left. - Select the Action button card.
To configure an Action button card:
- Find the Action button in the Parameter panel.
- Open the Action button editor by selecting the Configure cog wheel icon.
- Select an existing Ontology Action from the dropdown list. If the Action does not exist yet, you will need to create a new Action in the Ontology.

Selecting the Action button displays a form to fill out the inputs and submit the action. In the Action button editor, default inputs can be provided.
For example, in the following image, the Event start parameter is configured with a default value of January 1, 2010.

Selecting the action button shows January 1, 2010 as the input value for Event start parameter. Users can still edit this value before submitting the action.

Invoke Ontology Actions directly from a time series chart
It is possible to expose Ontology Action buttons directly from the selection menu of a time series chart. To add an Action button to a time series chart selection menu:
- Open the time series chart editor by selecting the Configure cog wheel icon on the card header.
- Under the Action Buttons section, open the dropdown and select an existing Action button from the analysis or create a new one. The Ontology action button will now be visible in the selection menu.

Use selection boundary values as input to Ontology Actions
When an Ontology Action button is added to a time series chart, the inputs to the Ontology action can be parameterzied using the boundary values of the x- or y-axis selection.
To use the selection boundary values as Ontology Action inputs:
- Open the Action button editor and expand the Time Series Chart Input Override section.
- Add overrides based on x-axis selection, y-axis selection, or both. The selection boundaries are mapped to an action parameter based on the data type. For example, x-axis selections on a time axis can be mapped to a date/time action parameter.

In the following example, the selection left and right bounds were mapped to the Event start and Event end parameters. Selecting the action button from the time series chart selection menu auto-populates those values.

Customize the button display
You can customize the appearance of the button in the Display tab of the Action button editor. You can choose a label, an icon, a color, and a style.

中文翻译
写回卡片 (Writeback cards)
返回:卡片索引
操作按钮 (Action buttons) 可添加到您的 Quiver 分析画布、时序图表和仪表板中,允许用户将数据写回到本体 (Ontology);例如,通过创建对象、更新现有对象的属性或修改对象链接。
示例
此功能可用于增强多种工作流程,包括:
示例 1:创建一个 Annotation 对象实例
在时序图表中,您可以创建一个对象来捕获观察到的现象的上下文,例如机械故障的原因或影响股票指数的市场宏观事件。x 轴选择的开始和结束时间值将作为输入传递给 Create annotation 本体操作 (Ontology Action),从而生成一个注释事件。使用多个事件注释图表的能力可以更清晰地呈现当前的数据可视化效果。
示例 2:调整操作值
您还可以调用本体操作来根据观察到的现象更新属性值。例如,下面的时序图表显示了两条曲线,分别展示了两种产品(汽油(蓝色)和柴油(红色))的每桶预测总成本。我们可以注意到,今天汽油(深蓝色点)的实际每桶总成本(y 轴)范围在 6.35 到 8.45 美分/桶之间,远低于 6.01 美分/桶的最低预测总成本。为了降低生产成本,我们可以将 DRA 浓度从 15 ppm 调整到更接近 6.5 ppm 的值。通过在 x 轴上选择 6 附近的范围,然后选择 调整 DRA 水平 (Adjust DRA level) 本体操作,该操作将自动设置选择边界值。
添加和配置操作按钮
要将操作按钮添加到分析中:
- 通过从分析顶部栏选择 搜索卡片 (Search cards) 打开搜索栏。
- 搜索
action或导航到左侧的 写回 (Writeback) 类别。 - 选择 操作按钮 (Action button) 卡片。
要配置操作按钮卡片:
- 在参数面板中找到操作按钮。
- 通过选择 配置 (Configure) 齿轮图标打开操作按钮编辑器。
- 从下拉列表中选择一个现有的本体操作 (Action)。如果该操作尚不存在,您需要在本体中创建一个新操作。
选择操作按钮会显示一个表单,用于填写输入并提交操作。在操作按钮编辑器中,可以提供默认输入。
例如,在下图中,Event start 参数配置了默认值 2010 年 1 月 1 日。
选择操作按钮会显示 2010 年 1 月 1 日作为 Event start 参数的输入值。用户在提交操作之前仍然可以编辑此值。
直接从时序图表调用本体操作
可以直接从时序图表的选择菜单中公开 本体操作 (Ontology Action) 按钮。要将操作按钮添加到时序图表的选择菜单:
- 通过选择卡片标题上的 配置 (Configure) 齿轮图标打开时序图表编辑器。
- 在 操作按钮 (Action Buttons) 部分,打开下拉菜单并选择分析中现有的操作按钮,或创建一个新的操作按钮。本体操作按钮现在将显示在选择菜单中。
使用选择边界值作为本体操作的输入
当操作按钮添加到时序图表时,本体操作的输入可以使用 x 轴或 y 轴选择的边界值进行参数化。
要将选择边界值用作本体操作输入:
- 打开操作按钮编辑器并展开 时序图表输入覆盖 (Time Series Chart Input Override) 部分。
- 基于 x 轴选择、y 轴选择或两者添加覆盖。选择边界根据数据类型映射到操作参数。例如,时间轴上的 x 轴选择可以映射到日期/时间操作参数。
在以下示例中,选择的左右边界被映射到 Event start 和 Event end 参数。从时序图表选择菜单中选择操作按钮会自动填充这些值。
自定义按钮显示
您可以在操作按钮编辑器的 显示 (Display) 选项卡中自定义按钮的外观。您可以选择标签、图标、颜色和样式。