Interpolation in Quiver(Quiver 中的插值)
This guide explains how interpolation is used by time-series-related cards in Quiver. For general information on interpolation and its use in time series, see this overview.
Interpolation in Quiver cards
In Quiver, interpolation settings can be applied on each time series card. Cards can either explicitly define an interpolation setting or "inherit from source", meaning that the card will derive an interpolation setting from its inputs. For time series properties loaded from the Ontology, cards that "inherit from source" will use an interpolation based on the formatting settings. For other data transformations, cards that "inherit from source" will use the interpolation defined in their input plot.
The available interpolation strategies include:
Before: Choose the strategy that Quiver uses to interpolate (infer) the value of a series before the first data point.
- Nearest: Use the value of the nearest point. This option yields a stepped line.
- None: Do not interpolate this series. This option yields discrete points.
Internal: Choose the strategy that Quiver uses to interpolate (infer) the value of a series between data points.
- Linear: Fit a straight line between the two nearest points. This option yields an angled line and is available for numeric time series, but not categorical/enum time series.
- Nearest: Use the value of the nearest point. This option yields a stepped line.
- Next: Use the value of the next point. This option yields a stepped line.
- Previous: Use the value of the previous point. This option yields a stepped line.
- None: Do not interpolate this series. This option yields discrete points.
After: Choose the strategy that Quiver uses to interpolate (infer) the value of a series after the last data point.
- Nearest: Use the value of the nearest point. This option yields a stepped line.
- None: Do not interpolate this series. This option yields discrete points.
How interpolation affects data transformations
When combining multiple series, the points that are used to build the output series are dependent on the respective interpolations of the input series. Refer to the interpolation documentation for more information on how the output series are computed.
How interpolation affects data visualization
Quiver also uses interpolation as a visual tool for displaying time series data. The shape of the time series line between any two points can be changed by the internal interpolation setting. Additionally, the Show interpolation line setting in the analysis settings can be used to show a line before the first point or after the last point if the external interpolation (before or after setting) is not NONE for that series.
:::callout{theme="warning"} The visual representation of interpolation may not be representative of the underlying data transformation. See the time series search section below for an example. :::
Quiver cards that use interpolation for data transformation
The following Quiver cards use interpolation to compute the output of the card:
- Value at time
- Time series formula
- Filter time series
- Linear aggregation
- Time series search
- Sample
- Combine time series
Value at time
Both the Value at time and the Enum value at time cards use interpolation to retrieve the value of a series at a specified time. If the series does not have a data point at the queried timestamp, the card generates a value using the chosen interpolation method on the closest data points before and after the queried timestamp. You can also specify a specific interpolation strategy to use instead of using the source plot's interpolation.
Time series formula
The Time series formula card only uses interpolation when joining multiple series together. For example, if you have a formula such as $E + $F, where $E and $F are two time series that may not share all of the same points, then interpolation settings will determine the set of points over which the output series is calculated. If any of the time series do not have interpolation defined, the output series will include all points at the intersection of all series with no interpolation. Otherwise, if all the series have interpolation defined, the output series will have values at any point which is present in any of the input series.
Filter time series
Interpolation is only used in the Filter time series card when joining multiple series together (similar to the time series formula card). If you have a condition such as $E + $F > 100, the Filter time series card will first use interpolation to combine the two series before applying the > 100 condition to the combined series.
If you have a condition such as $E > 10 && $F > 100, the Filter time series card will use the interpolation of each series to determine which timestamps to evaluate the condition over. For instance, if E has no interpolation set, but F has a defined interpolation, then the card would only evaluate the condition $E > 10 && $F > 100 at timestamps where E contains a value and display the output accordingly.
To summarize, the output series depends on the interpolation settings of the input series.
Linear aggregation
The Linear aggregation card uses interpolation when joining together multiple series to perform the specified aggregation. If one or more series do not have interpolation defined, then the linear aggregation may create partial aggregates. A partial aggregate is a timestamp in which some series do not contain a value, due to a lack of overlapping points and no defined interpolation.
You can configure whether you want to keep these partial aggregates in the output series using the Include partial aggregates in the card's editor.
For example, assume you have three time series A, B, and C, in which B and C have no interpolation and series A uses linear interpolation.
| Timestamps | Series A | Series B | Series C | Expected A + B + C |
|---|---|---|---|---|
| 2025/02/02 00:00:00 | 1 | 2 | 0 | 3 |
| 2025/02/03 00:00:00 | 2 | 1 | 5 | |
| 2025/02/04 00:00:00 | 3 | 2 | ||
| 2025/02/05 00:00:00 | 4 | 2 | 3 | 9 |
| 2025/02/06 00:00:00 | 5 | 2 |
If you perform a linear aggregation sum of the three series when Include partial aggregates is off, you would see the following:
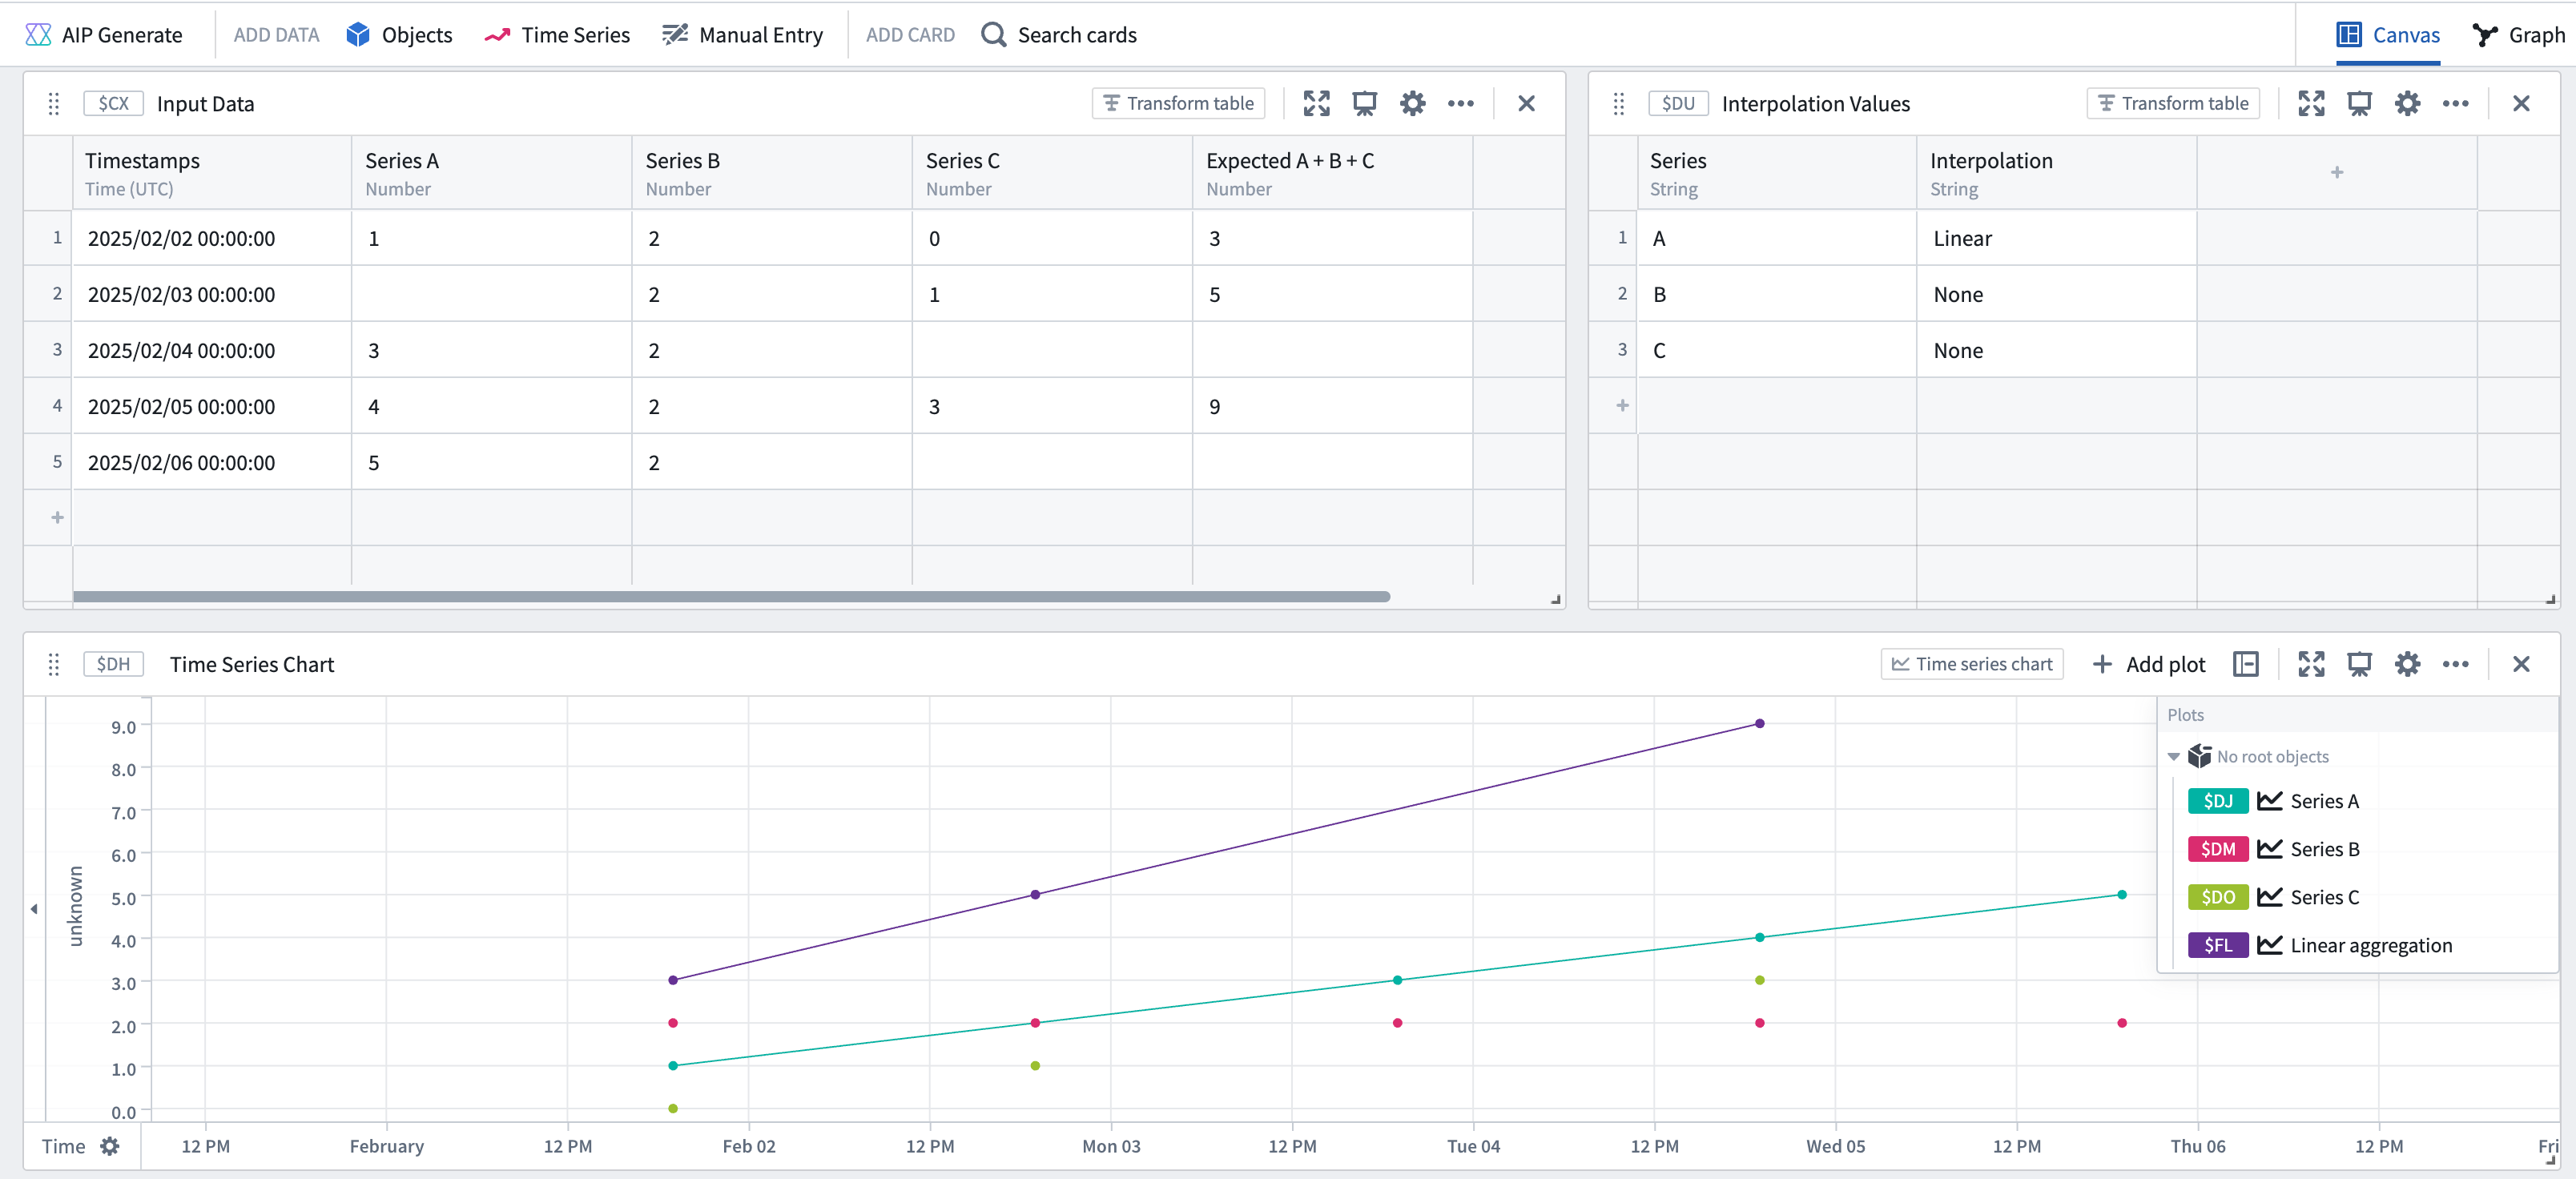
The resulting series in the screenshot above is equivalent to the time series formula of A + B + C, where points only exist at the intersection of the two series (B and C) which have no interpolation defined. If you perform a linear aggregation sum of the three series when "Include partial aggregates" is on, you would see the following:
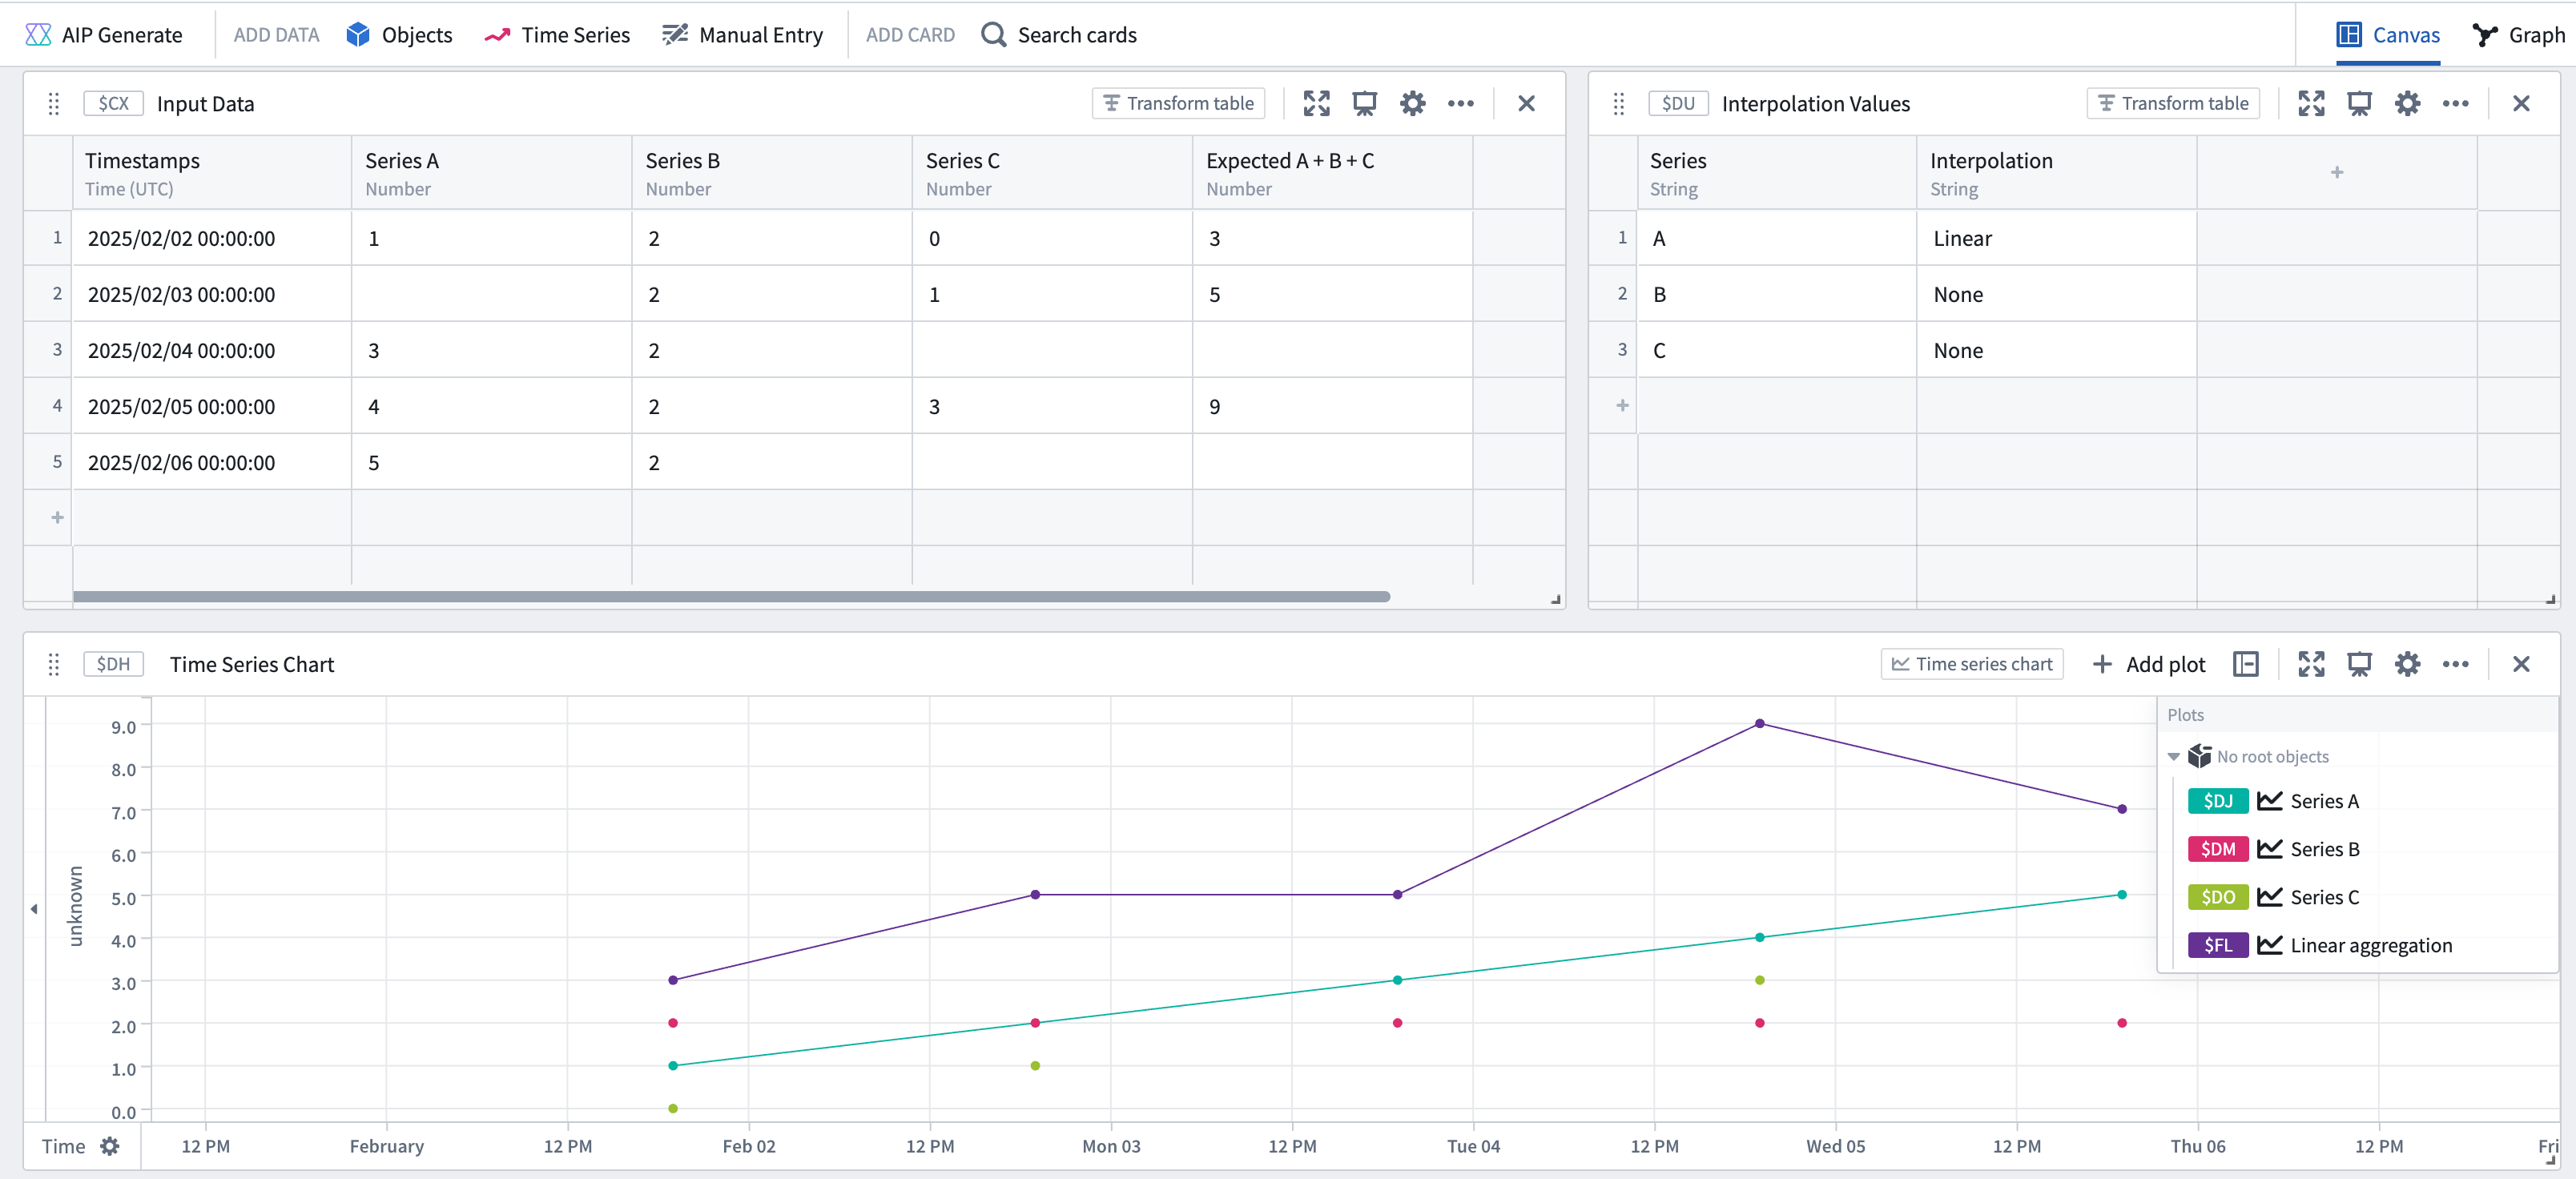
Specifically, the screenshot above shows that the resulting series has points at every timestamp present in any of the input series. The value at each timestamp is computed using the value in each series at that point (if it exists) or the interpolated value at that timestamp (if interpolation is set for that series).
Time series search
The Time series search card uses interpolation to combine multiple series together. For example, if your search formula contains $E > 50 && $F > 50 then the Time series search card would use interpolation to compute what events satisfy the combined condition. This is similar to how the time series formula and time series filter cards behave.
Although the visualization of the combined series may suggest that the condition was met at an earlier timestamp, the start and end of events identified by the search are determined solely by timestamps that exist in the combined series.
For example, assume you have three time series A, B, and C, in which series A and B use linear interpolation and series C has no interpolation.
| Timestamps | Series A | Series B | Series C | Expected A + B + C |
|---|---|---|---|---|
| 2025/02/02 00:00:00 | 1 | 2 | 0 | 3 |
| 2025/02/03 00:00:00 | 2 | 1 | 5 | |
| 2025/02/04 00:00:00 | 3 | 2 | ||
| 2025/02/05 00:00:00 | 4 | 2 | 3 | 9 |
| 2025/02/06 00:00:00 | 5 | 2 |
If you want to search for points when the sum of the three series is >= 6, your search would look as follows:
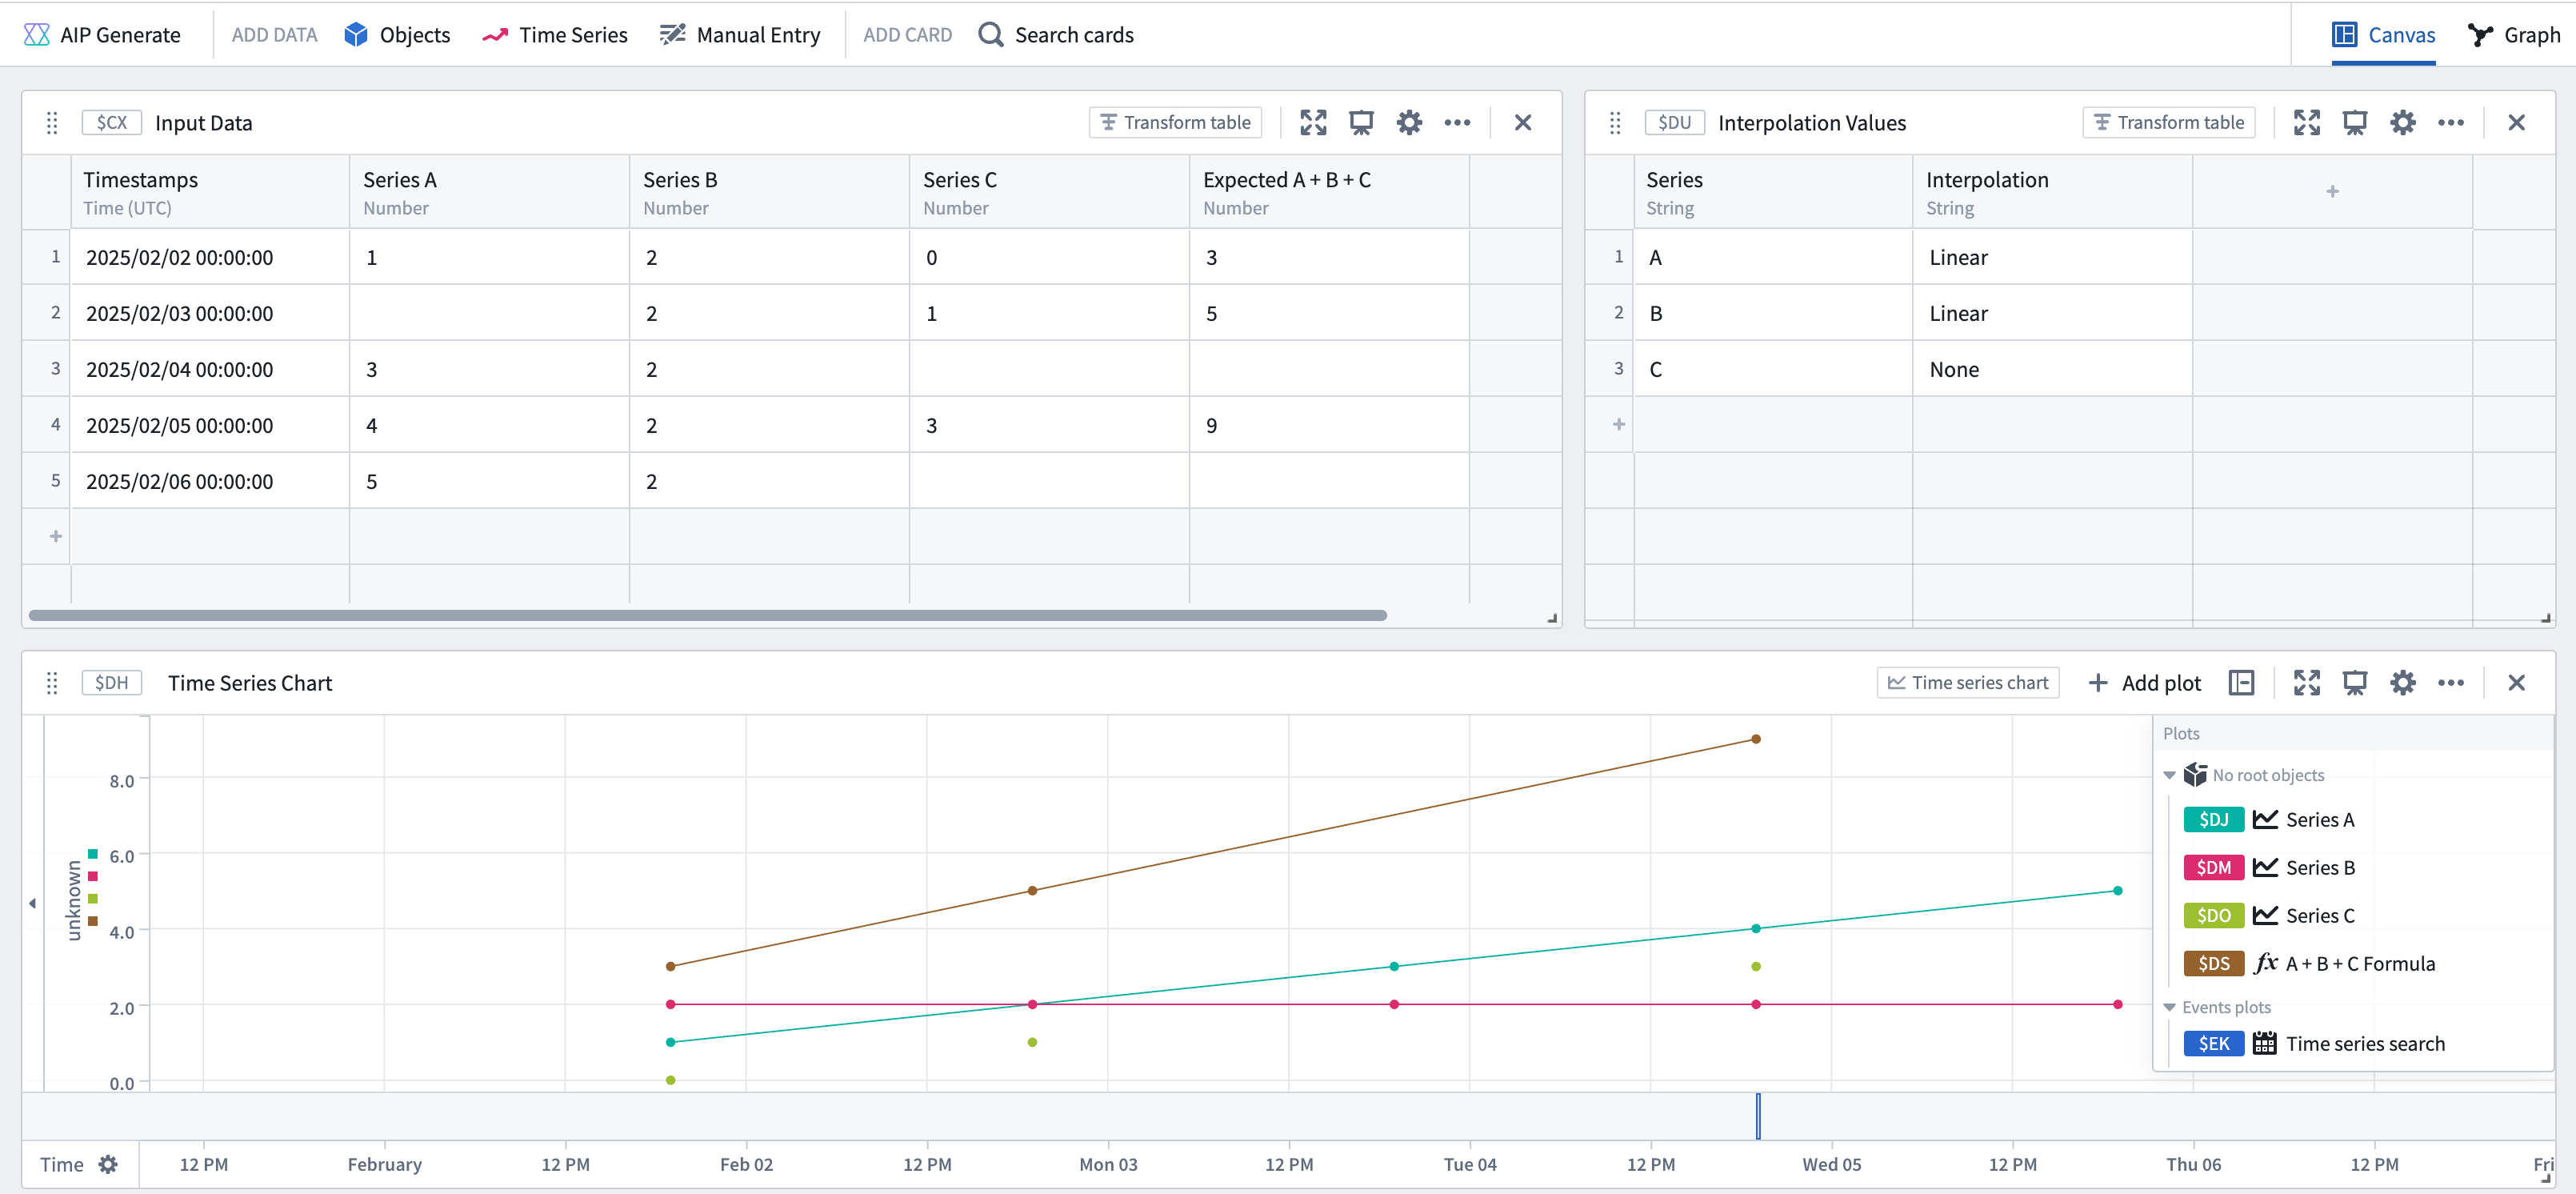
Although visually, the combined series "crosses" the threshold of 6 much earlier than the resulting event start, the event starts from the first actual point in the combined series that satisfies the condition. That point also happens to be the end of the event, because there are no more points after in the combined series. In contrast, if you have interpolation on series C as well, you would get the following result:
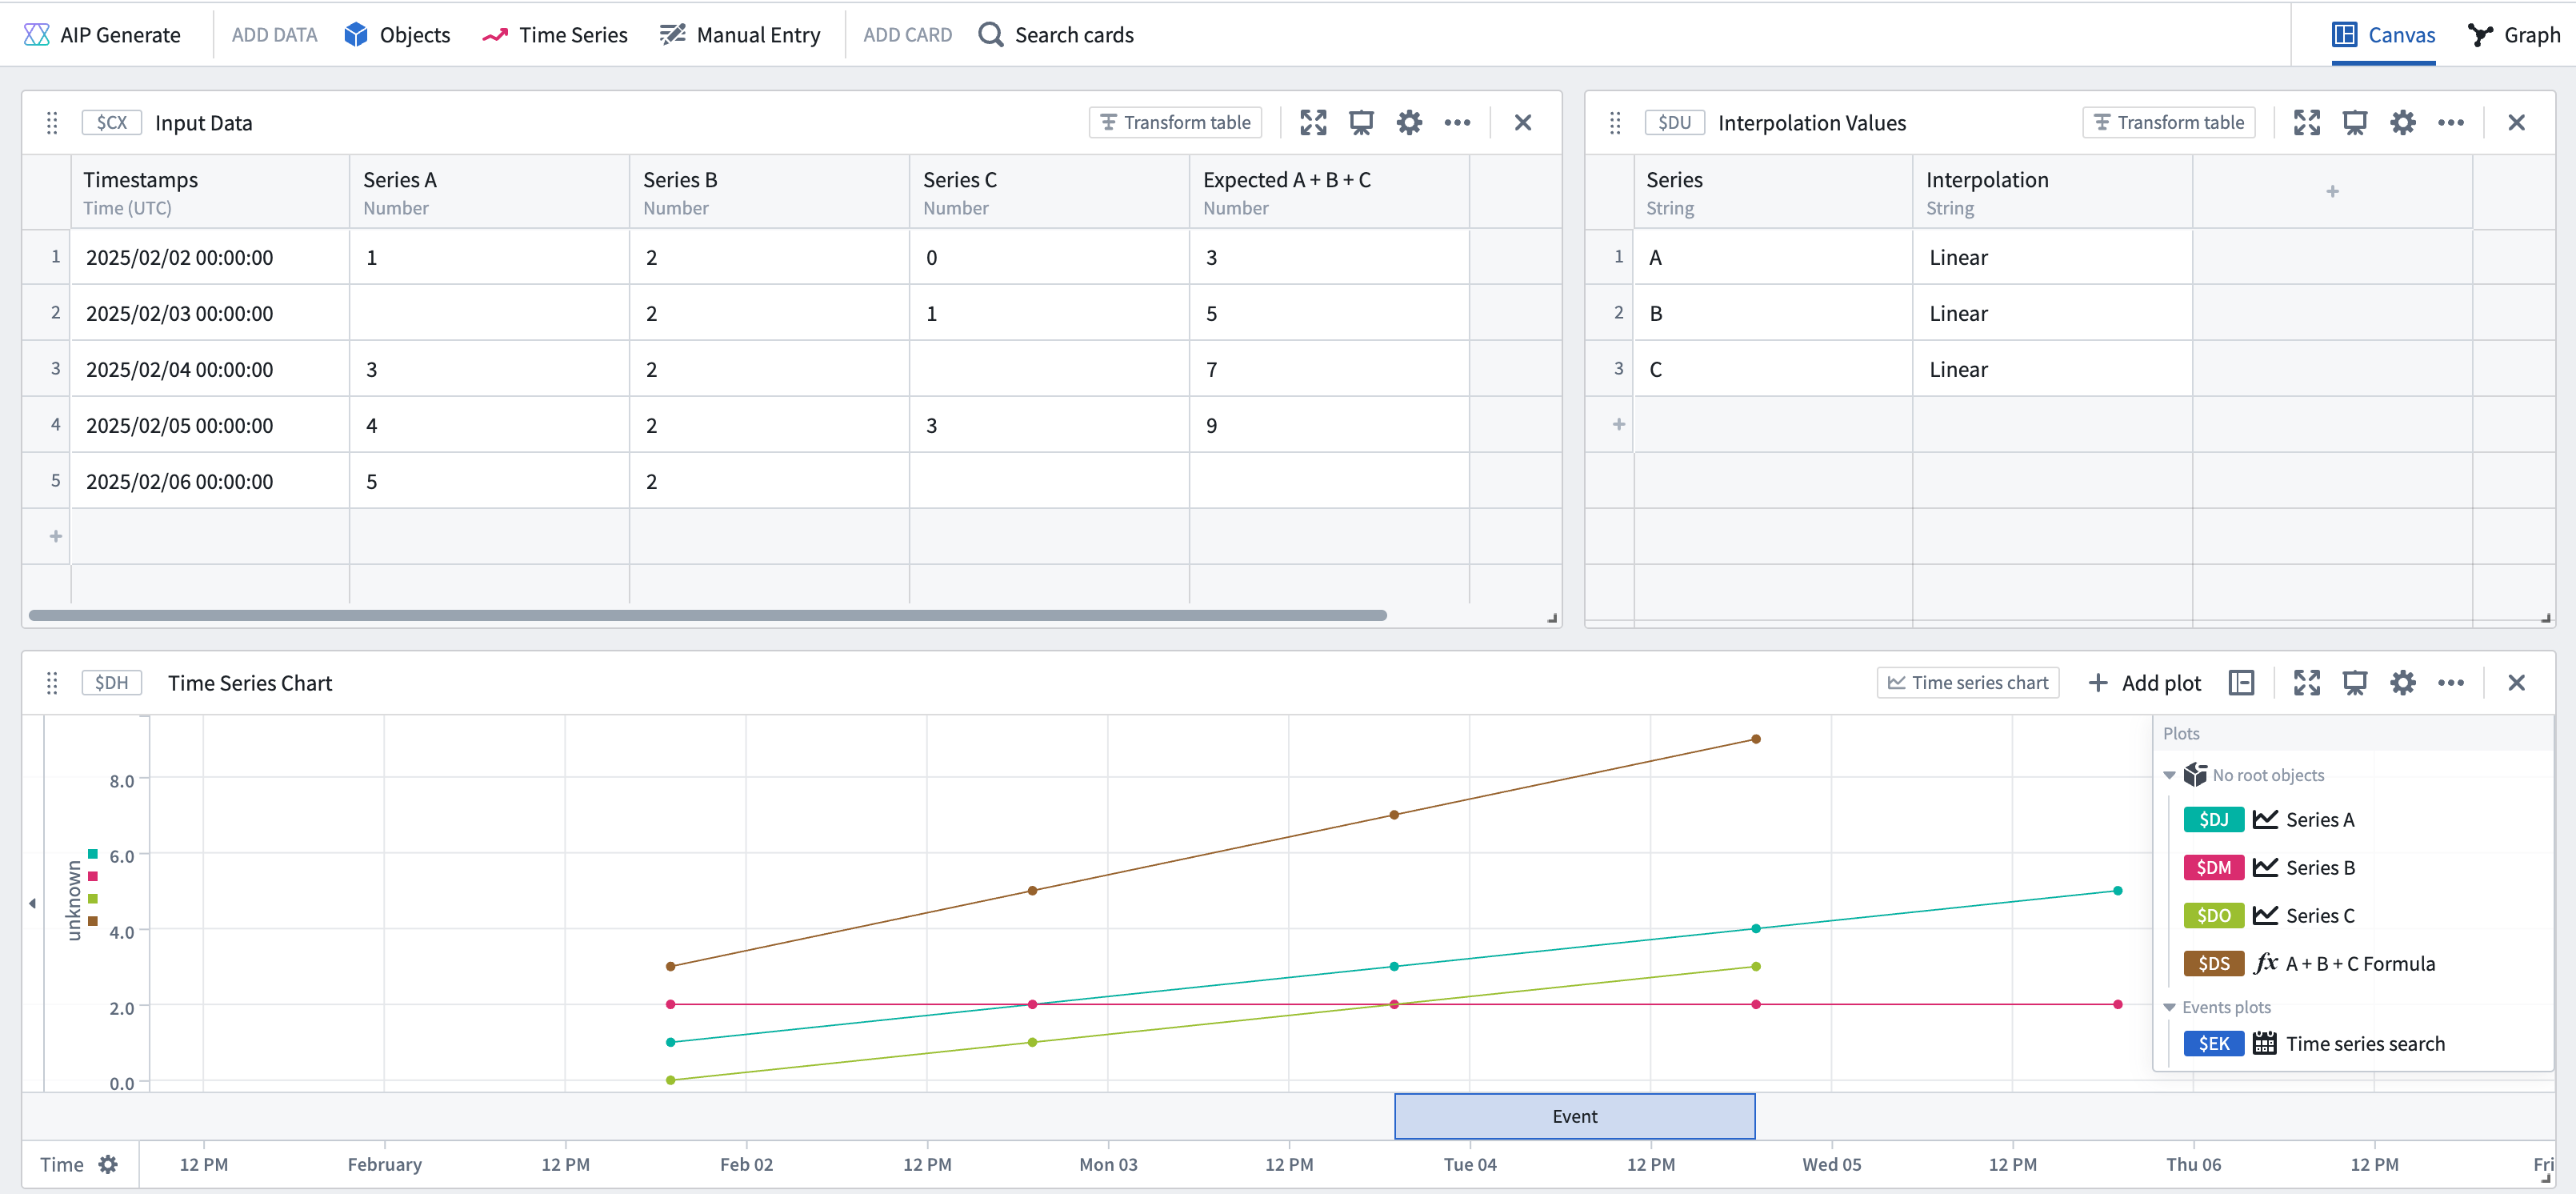
Again, the combined series seems to visually "cross" earlier, but the event actually starts at the first point which matches the condition.
Sample
The Sample card transforms an input series into an output series by resampling it at a specified frequency. To achieve this, the operation uses the interpolation setting of the input series to fill any gaps and maintain the desired frequency.
For example:
| Timestamps | Input Series | Output series using LINEAR interpolation |
Output series using PREVIOUS interpolation |
|---|---|---|---|
| 2025/02/02 00:00:00 | 1 | 1 | 1 |
| 2025/02/02 01:00:00 | 2 | 1 | |
| 2025/02/02 02:00:00 | 3 | 1 | |
| 2025/02/02 03:00:00 | 4 | 4 | 4 |
| 2025/02/02 04:00:00 | 5 | 5 | 5 |
Combine time series
The Combine time series card is the only card which does not use interpolation when joining series together. For each timestamp, the Combine time series card combines the data for any series which actually contain a data point at that timestamp. Additionally, the "inherit from source" interpolation option will apply the interpolation of the first time series in your union to the output of this card.
中文翻译
Quiver 中的插值
本指南介绍 Quiver 中时间序列相关卡片如何使用插值。有关插值及其在时间序列中使用的通用信息,请参阅此概述。
Quiver 卡片中的插值
在 Quiver 中,插值设置可应用于每个时间序列卡片。卡片可以显式定义插值设置,也可以"从源继承",这意味着卡片将从其输入中派生插值设置。对于从 Ontology 加载的时间序列属性,选择"从源继承"的卡片将使用基于格式设置的插值。对于其他数据转换,选择"从源继承"的卡片将使用其输入图中定义的插值。
可用的插值策略包括:
之前: 选择 Quiver 用于插值(推断)序列在第一个数据点之前值的策略。
- 最近(Nearest): 使用最近点的值。此选项生成阶梯线。
- 无(None): 不对该序列进行插值。此选项生成离散点。
内部: 选择 Quiver 用于插值(推断)序列在数据点之间值的策略。
- 线性(Linear): 在两个最近点之间拟合一条直线。此选项生成斜线,适用于数值型时间序列,但不适用于分类/枚举型时间序列。
- 最近(Nearest): 使用最近点的值。此选项生成阶梯线。
- 下一个(Next): 使用下一个点的值。此选项生成阶梯线。
- 上一个(Previous): 使用上一个点的值。此选项生成阶梯线。
- 无(None): 不对该序列进行插值。此选项生成离散点。
之后: 选择 Quiver 用于插值(推断)序列在最后一个数据点之后值的策略。
- 最近(Nearest): 使用最近点的值。此选项生成阶梯线。
- 无(None): 不对该序列进行插值。此选项生成离散点。
插值如何影响数据转换
当组合多个序列时,用于构建输出序列的点取决于输入序列各自的插值。有关如何计算输出序列的更多信息,请参阅插值文档。
插值如何影响数据可视化
Quiver 还将插值用作显示时间序列数据的可视化工具。任意两点之间时间序列线的形状可以通过内部插值设置来更改。此外,如果该序列的外部插值(之前或之后设置)不是 NONE,则可以使用分析设置中的显示插值线设置在第一个点之前或最后一个点之后显示一条线。
:::callout{theme="warning"} 插值的可视化表示可能不代表底层的数据转换。请参阅下面的时间序列搜索部分以获取示例。 :::
使用插值进行数据转换的 Quiver 卡片
以下 Quiver 卡片使用插值来计算卡片的输出:
时刻取值
时刻取值和枚举时刻取值卡片都使用插值来检索序列在指定时间的值。如果序列在查询的时间戳没有数据点,卡片将使用所选插值方法,基于查询时间戳前后最近的数据点生成一个值。您还可以指定特定的插值策略,而不是使用源图的插值。
时间序列公式
时间序列公式卡片仅在将多个序列连接在一起时使用插值。例如,如果您有一个公式如 $E + $F,其中 $E 和 $F 是两个可能不共享所有相同点的时间序列,那么插值设置将决定计算输出序列的点集。如果任何时间序列没有定义插值,输出序列将包含所有没有插值的序列的交集处的所有点。否则,如果所有序列都定义了插值,输出序列将在任何输入序列中存在的任何点处都有值。
过滤时间序列
过滤时间序列卡片仅在将多个序列连接在一起时使用插值(类似于时间序列公式卡片)。如果您有一个条件如 $E + $F > 100,过滤时间序列卡片将首先使用插值组合两个序列,然后将 > 100 条件应用于组合后的序列。
如果您有一个条件如 $E > 10 && $F > 100,过滤时间序列卡片将使用每个序列的插值来确定评估条件的时间戳。例如,如果 E 没有设置插值,但 F 有定义的插值,那么卡片将仅在 E 包含值的时间戳评估条件 $E > 10 && $F > 100,并相应地显示输出。
总而言之,输出序列取决于输入序列的插值设置。
线性聚合
线性聚合卡片在连接多个序列以执行指定聚合时使用插值。如果一个或多个序列没有定义插值,则线性聚合可能会创建部分聚合。部分聚合是指由于缺少重叠点且未定义插值,某些序列在某个时间戳不包含值。
您可以使用卡片编辑器中的包含部分聚合选项来配置是否要在输出序列中保留这些部分聚合。
例如,假设您有三个时间序列 A、B 和 C,其中 B 和 C 没有插值,而序列 A 使用线性插值。
| 时间戳 | 序列 A | 序列 B | 序列 C | 预期 A + B + C |
|---|---|---|---|---|
| 2025/02/02 00:00:00 | 1 | 2 | 0 | 3 |
| 2025/02/03 00:00:00 | 2 | 1 | 5 | |
| 2025/02/04 00:00:00 | 3 | 2 | ||
| 2025/02/05 00:00:00 | 4 | 2 | 3 | 9 |
| 2025/02/06 00:00:00 | 5 | 2 |
如果您在包含部分聚合关闭的情况下对这三个序列执行线性聚合求和,您将看到以下结果:
上图中生成的序列等同于时间序列公式 A + B + C,其中点仅存在于两个没有定义插值的序列(B 和 C)的交集处。如果您在"包含部分聚合"开启的情况下对这三个序列执行线性聚合求和,您将看到以下结果:
具体来说,上图显示生成的序列在任何输入序列中存在的每个时间戳都有点。每个时间戳的值是使用该点处每个序列中的值(如果存在)或该时间戳处的插值(如果为该序列设置了插值)计算得出的。
时间序列搜索
时间序列搜索卡片使用插值将多个序列组合在一起。例如,如果您的搜索公式包含 $E > 50 && $F > 50,那么时间序列搜索卡片将使用插值来计算哪些事件满足组合条件。这与时间序列公式和时间序列过滤卡片的行为类似。
尽管组合序列的可视化可能表明条件在更早的时间戳已满足,但搜索识别出的事件的开始和结束仅由组合序列中存在的时间戳决定。
例如,假设您有三个时间序列 A、B 和 C,其中序列 A 和 B 使用线性插值,而序列 C 没有插值。
| 时间戳 | 序列 A | 序列 B | 序列 C | 预期 A + B + C |
|---|---|---|---|---|
| 2025/02/02 00:00:00 | 1 | 2 | 0 | 3 |
| 2025/02/03 00:00:00 | 2 | 1 | 5 | |
| 2025/02/04 00:00:00 | 3 | 2 | ||
| 2025/02/05 00:00:00 | 4 | 2 | 3 | 9 |
| 2025/02/06 00:00:00 | 5 | 2 |
如果您想搜索三个序列之和 >= 6 的点,您的搜索将如下所示:
尽管从视觉上看,组合序列"越过"6 的阈值的时间远早于结果事件的开始时间,但事件是从组合序列中满足条件的第一个实际点开始的。该点恰好也是事件的结束点,因为组合序列中之后没有更多点了。相比之下,如果您也为序列 C 设置了插值,您将得到以下结果:
同样,组合序列似乎在视觉上更早"越过",但事件实际上是从第一个匹配条件的点开始的。
采样
采样卡片通过以指定的频率对输入序列进行重采样,将其转换为输出序列。为了实现这一点,该操作使用输入序列的插值设置来填充任何间隙并保持所需的频率。
例如:
| 时间戳 | 输入序列 | 使用 LINEAR 插值的输出序列 |
使用 PREVIOUS 插值的输出序列 |
|---|---|---|---|
| 2025/02/02 00:00:00 | 1 | 1 | 1 |
| 2025/02/02 01:00:00 | 2 | 1 | |
| 2025/02/02 02:00:00 | 3 | 1 | |
| 2025/02/02 03:00:00 | 4 | 4 | 4 |
| 2025/02/02 04:00:00 | 5 | 5 | 5 |
组合时间序列
组合时间序列卡片是唯一在连接序列时不使用插值的卡片。对于每个时间戳,组合时间序列卡片会组合在该时间戳实际包含数据点的任何序列的数据。此外,"从源继承"插值选项会将联合中第一个时间序列的插值应用于此卡片的输出。