Use a dashboard within an analysis(在分析中使用仪表板)
In some cases, it can be useful to add a dashboard as a card inside your Quiver analysis. For example, consider a visualization that you repeatedly use with the same configuration but different input values. To save time, you can create a dashboard with only this chart and define its inputs. Note that a dashboard needs to be published before you can add it to an analysis. There are two ways to add a published dashboard to your analysis:
- From the dashboard side panel, use the + button next to the dashboard to add it to the analysis.

- From the analysis mode, select Display in the top menu and then Import published Quiver dashboard.

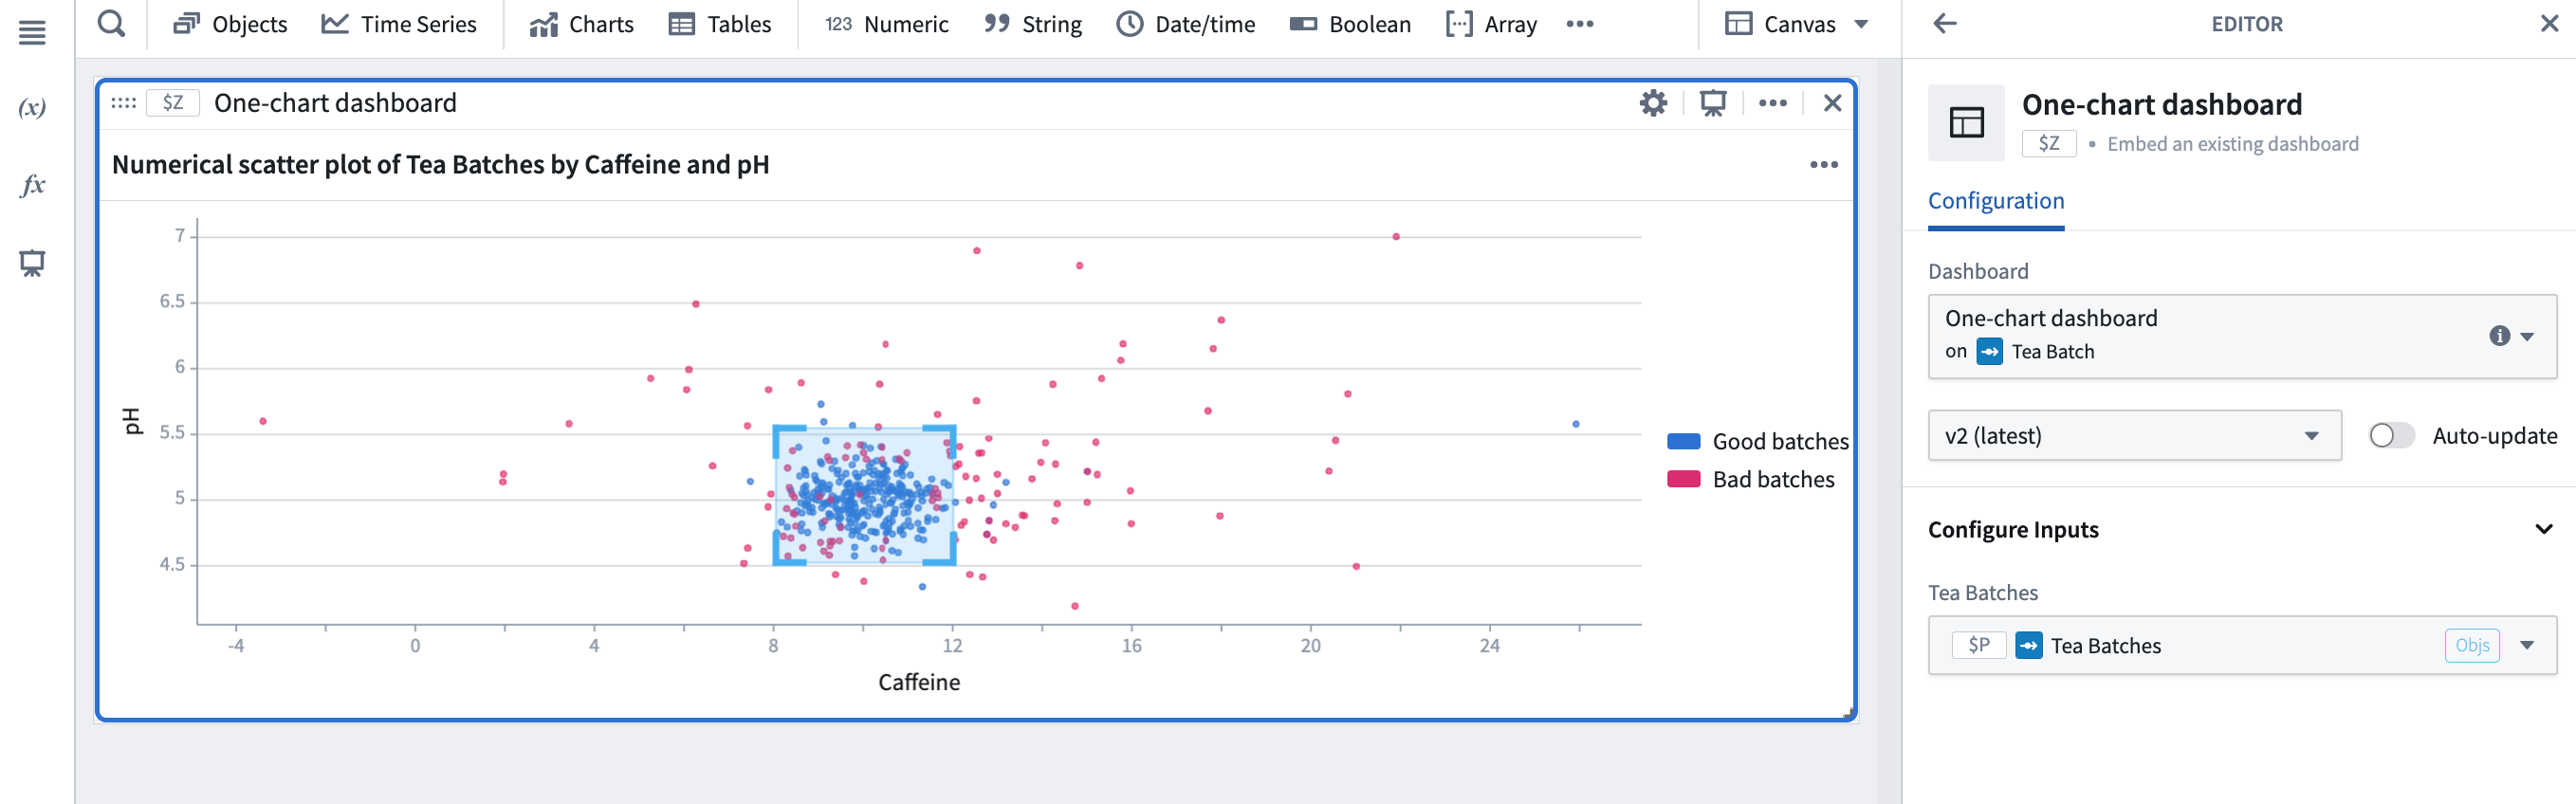
When imported into the analysis, the dashboard will be displayed in a card. In the card editor, you can choose which dashboard to display, select the dashboard version (if Auto-update is enabled, the editor will always show the latest version), and configure any dashboard inputs.
中文翻译
在分析中使用仪表板
在某些情况下,将仪表板(dashboard)作为卡片添加到您的 Quiver 分析中会非常有用。例如,考虑一个您反复使用的可视化图表,其配置相同但输入值不同。为了节省时间,您可以创建一个仅包含此图表的仪表板,并定义其输入。请注意,仪表板需要先发布(published),然后才能将其添加到分析中。有两种方法可以将已发布的仪表板添加到您的分析中:
- 在仪表板侧面板中,使用仪表板旁边的 + 按钮将其添加到分析中。
- 在分析模式下,选择顶部菜单中的 显示(Display),然后选择 导入已发布的 Quiver 仪表板(Import published Quiver dashboard)。
导入到分析后,仪表板将显示在一个卡片中。在卡片编辑器中,您可以选择要显示的仪表板、选择仪表板版本(如果启用了 自动更新(Auto-update),编辑器将始终显示最新版本),并配置任何仪表板输入。