Analyze events data(分析事件数据)
Quiver provides robust tools for visualizing and analyzing events data, enabling targeted investigation into periods of interest within time series data. In the simplest case, an event is defined by a start and end timestamp, but events can also be enriched with additional properties to support deeper analysis. This flexible structure can represent a wide range of occurrences, such as equipment downtime, maintenance windows, production batches, and more.
Quiver supports the following features:
- Construction of event sets from a variety of data sources.
- Customization of each event's color, tooltip, and visibility using column variables.
- Modification and enrichment of event sets with transform table operations.
- Comparison of time series behavior across multiple events.
- Calculation of event-based metrics and statistics.
- Advanced workflows for anomaly detection and reference profile construction.
Add events data
To begin event analysis in Quiver, first construct an event set with the desired data. Review the options below for Ontology-based event sets and event sets created using other methods.
Ontology-based event sets
Object set to event set: The event set from tabular data card converts an object set to an event set after the object set has been added to the analysis. Select which object properties to use for the start and end of the events. Object types with the event capability automatically have start and end properties selected.
Linked objects to event set: Starting from a single object, perform one or multiple search-arounds and use the set of linked objects as events. Optionally, filter the results and select properties for the start and end of the events. See the linked event set details page to learn more.
Other methods for creating event sets
Manual ranges: The event set from ranges card takes inputs to individually define each event in the event set. An event can be defined using a single range card or by two timestamps representing the start and end of the event. The timestamp inputs can be cards, allowing the values to dynamically update, or static values that are chosen manually.
Time series search: The time series search card creates event sets by defining and evaluating conditions against time series data. Events are created when the condition is met, such as when a threshold is exceeded, bounds are crossed, or a formula is satisfied. This approach is especially useful for detecting and analyzing anomalies in time series data.
Other tabular data: Transform tables and materializations are also accepted as input to the event set from tabular data card. Instead of selecting object properties for the start and end dates, select the appropriate columns.
Display options
Events data is primarily visualized through events plots, which offer flexible display options. Most options can be configured on a per-event basis, enabling detailed information about each event to be displayed. Configure the colors, tooltips, and more in the Display tab of any events plot. Below is a summary of the options available. Learn more.
- Time series chart visibility: Quickly toggle the event set to be visible on compatible time series charts.
- Colors: Select a color for each event using a static value, a string event column representing hexadecimal color values, or auto-cycle by event column value.
- Render in chart: Show events as chart highlights and adjust the highlight opacity.
- Render on X axis: Show an events axis and customize tooltips.
- Object view: Show prominent object properties and title.
- Custom: Choose which event columns to use as the tooltip content, title, and description.
Transform events data
Several cards are available to transform event sets:
Time shift: Modify an existing event set by shifting the start and end timestamps forwards or backwards by a duration. This is helpful for adding an offset to either side of the events. Both the value and duration of the offset can be controlled by variables, allowing event-level customization if the information is present in the object set, transform table, or transform table backing the event set. Learn more about time shift event sets.
Deduplicate: Deduplicate all overlapping events in an event set. This is useful as a pre-processing step to reduce computation time or normalize events data. Learn more about deduplication.
Further customization can be achieved by converting the events plot to a transform table.
To perform the conversion, follow these steps:
- Access the next actions menu of the event set by selecting the time series chart where the event set is displayed.
- Select the Continue analysis from menu and then select the desired event set.
- Select Convert > New transform table.
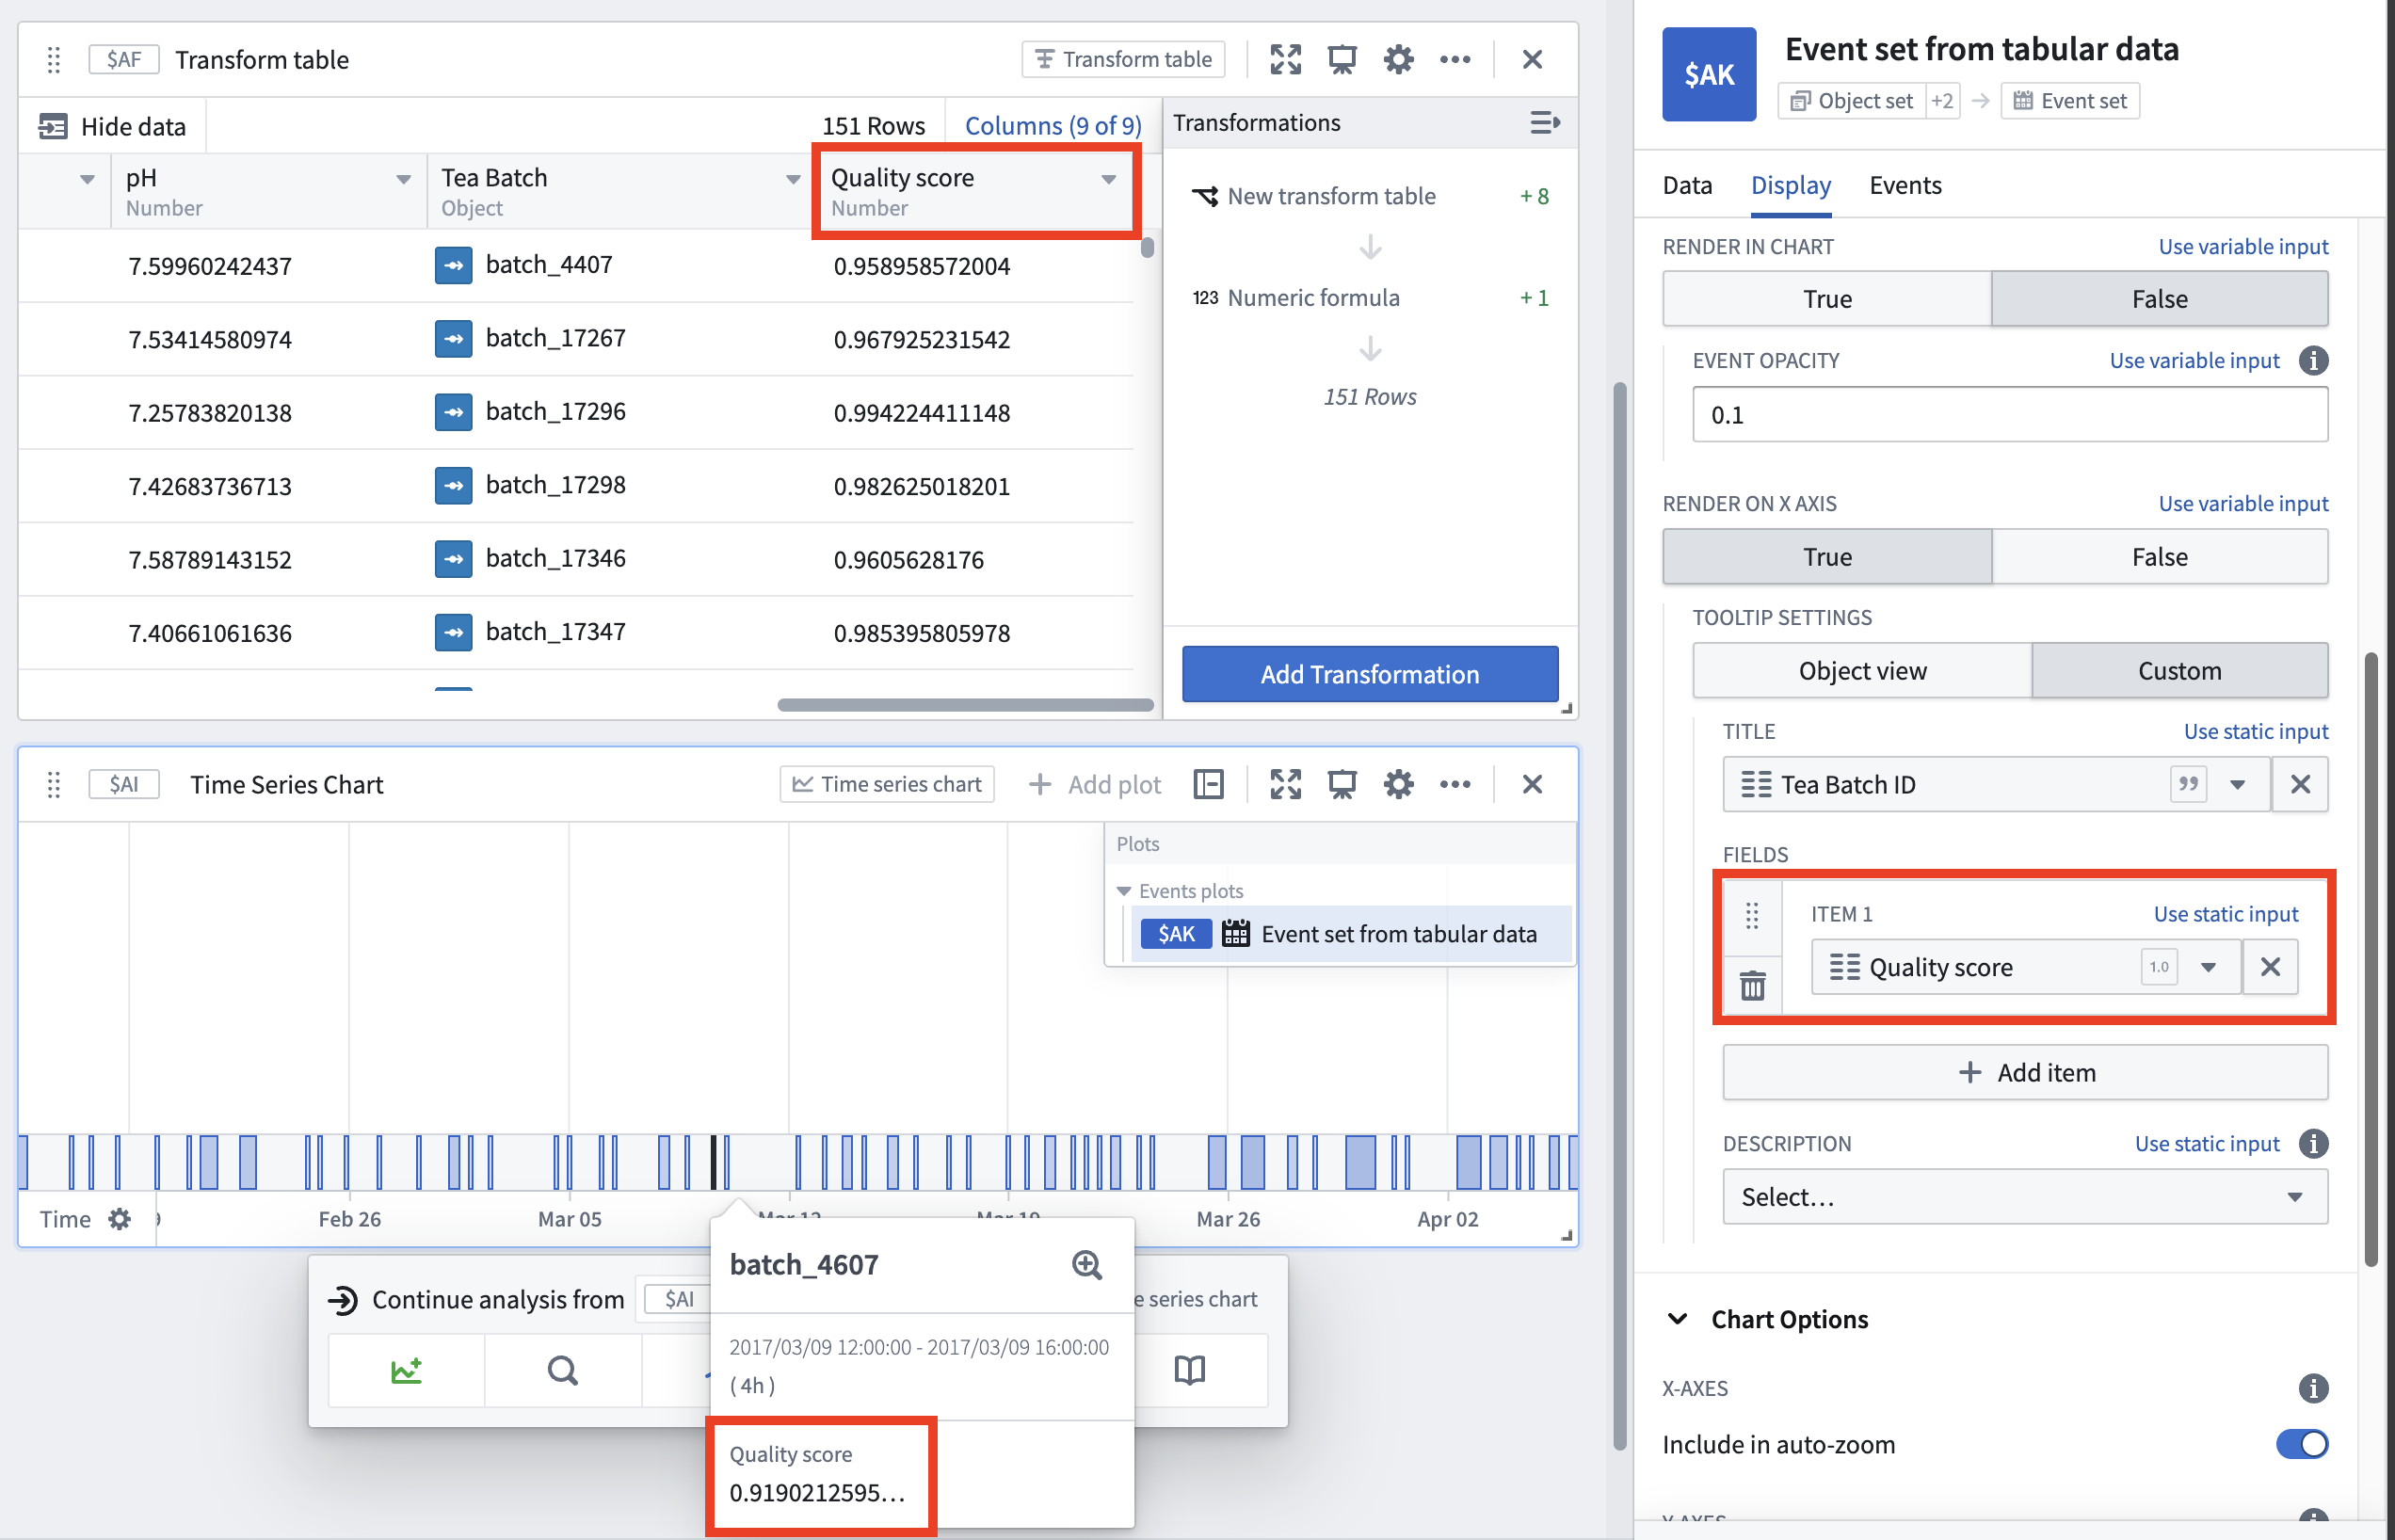
A wide variety of transforms are available to modify or enrich the underlying events data. For example, computing a quality score value for each event and displaying it the event tooltip. After transforming the data, use the event set from tabular data card to convert the data back to an events plot and use it in subsequent time series operations.
Use event sets for time series analysis
Event sets serve as effective tools for investigating periods of interest in time series data. Quiver provides capabilities to summarize, compare, and filter time series data based on the context provided by events, making it easier to extract actionable information.
- Event statistics: Aggregate a time series plot over intervals where an event occurs. This card returns a new time series with one point per event, enabling summary statistics or comparisons across events. Learn more.
- Event indicator: Create a time series out of an event set that indicates the number of events occurring at a given time. This is useful for visualizing event frequency or overlap. Learn more.
- Filtering: Filter time series data to only include periods occurring during an event in the event set. This is useful for focusing analysis on relevant intervals within time series data, which is often large and complex. Learn more.
- Event comparison plot: Compare the behavior of a time series across multiple events by overlaying time series segments from each event. This makes it easy to spot patterns, trends, or outliers that occur across the event set, relative to the start or end of each event. Learn more.
Related topics
中文翻译
分析事件数据
Quiver 提供了强大的工具来可视化和分析事件数据,支持对时间序列数据中的关注时段进行定向调查。在最简单的情况下,一个事件(event)由开始和结束时间戳定义,但事件也可以通过附加属性进行丰富,以支持更深入的分析。这种灵活的结构可以表示多种事件,例如设备停机、维护窗口、生产批次等。
Quiver 支持以下功能:
- 从多种数据源构建事件集(event set)。
- 使用列变量自定义每个事件的颜色、工具提示(tooltip)和可见性。
- 通过转换表(transform table)操作修改和丰富事件集。
- 比较多个事件间的时间序列行为。
- 计算基于事件的指标和统计量。
- 用于异常检测和参考配置文件构建的高级工作流。
添加事件数据
要在 Quiver 中开始事件分析,首先使用所需数据构建一个事件集。请查看以下基于 Ontology 的事件集以及使用其他方法创建的事件集的选项。
基于 Ontology 的事件集
对象集到事件集: 来自表格数据的事件集卡片在将对象集(object set)添加到分析后,将其转换为事件集。选择要用于事件开始和结束的对象属性。具有事件能力的对象类型会自动选择开始和结束属性。
链接对象到事件集: 从一个单一对象开始,执行一次或多次搜索周边,并将链接对象集用作事件。可以选择过滤结果,并为事件的开始和结束选择属性。请参阅链接事件集详情页面了解更多信息。
创建事件集的其他方法
手动范围: 来自范围的事件集卡片接受输入,以单独定义事件集中的每个事件。可以使用单个范围卡片或代表事件开始和结束的两个时间戳来定义事件。时间戳输入可以是卡片(允许值动态更新),也可以是手动选择的静态值。
时间序列搜索: 时间序列搜索卡片通过定义和评估时间序列数据的条件来创建事件集。当条件满足时(例如超过阈值、越界或满足公式),就会创建事件。这种方法对于检测和分析时间序列数据中的异常特别有用。
其他表格数据: 转换表和物化视图也可以作为来自表格数据的事件集卡片的输入。此时不是选择对象属性作为开始和结束日期,而是选择相应的列。
显示选项
事件数据主要通过事件图进行可视化,它提供了灵活的显示选项。大多数选项可以按事件进行配置,从而显示每个事件的详细信息。在任何事件图的显示(Display)选项卡中配置颜色、工具提示等。以下是可用选项的摘要。了解更多。
- 时间序列图表可见性: 快速切换事件集在兼容的时间序列图表上的可见性。
- 颜色: 使用静态值、代表十六进制颜色值的字符串事件列,或按事件列值自动循环,为每个事件选择颜色。
- 在图表中渲染: 将事件显示为图表高亮,并调整高亮不透明度。
- 在 X 轴上渲染: 显示事件轴并自定义工具提示。
- 对象视图: 显示突出的对象属性和标题。
- 自定义: 选择哪些事件列用作工具提示内容、标题和描述。
转换事件数据
有多个卡片可用于转换事件集:
时间偏移: 通过将开始和结束时间戳向前或向后移动一段时间来修改现有事件集。这有助于在事件两侧添加偏移量。偏移量的值和持续时间都可以由变量控制,如果对象集、转换表或支持事件集的转换表中存在相关信息,则可以实现事件级别的自定义。了解更多关于时间偏移事件集的信息。
去重: 对事件集中所有重叠的事件进行去重。这作为预处理步骤很有用,可以减少计算时间或规范化事件数据。了解更多关于去重的信息。
通过将事件图转换为转换表,可以实现进一步的自定义。
要执行转换,请遵循以下步骤:
- 通过选择显示事件集的时间序列图表,访问事件集的下一步操作菜单。
- 选择从...继续分析(Continue analysis from)菜单,然后选择所需的事件集。
- 选择转换 > 新建转换表(Convert > New transform table)。
可以使用多种转换来修改或丰富底层事件数据。例如,为每个事件计算一个质量评分值,并将其显示在事件工具提示中。转换数据后,使用来自表格数据的事件集卡片将数据转换回事件图,并在后续的时间序列操作中使用。
使用事件集进行时间序列分析
事件集是调查时间序列数据中关注时段的有效工具。Quiver 提供了基于事件提供的上下文来汇总、比较和过滤时间序列数据的功能,从而更容易提取可操作的信息。
- 事件统计: 在事件发生的区间内聚合时间序列图。此卡片返回一个新的时间序列,每个事件对应一个数据点,从而支持汇总统计或跨事件比较。了解更多。
- 事件指示器: 从事件集创建一个时间序列,指示在给定时间发生的事件数量。这对于可视化事件频率或重叠很有用。了解更多。
- 过滤: 过滤时间序列数据,仅包含事件集中事件发生的时间段。这对于将分析重点放在通常庞大且复杂的时间序列数据中的相关区间上非常有用。了解更多。
- 事件比较图: 通过叠加每个事件的时间序列片段,比较一个时间序列在多个事件中的行为。这使得相对于每个事件的开始或结束,可以轻松发现事件集中出现的模式、趋势或异常值。了解更多。