Create and use visual functions(创建和使用可视化函数)
A visual function consists of one or more Quiver cards that load, combine, and transform data. Visual functions in Quiver do not impact the underlying data in Foundry or make any ontology change; rather, visual functions automatically apply a set of logical steps to data inputs within a Quiver analysis.
Create a function
Add cards to your analysis to create the logical path of your function, including the inputs and output you would like to have in the function. Note that visualization and table cards cannot be part of a function.
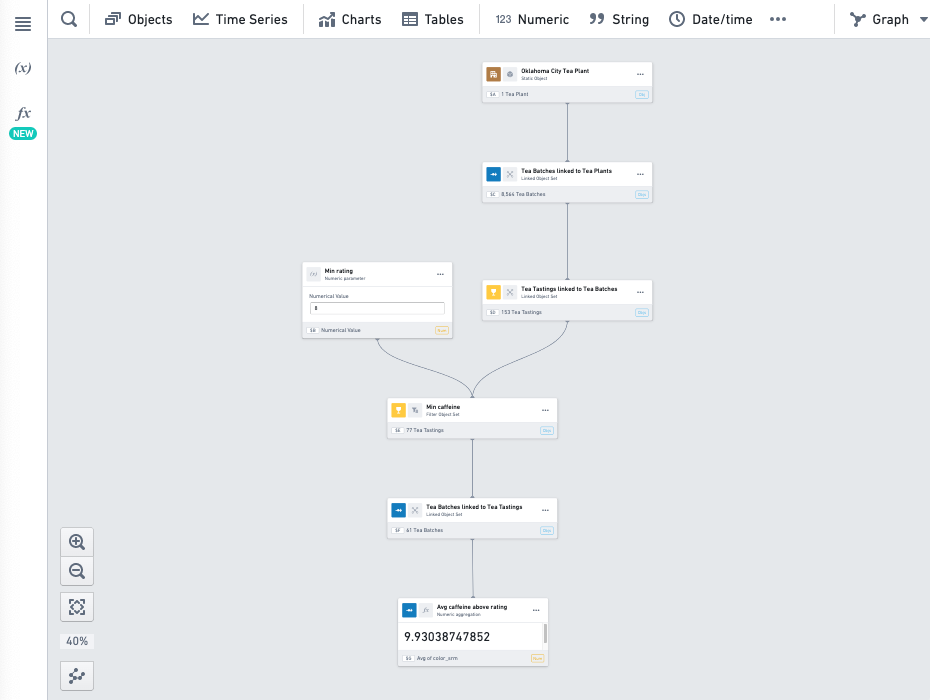
In this example, we have created a KPI that returns the average caffeine of high quality batches in a tea plant. In the analysis this is computed for a specific plant object, and using a numeric parameter (to filter on high quality batches).
The logical steps include importing linked objects, filtering and aggregating, but the logic can be arbitrarily complex.
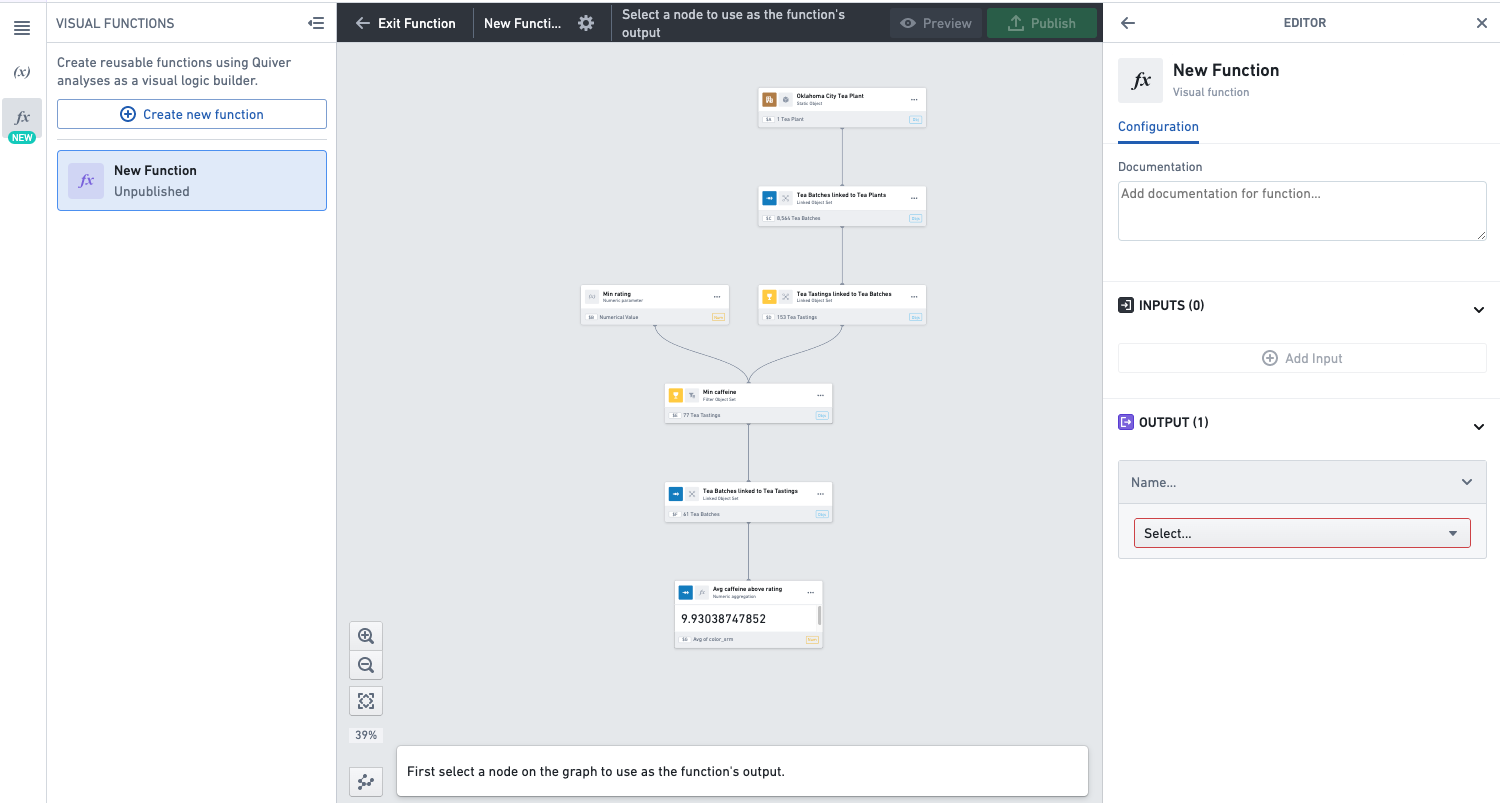
Open the functions panel by selecting the fx icon on the upper-left side of the screen and then select Create new function.
![]()
This will open the function editing mode and create a new unpublished function in the functions panel. The panel on the right-hand side is the function editor.
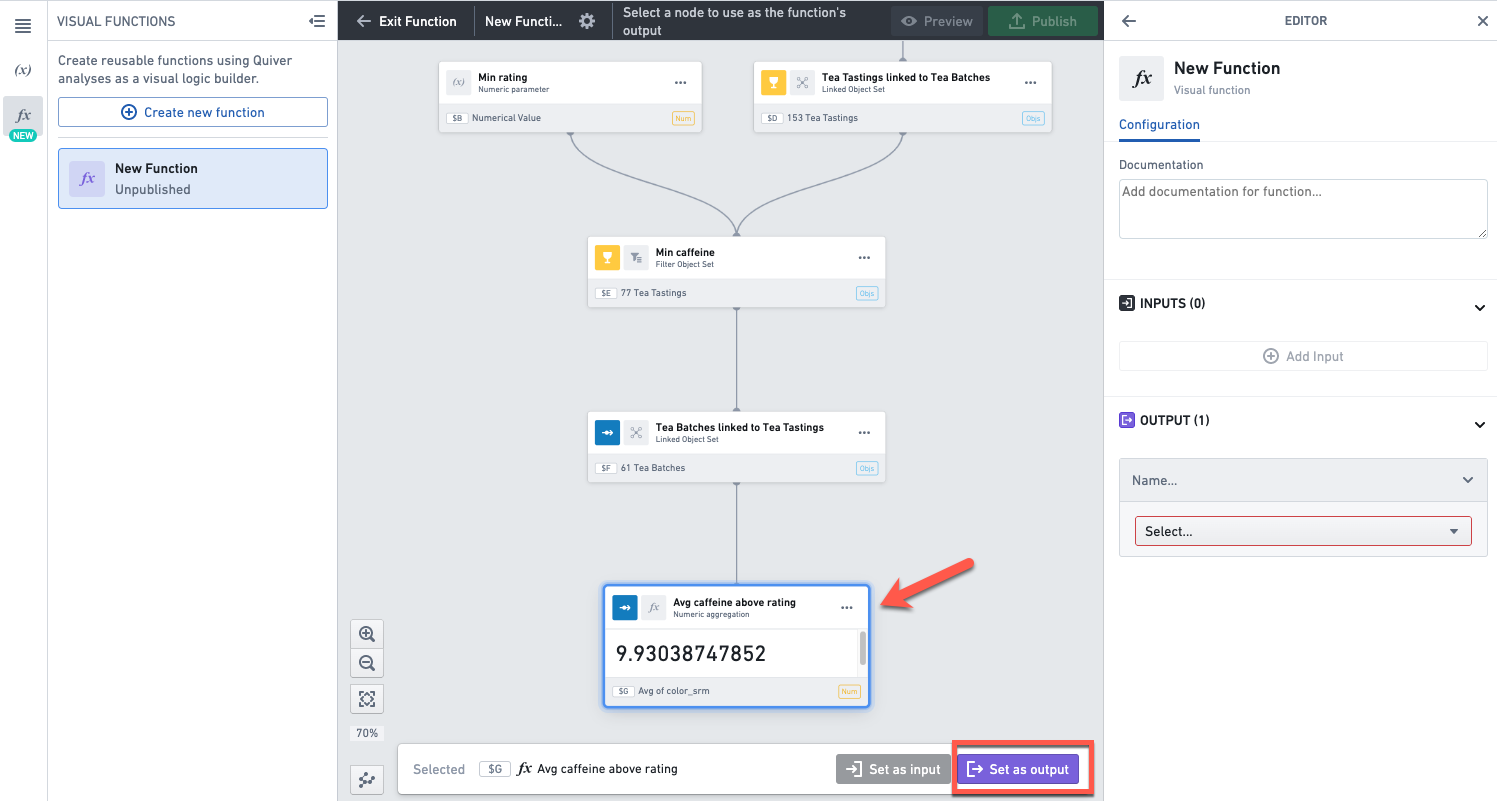
Select the card on the graph which contains the output of your function. In our example, this is the numeric metric card which contains our KPI.
Click Set as output at the bottom of the screen.
Alternatively, you can select the output by using the dropdown in the output section in the function editor on the right.
Once you’ve set the output, eligible inputs in the analysis graph will be highlighted in purple. This means you can select any of the highlighted cards as input to the function.
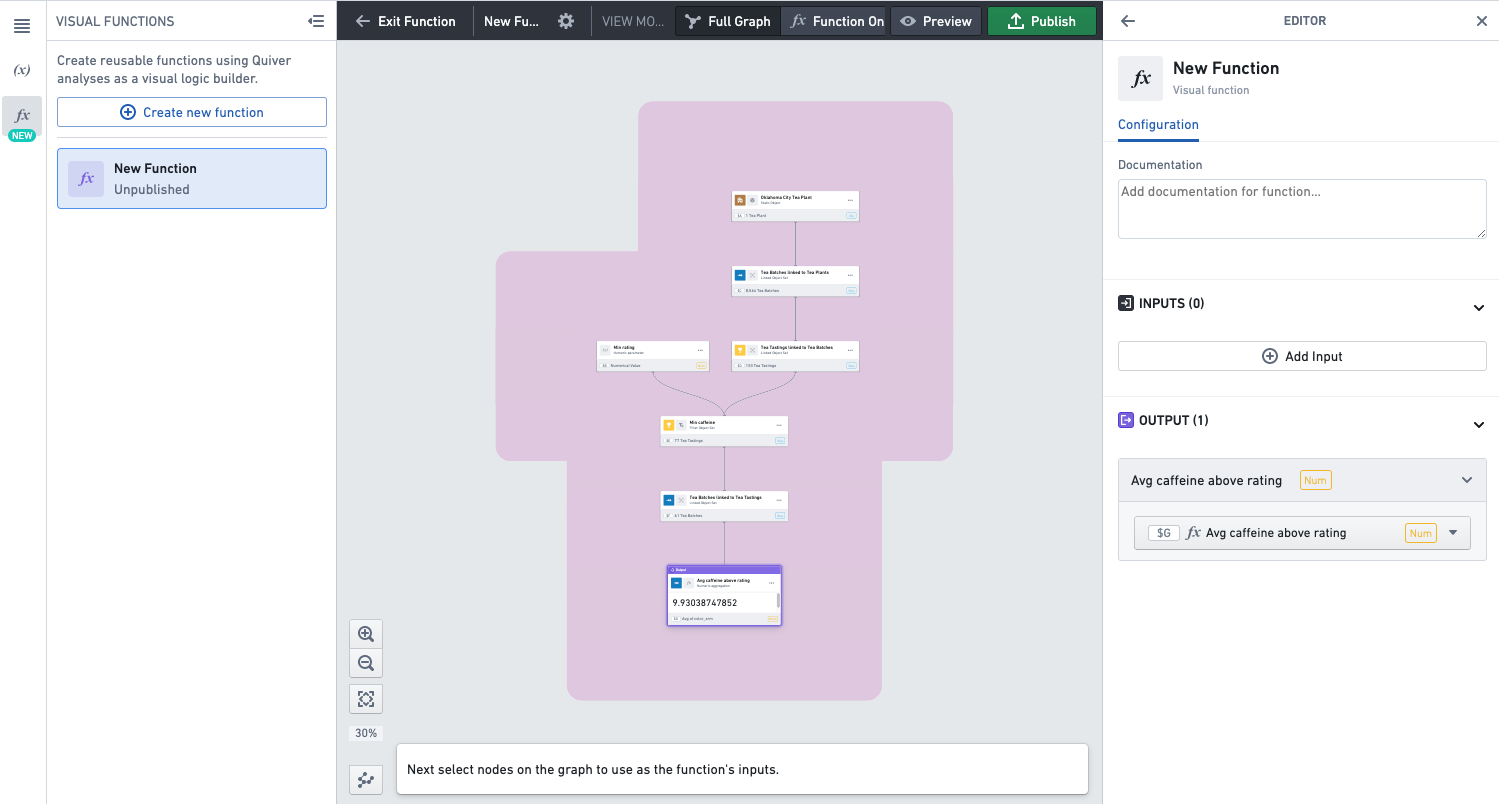
Select the cards you want to set as inputs, and for each click Set as input. Those are objects or metrics that you want to allow users of the function to configure.
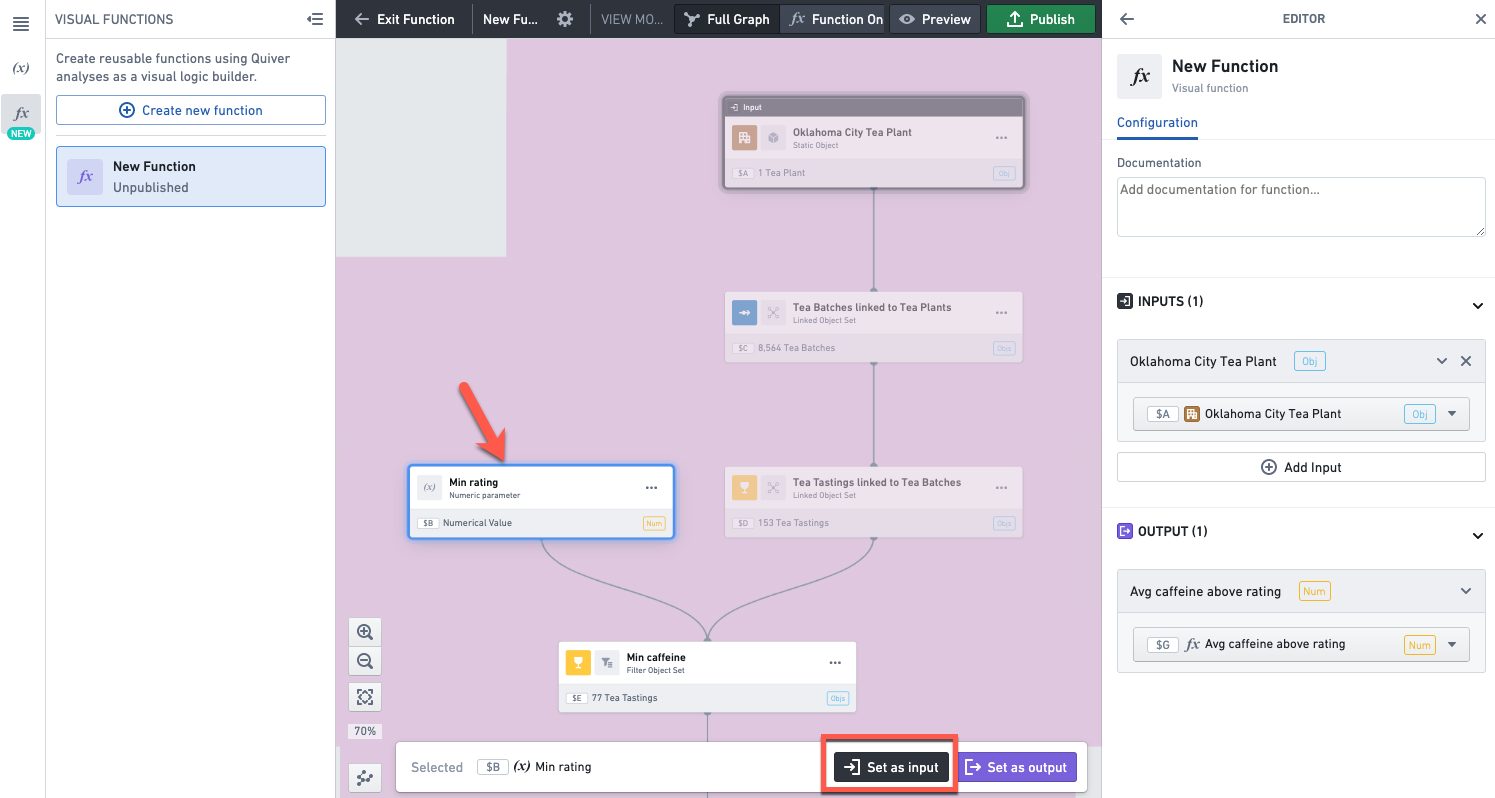
Alternatively, you can select the inputs by clicking Add input in the function editor on the right.
Give a name and description to the function.

Preview a function
To open the preview mode, click on the Preview button in the top header.
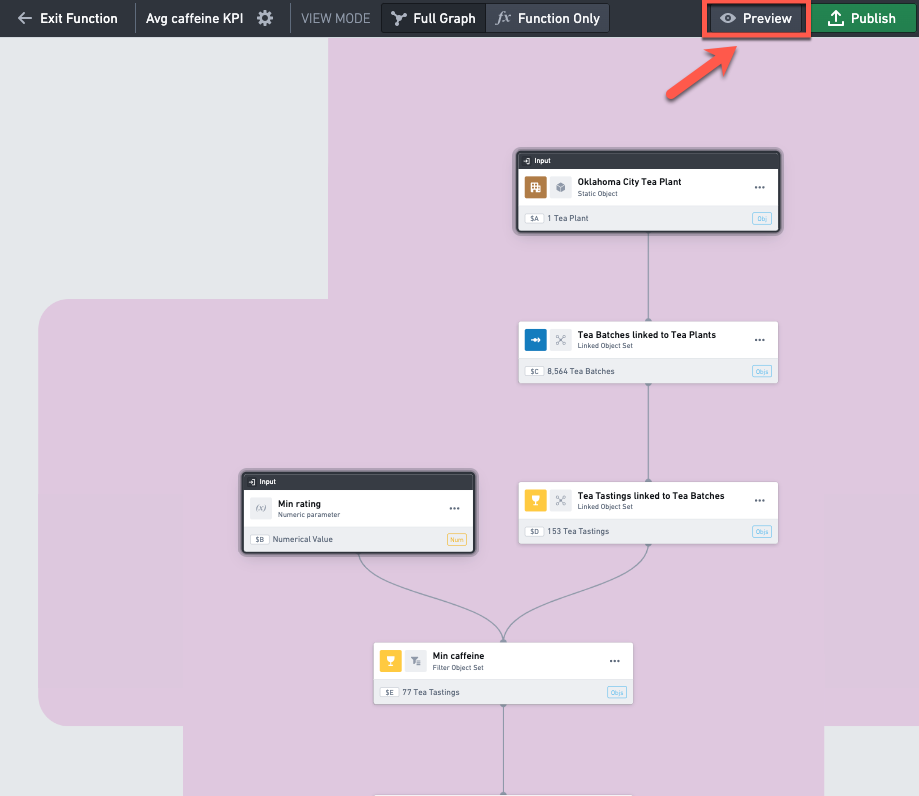
In preview mode, you can change the input values on the left side bar, and see how it impacts the output value of the function at the bottom left.
Publish a function
Publish the function by clicking Publish in the top right corner. Make sure to publish in a folder that has the appropriate permissions so that other users can see and use the function.
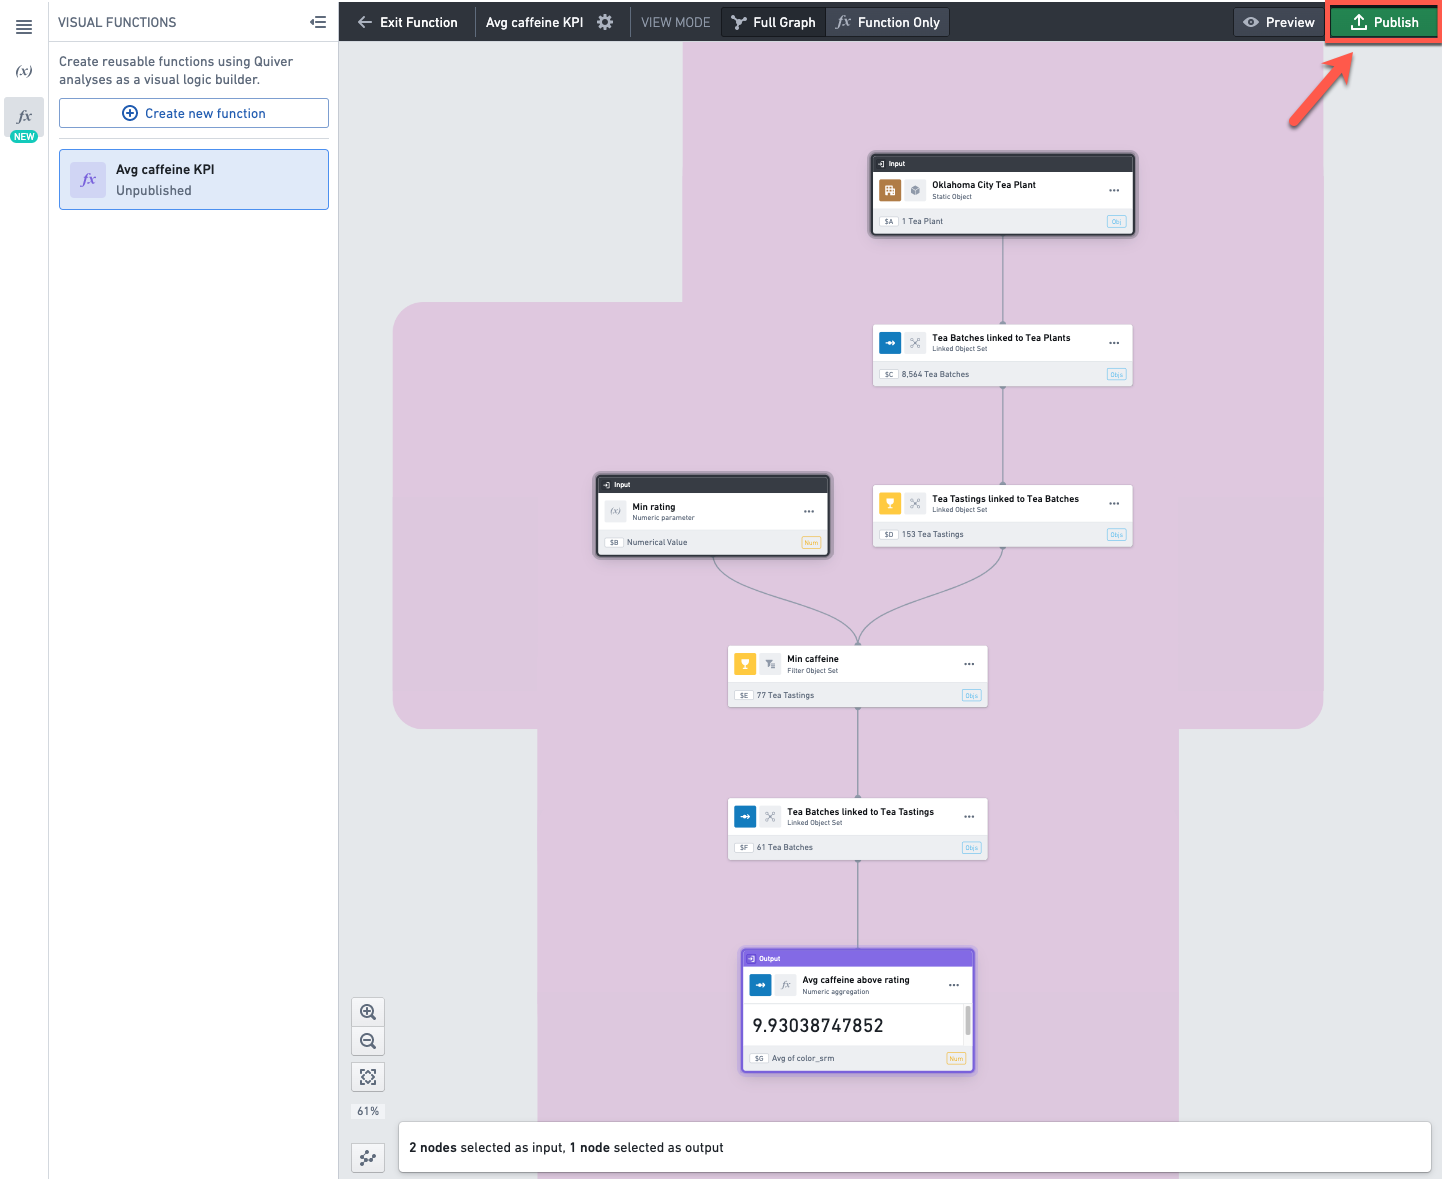
The function is now ready to be used.
Use a function
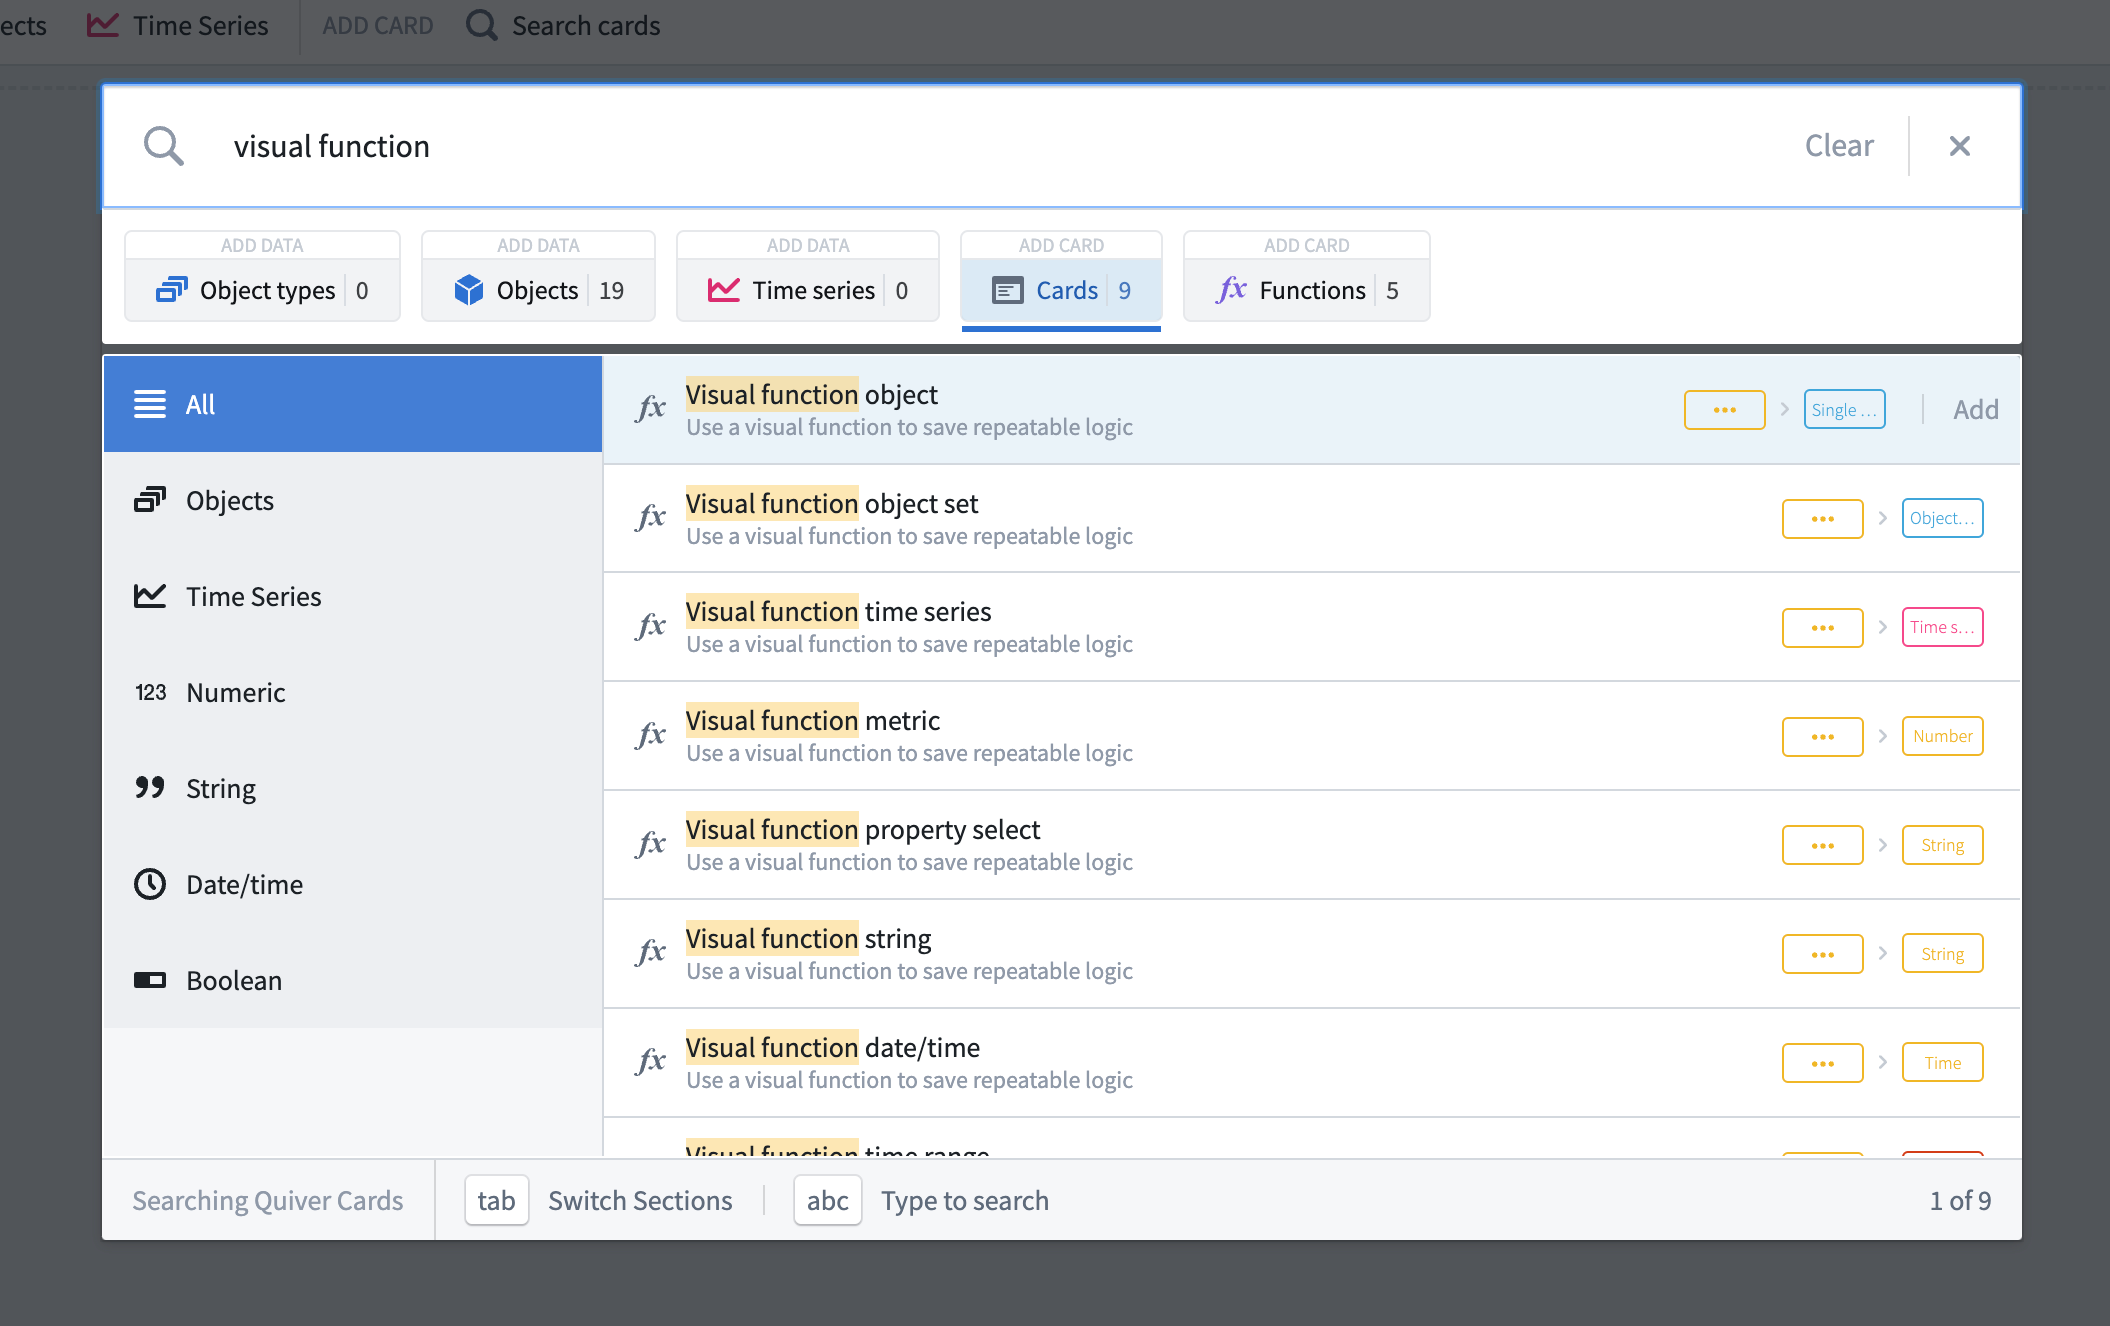
From the top menu or using the search bar, select the Cards tab and search for cards that start with "visual function" and select one with the desired output type (For example, Num for a number).
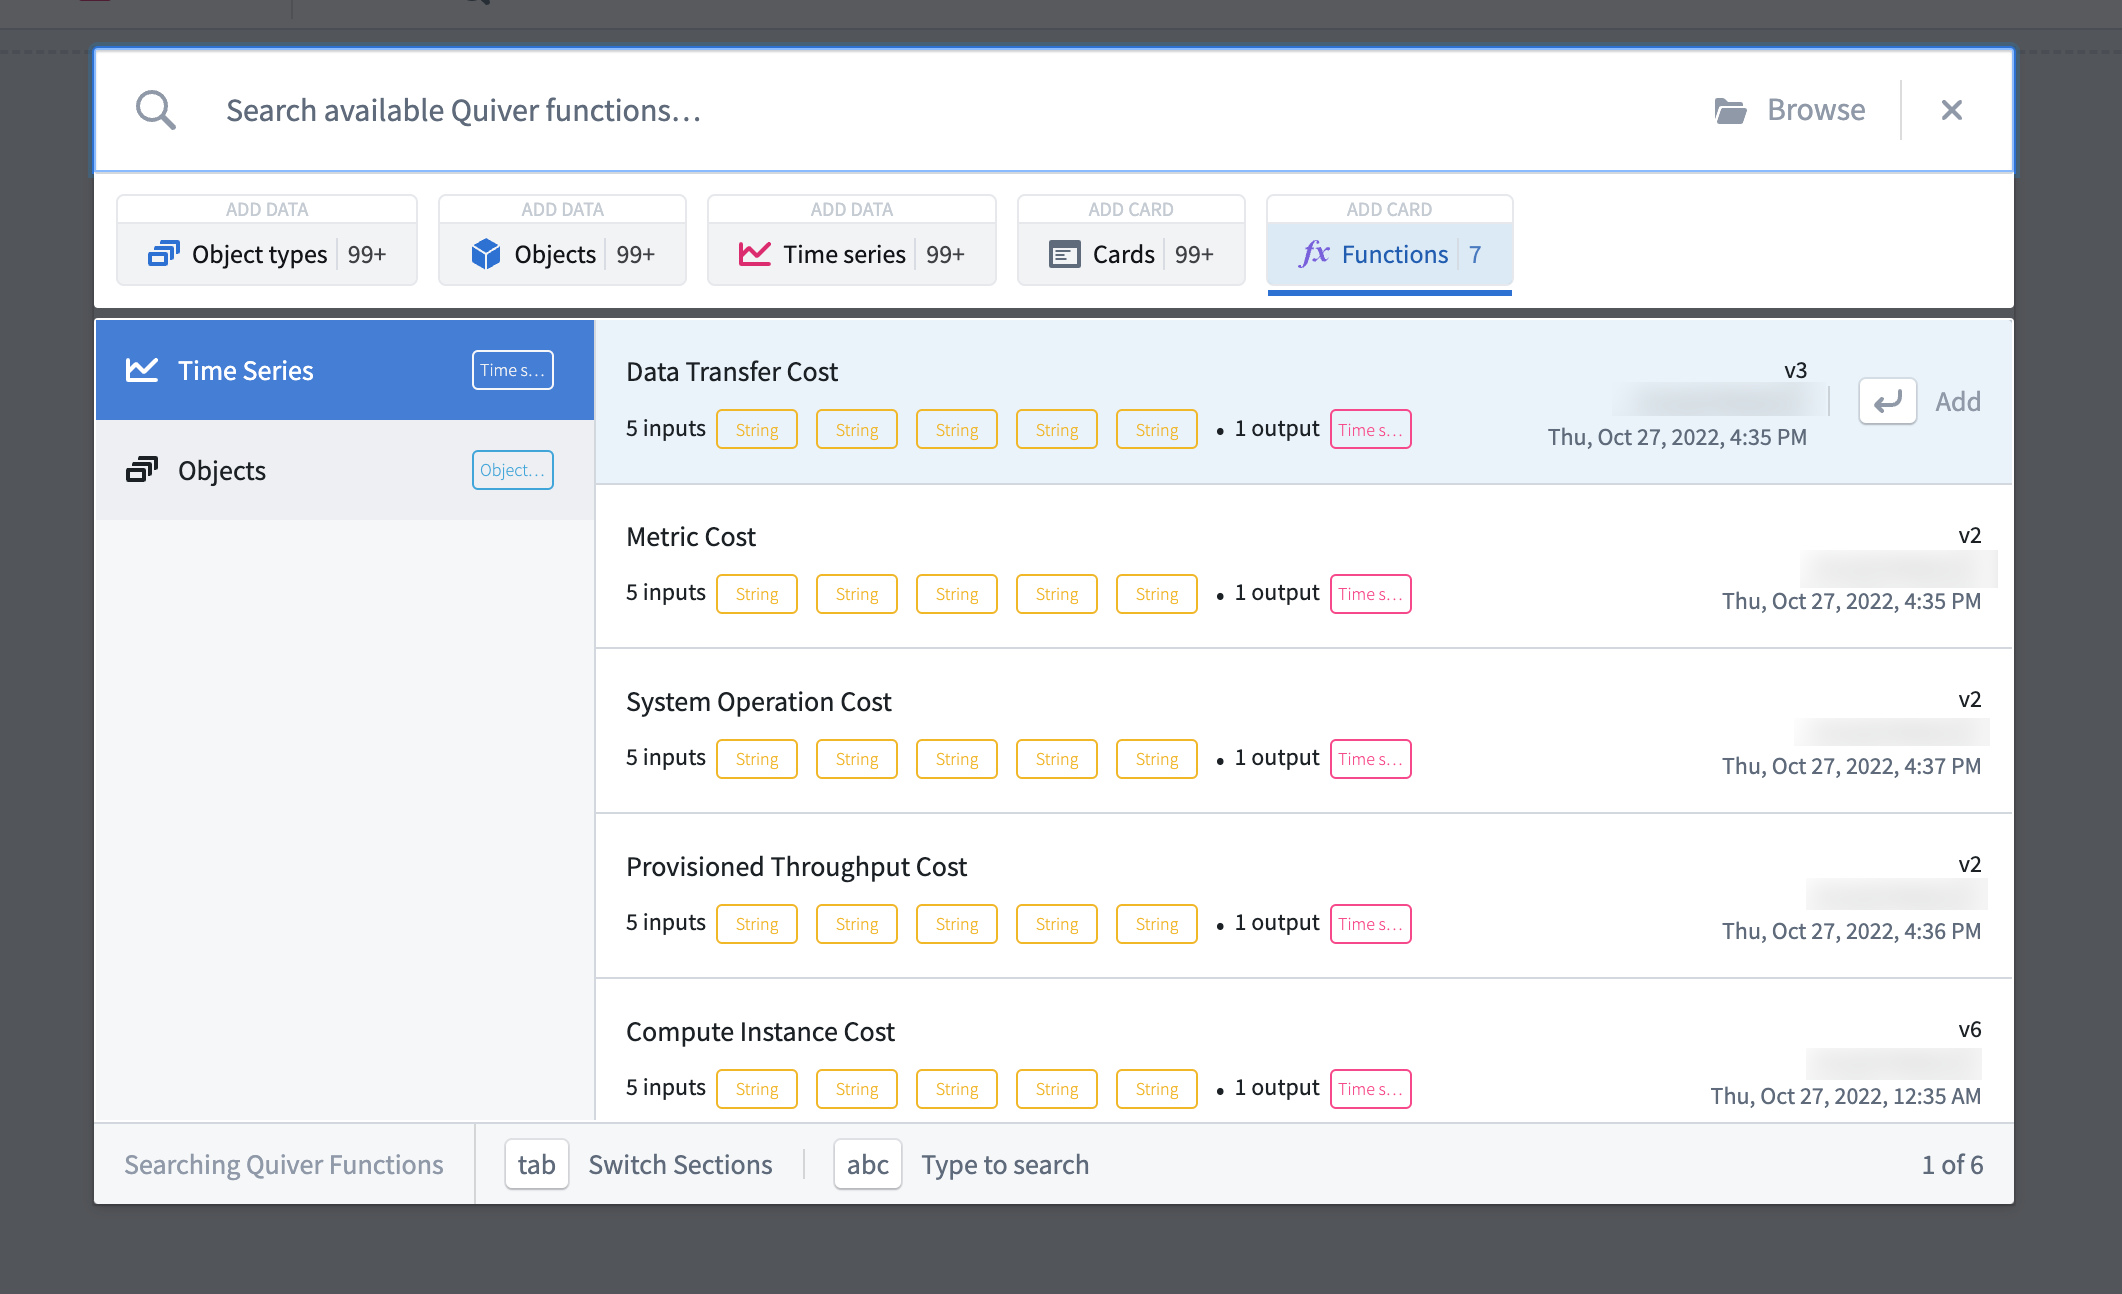
In the search bar, select the Functions tab to see all the functions you have access to, regardless of where the functions were created. Select the one you want to use.
If the function was created in this analysis, you can also use the + button on the function in the functions panel.

Once selected, a card will be added to your analysis. You can configure the function’s inputs in the editor panel. Once the inputs are configured, the card will return the result of the function.

You can also use the editor panel to change the function’s version. If you want to make sure the card always returns the results from the latest version of the function, make sure to enable the auto-update toggle.

Update a function
Once you have published a function, it is possible for users who have owner or editor access on the function to edit it. First, you need to open the function's editor panel.
If you are in the analysis where the function was created, open the functions panel and click on the function you want to edit.
If not, you can open the function directly by clicking on the function's file in Foundry. Then click the Edit button at the top.

This will open the function in the analysis in which it was created.
Finally, click on the Settings icon (![]() ) next to the function's name in the top header, to open the function editor panel.
) next to the function's name in the top header, to open the function editor panel.
![]()
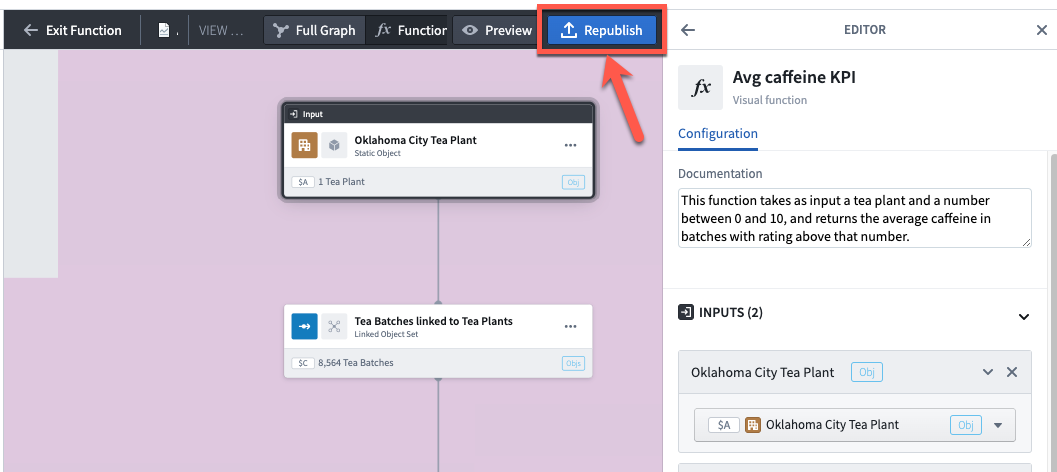
In the editor panel on the right-hand side, make the desired changes to the title, description, inputs and outputs. When ready click the Republish button.
This will save a new version of the function. When using a function in an analysis, you can choose which version to apply. You can inspect the logic of previous versions by opening the function in a separate tab (clicking on the function's name in the top header  ), and changing the version using the dropdown menu at the top right of the screen.

Share a function
When you publish a function, the function will inherit the users permissions on the folder it’s been saved in, meaning that users who have access to this folder will be able to use this function in their analysis.
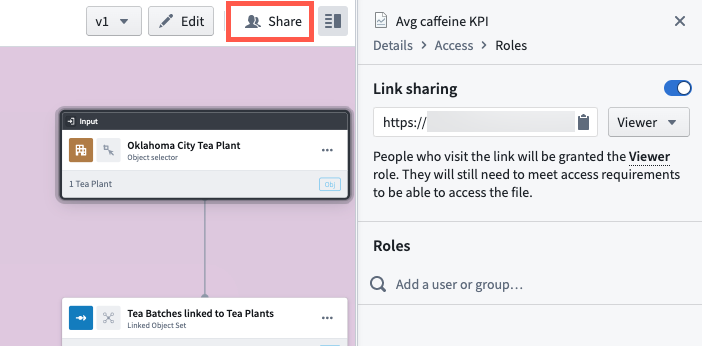
Additionally, you can further share the function with users or groups of users by using the Share panel. To do so, open the function in a separate tab (clicking on the function's name in the top header ) and click on Share in the top right corner.
FAQ
How many outputs can a function have?
A function can have only one output.
How many inputs can a function have?
A function can have as many inputs as desired.
What output types are supported?
A function can return a single object, an object set, a time series or any type of metric.
Tables and visualizations (categorical or not) are not supported as outputs in functions.
What is the difference between a visual function and a code function?
Code functions are written in code (TypeScript) outside of Quiver, in a code repository. They can be used in Quiver analyses and in other applications such as Workshop.
Visual functions are built within Quiver without the need to write a line of code. They can be used in Quiver analyses by any user who has access to the function. For now, they cannot be used outside of Quiver.
中文翻译
创建和使用可视化函数
可视化函数(Visual function)由一个或多个Quiver卡片组成,用于加载、组合和转换数据。Quiver中的可视化函数不会影响Foundry中的底层数据,也不会对本体论(Ontology)做出任何更改;相反,可视化函数会自动将一系列逻辑步骤应用于Quiver分析中的输入数据。
创建函数
在分析中添加卡片以创建函数的逻辑路径,包括您希望在函数中使用的输入和输出。请注意,可视化卡片和表格卡片不能作为函数的一部分。
在本示例中,我们创建了一个关键绩效指标(KPI),用于返回茶叶工厂中高质量批次的平均咖啡因含量。在分析中,该指标针对特定工厂对象进行计算,并使用数值参数(用于筛选高质量批次)。
逻辑步骤包括导入关联对象、筛选和聚合,但逻辑可以任意复杂。
通过选择屏幕左上角的 fx 图标打开函数面板,然后选择 创建新函数(Create new function)。
![]()
这将打开函数编辑模式,并在函数面板中创建一个新的未发布函数。右侧面板为函数编辑器。
在图表中选择包含函数输出的卡片。在我们的示例中,这是包含KPI的数值指标卡片。
点击屏幕底部的 设置为输出(Set as output)。
或者,您也可以使用右侧函数编辑器中输出部分的下拉菜单来选择输出。
设置输出后,分析图中符合条件的输入将高亮显示为紫色。这意味着您可以选择任何高亮显示的卡片作为函数的输入。
选择您要设置为输入的卡片,然后为每张卡片点击 设置为输入(Set as input)。这些是您希望允许函数用户配置的对象或指标。
或者,您也可以点击右侧函数编辑器中的 添加输入(Add input) 来选择输入。
为函数指定名称和描述。
预览函数
要打开预览模式,请点击顶部标题栏中的 预览(Preview) 按钮。
在预览模式下,您可以更改左侧边栏中的输入值,并查看其对左下角函数输出值的影响。
发布函数
点击右上角的 发布(Publish) 来发布函数。请确保发布到具有适当权限的文件夹中,以便其他用户能够查看和使用该函数。
函数现已准备就绪,可供使用。
使用函数
从顶部菜单或使用搜索栏(Search bar),选择 卡片(Cards) 选项卡,搜索以"visual function"开头的卡片,然后选择具有所需输出类型的卡片(例如,数字类型选择 Num)。
在搜索栏(Search bar)中,选择 函数(Functions) 选项卡,查看您有权访问的所有函数,无论这些函数创建于何处。选择您要使用的函数。
如果该函数是在当前分析中创建的,您也可以使用函数面板中该函数旁边的 + 按钮。
选择后,一张卡片将添加到您的分析中。您可以在编辑器面板中配置函数的输入。配置完成后,卡片将返回函数的结果。
您还可以使用编辑器面板更改函数的版本。如果您希望卡片始终返回函数最新版本的结果,请确保启用自动更新开关。
更新函数
函数发布后,拥有函数所有者或编辑者权限的用户可以对其进行编辑。首先,您需要打开函数的编辑器面板。
如果您在创建函数的分析中,请打开函数面板并点击要编辑的函数。
如果不是,您可以直接点击Foundry中的函数文件来打开函数。然后点击顶部的 编辑(Edit) 按钮。
这将在创建该函数的分析中打开该函数。
最后,点击顶部标题栏中函数名称旁边的设置图标(![]() ),以打开函数编辑器面板。
),以打开函数编辑器面板。
![]()
在右侧的编辑器面板中,对标题、描述、输入和输出进行所需更改。准备就绪后,点击 重新发布(Republish) 按钮。
这将保存函数的新版本。在分析中使用函数时,您可以选择要应用的版本。您可以通过在新标签页中打开函数(点击顶部标题栏中的函数名称 ),并使用屏幕右上角的下拉菜单更改版本来检查先前版本的逻辑。
共享函数
发布函数时,该函数将继承保存文件夹的用户权限,这意味着有权访问该文件夹的用户可以在其分析中使用此函数。
此外,您还可以使用共享面板进一步与用户或用户组共享该函数。为此,请在新标签页中打开函数(点击顶部标题栏中的函数名称 ),然后点击右上角的 共享(Share)。
常见问题解答
一个函数可以有多少个输出?
一个函数只能有一个输出。
一个函数可以有多少个输入?
一个函数可以有任意数量的输入。
支持哪些输出类型?
函数可以返回单个对象、对象集、时间序列或任何类型的指标。
表格和可视化(无论是否为分类形式)不支持作为函数的输出。
可视化函数和代码函数有什么区别?
代码函数(Code functions)是在Quiver之外,使用代码(TypeScript)在代码仓库中编写的。它们可以在Quiver分析以及其他应用程序(如Workshop)中使用。
可视化函数是在Quiver内部构建的,无需编写任何代码。任何有权访问该函数的用户都可以在Quiver分析中使用它们。目前,它们不能在Quiver之外使用。