Add content from other Foundry applications(从其他 Foundry 应用添加内容)
Add boards from Contour
If you want to present the results of a single Contour analysis, consider using Contour Dashboard Mode to create an interactive dashboard. Learn more about Contour Dashboard mode.
Both editors and viewers of an analysis can add a board to a report.
To add a Contour board to a report:
-
Open your Contour analysis.
-
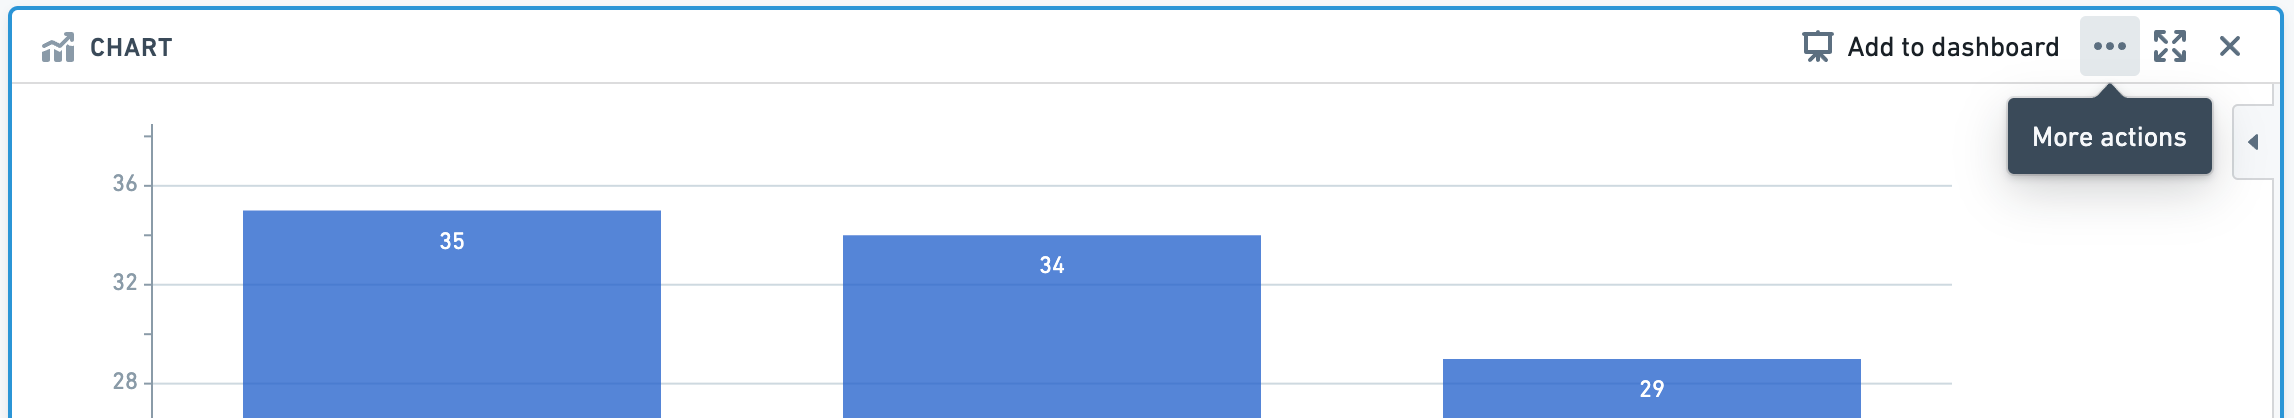
Scroll to the appropriate board, then click the More actions button in the board header (
...).
-
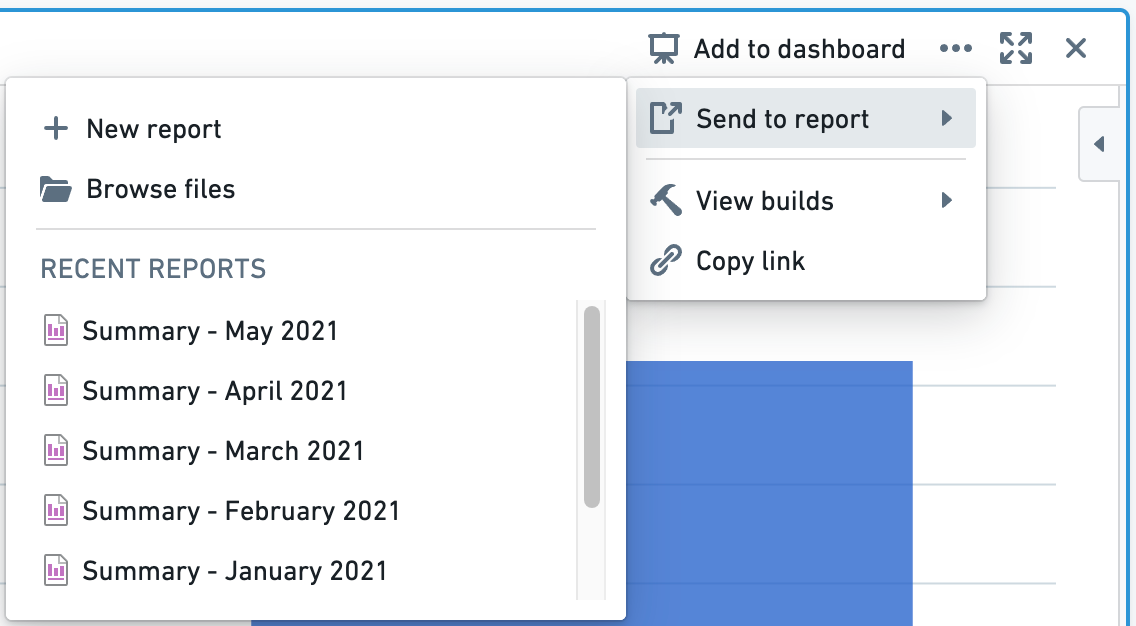
Click Send to report, then select a report from the menu:
-
Select a recent report from the Recent reports section, or
- Click New report to create a new report, or
- Click Browse files to select a report from elsewhere in Foundry.
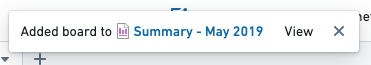
You should see a confirmation toast when the board has been successfully added to the report that you selected.
Add boards from Code Workbook
Reports are a great place to consolidate content from disparate workflows into one place.
:::callout{theme="neutral"} To view and interact with Code Workbook visualizations in Reports, we recommend granting users Edit permissions on the underlying Code Workbook. Users with View permissions will only be able to see combinations of input data and parameters that have previously been computed by users with Edit permissions. :::
To add a board from Code Workbook to a report:
-
Open your Code Workbook.
-
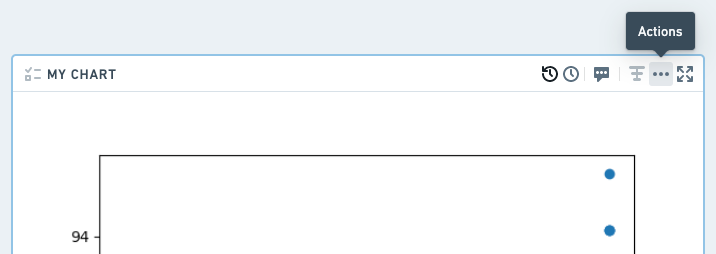
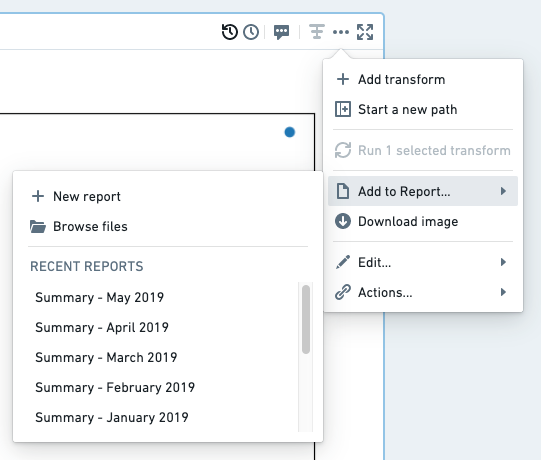
Find the appropriate board, then right-click in the board header, or click the Actions button (
···).
-
Click Add to Report, then select a report from the menu:
-
Select a recent report from the Recent reports section, or
- Click New report to create a new report, or
- Click Browse files to select a report from elsewhere in Foundry.
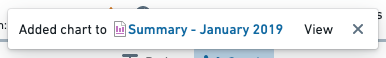
You should see a confirmation toast when the board has been successfully added to the report that you selected.
Add views from Object Explorer
Reports are a great place to consolidate content from disparate workflows into one place.
Object Explorer offers several types of views that can each be added to a report:
- Object - a full view of a particular object
- Section - a section within an object view
- List - a tabular list of several object
Add an object view to a report
To add an object view from Object Explorer to a report:
-
Open an object view in Object Explorer.
-
Click Actions in the top right of the page.
-
Click Add to Report.
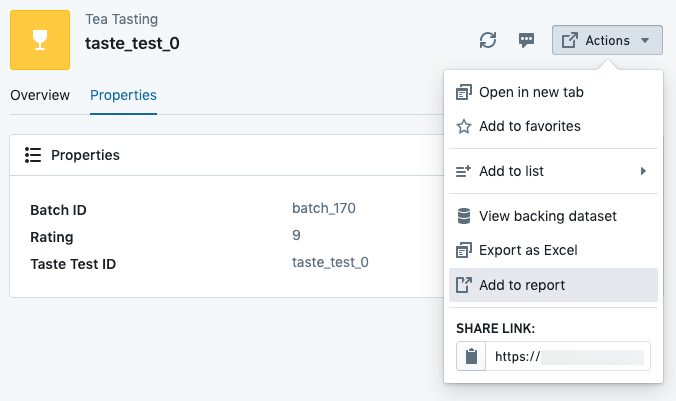
-
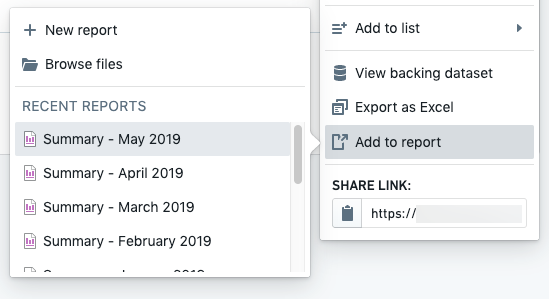
Select a report from the menu.
-
Select a recent report from the Recent reports section, or
- Click New report to create a new report, or
- Click Browse files to select a report from elsewhere in Foundry.
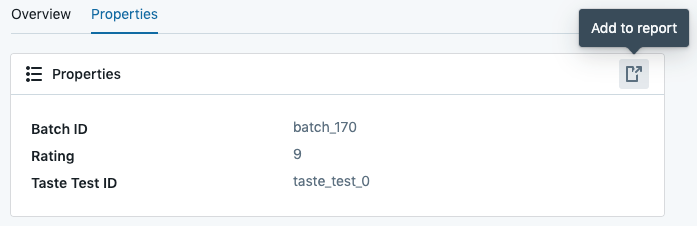
Add an object-view section to a report
:::callout{theme="neutral"} This workflow may be disabled on some Foundry installations. Contact your Palantir representative if you don't see an “Add to Report” button as described below. :::
To add an object view from Object Explorer to a report:
-
Open an object view in Object Explorer.
-
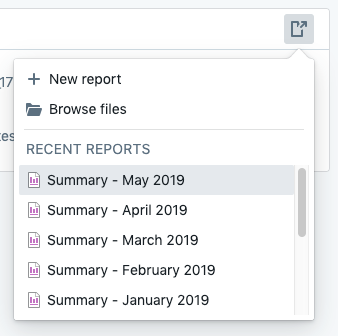
Scroll to the section you'd like to add to a report, then click **Add to Report **in the section header.
-
Select a report from the menu.
-
Select a recent report from the Recent reports section, or
- Click New report to create a new report, or
- Click Browse files to select a report from elsewhere in Foundry.
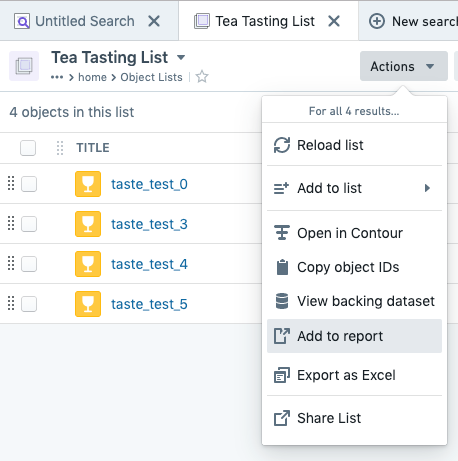
Add a list to a report
To add an object list from Object Explorer to a report:
-
Open a List in Object Explorer.
-
Click Actions in the application header bar.
-
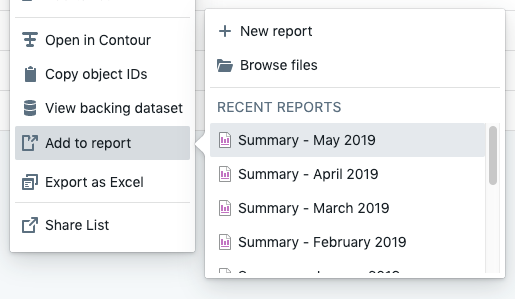
Click Add to Report in the menu that appears.
-
Select a report from the menu:
-
Select a recent report from the Recent reports section, or
- Click New report to create a new report, or
- Click Browse files to select a report from elsewhere in Foundry.
In each workflow above, you should see a confirmation toast when the board has been successfully added to the report that you selected.
Add spreadsheets from Fusion
Reports are a great place to consolidate content from disparate workflows into one place.
To add a Fusion spreadsheet to a report:
-
Open a spreadsheet in Fusion.
-
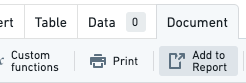
Click the Document tab.
-
Click Add to Report
-
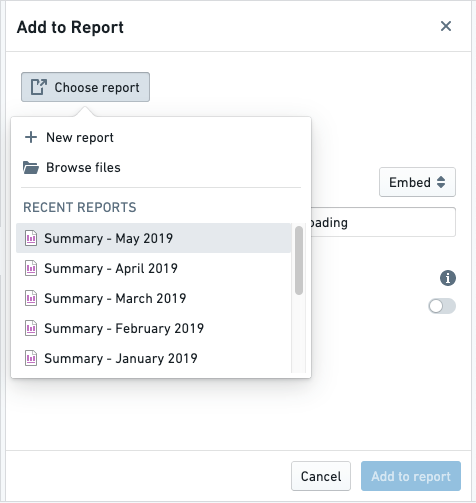
Click Choose report in the sidebar that appears, and select a report from the menu.
-
Customize any other settings in the sidebar.
-
Click the blue Add to report button in the footer of the sidebar.
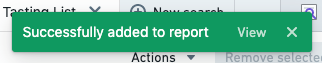
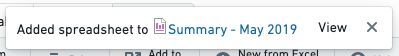
You should see a confirmation toast when the board has been successfully added to the report that you selected.
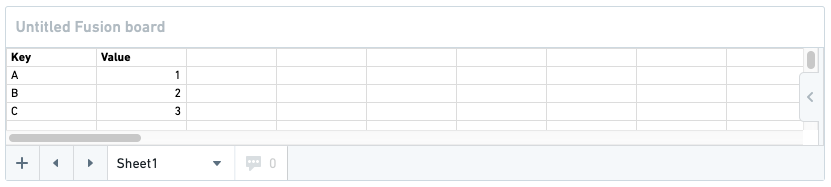
If you navigate to the report, you will see your Fusion spreadsheet at the very bottom:
Add charts from Quiver
Reports are a great place to consolidate content from disparate workflows into one place.
:::callout{theme="neutral"} Reports only supports adding Quiver time series charts from Quiver v1. Notepad is the recommended tool for most new reporting use cases and supports embedding all Quiver charts. :::
To add a Quiver chart to a report:
-
Open a Quiver analysis.
-
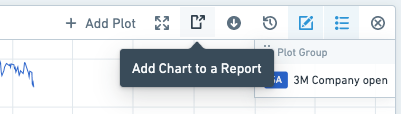
Find the appropriate board, then click Add Chart to a Report in the board's header.
-
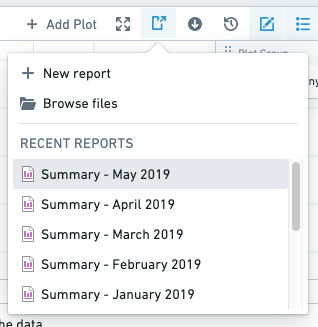
Select a report from the menu that appears.
-
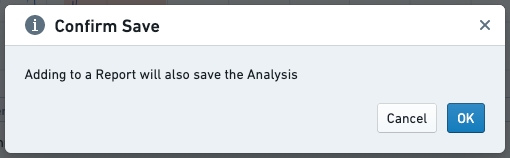
Click OK in the “Confirm Save” dialog that appears. Note: This will also save your analysis.
You should see a confirmation toast when the board has been successfully added to the report that you selected.
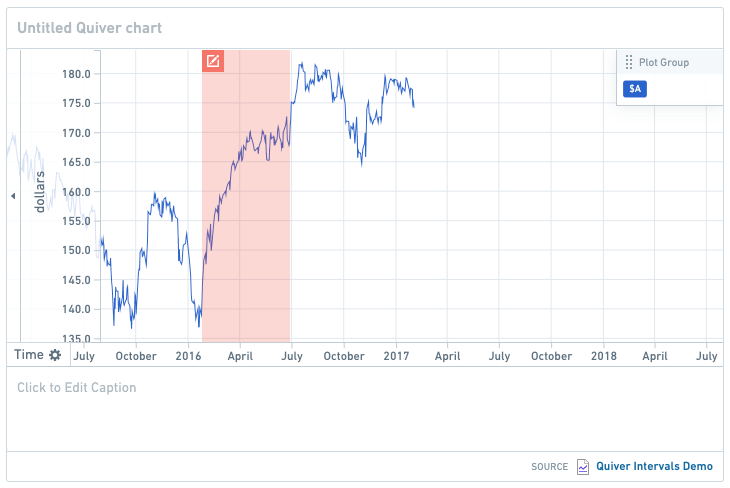
If you navigate to the report, you will see your Quiver chart at the very bottom:
中文翻译
从其他 Foundry 应用添加内容
从 Contour 添加面板
如果您希望展示单个 Contour 分析的结果,建议使用 Contour 仪表盘模式(Dashboard Mode)创建交互式仪表盘。了解有关 Contour 仪表盘模式的更多信息。
分析的分析师和查看者均可将面板添加到报告中。
要将 Contour 面板添加到报告:
-
打开您的 Contour 分析。
-
滚动到相应面板,点击面板标题中的更多操作按钮(
...)。
-
点击发送到报告,然后从菜单中选择一个报告:
-
从最近使用的报告部分选择一个近期报告,或
- 点击新建报告创建新报告,或
- 点击浏览文件从 Foundry 其他位置选择报告。
面板成功添加到所选报告后,您将看到确认提示。
从 Code Workbook 添加面板
报告是将不同工作流中的内容整合到一处的好地方。
:::callout{theme="neutral"} 要在报告中查看和交互 Code Workbook 的可视化内容,建议为底层 Code Workbook 授予用户编辑权限。拥有查看权限的用户只能看到已由编辑权限用户预先计算过的输入数据和参数组合。 :::
要将 Code Workbook 中的面板添加到报告:
-
打开您的 Code Workbook。
-
找到相应面板,右键点击面板标题,或点击操作按钮(
···)。
-
点击添加到报告,然后从菜单中选择一个报告:
-
从最近使用的报告部分选择一个近期报告,或
- 点击新建报告创建新报告,或
- 点击浏览文件从 Foundry 其他位置选择报告。
面板成功添加到所选报告后,您将看到确认提示。
从 Object Explorer 添加视图
报告是将不同工作流中的内容整合到一处的好地方。
Object Explorer 提供多种类型的视图,每种视图均可添加到报告中:
将对象视图添加到报告
要将 Object Explorer 中的对象视图添加到报告:
-
在 Object Explorer 中打开一个对象视图。
-
点击页面右上角的操作。
-
点击添加到报告。
-
从菜单中选择一个报告。
-
从最近使用的报告部分选择一个近期报告,或
- 点击新建报告创建新报告,或
- 点击浏览文件从 Foundry 其他位置选择报告。
将对象视图分区添加到报告
:::callout{theme="neutral"} 此工作流在某些 Foundry 安装环境中可能被禁用。如果您未看到如下所述的"添加到报告"按钮,请联系您的 Palantir 代表。 :::
要将 Object Explorer 中的对象视图分区添加到报告:
-
在 Object Explorer 中打开一个对象视图。
-
滚动到要添加到报告的分区,点击分区标题中的添加到报告。
-
从菜单中选择一个报告。
-
从最近使用的报告部分选择一个近期报告,或
- 点击新建报告创建新报告,或
- 点击浏览文件从 Foundry 其他位置选择报告。
将列表添加到报告
要将 Object Explorer 中的对象列表添加到报告:
-
在 Object Explorer 中打开一个列表。
-
点击应用标题栏中的操作。
-
在出现的菜单中点击添加到报告。
-
从菜单中选择一个报告:
-
从最近使用的报告部分选择一个近期报告,或
- 点击新建报告创建新报告,或
- 点击浏览文件从 Foundry 其他位置选择报告。
在上述每个工作流中,面板成功添加到所选报告后,您将看到确认提示。
从 Fusion 添加电子表格
报告是将不同工作流中的内容整合到一处的好地方。
要将 Fusion 电子表格添加到报告:
-
在 Fusion 中打开一个电子表格。
-
点击文档选项卡。
-
点击添加到报告
-
在出现的侧边栏中点击选择报告,然后从菜单中选择一个报告。
-
在侧边栏中自定义其他设置。
-
点击侧边栏底部的蓝色添加到报告按钮。
面板成功添加到所选报告后,您将看到确认提示。
如果您导航到该报告,您将在最底部看到您的 Fusion 电子表格:
从 Quiver 添加图表
报告是将不同工作流中的内容整合到一处的好地方。
:::callout{theme="neutral"} 报告仅支持从 Quiver v1 添加 Quiver 时间序列图表。记事本(Notepad)是大多数新报告用例的推荐工具,支持嵌入所有 Quiver 图表。 :::
要将 Quiver 图表添加到报告:
-
打开一个 Quiver 分析。
-
找到相应面板,点击面板标题中的将图表添加到报告。
-
从出现的菜单中选择一个报告。
-
在出现的"确认保存"对话框中点击确定。 注意: 这也会保存您的分析。
面板成功添加到所选报告后,您将看到确认提示。
如果您导航到该报告,您将在最底部看到您的 Quiver 图表: