Events(事件(Events))
Events are object types or timeline geometries that include temporal information about a specific point or period of time; most commonly this means an event object has timestamp properties that mark the start and end of the time period. Event objects render as icons on the map canvas as well as within the timeline panel at the bottom of the screen as timeline geometries, both of which you can style to help users better understand objects' events in relation to time.
Review the table below to learn more about the distinctions between event objects and timeline geometries.
| Feature behavior or configuration | Event object | Timeline geometry |
|---|---|---|
| Rendering configuration prerequisites | Configured in Ontology Manager, event objects contain start and end timestamp properties. | Configured in a map's Layers panel, timeline geometries require an object to have at least one timestamp property depending on the geometry's shape. Any object with at least one timestamp property can render on a map's timeline. |
| Map canvas effects | Used for opacity-based styling. | No effects. Will only add layers to a map's timeline. |
| Map timeline effects | Foundry automatically displays event objects on a map's timeline. | Foundry displays objects with timestamp properties as timeline geometries once configured in the map's Layers panel. Event objects will override default timeline styling. |
| Timeline styling options | No timeline styling options. Event objects contain a bar displaying the object's color. | Multiple timeline styling options available, such as those for shape and custom coloring. |
| Display behavior with multiple timeline layers | Event objects only show the event time periods configured in Ontology Manager. | You can configure multiple timeline geometry layers in the Layers panel of your map based on the timestamp properties on your object. |
Learn more about configuring events in the Ontology.
Event objects
Event objects are object types that include temporal information about a specific point or period of time. Most commonly this means an event object has timestamp properties that mark the start and end of the time period. Learn more about configuring events in the Ontology.
Once you add event objects to your map as a layer, you can apply custom styles, explore their linked events, and view event time periods in the timeline.
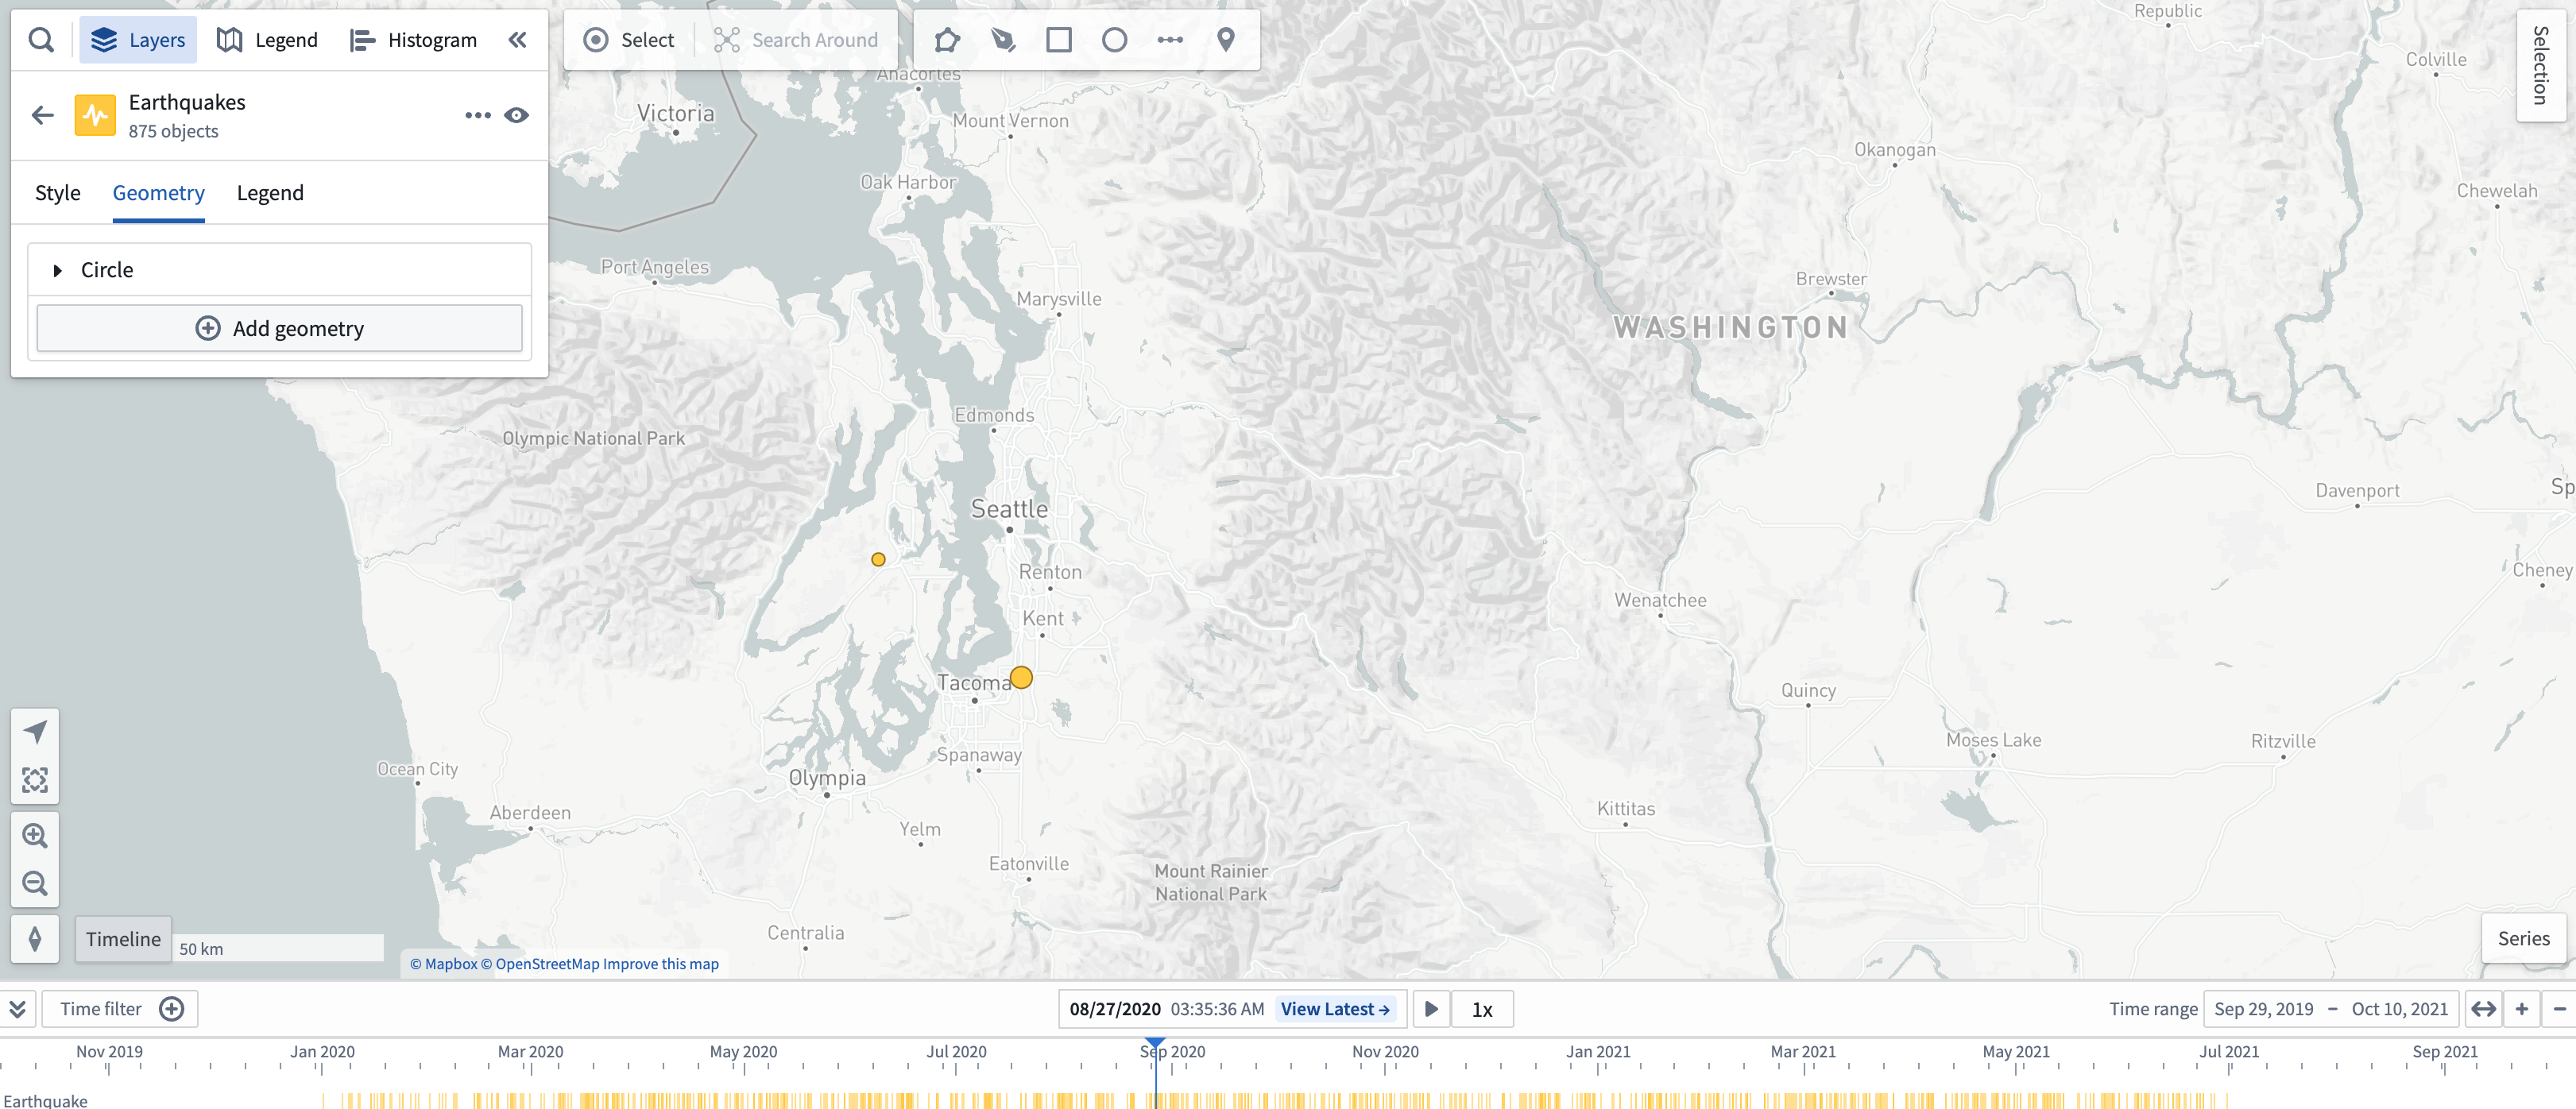
Event objects automatically populate an event layer in the timeline and can be styled by adding a timeline geometry with the same start and end time as the event object's start and end time. There are additional display options available in the Style section of the left panel:
- Shape: Uses a start and end time property to draw a bar by default. An object type's start and end time are configured in Ontology Manager's Capabilities tab.
- Color: Select Color to shade your event object's icons using a Fixed color, Function, Property, or Linked sensor.
If you add a timeline geometry in the Layers panel, it will override this event layer's appearance in the timeline. However, the event's start and end time can still be used for opacity-based styling on the map.
Use event objects for styling
You can style event objects on your map so they are only visible when the current time selection overlaps with the time period of the event. Use this to make your map responsive over time and show only the event objects that are currently relevant. Learn more about using event objects for styling.
Linked events
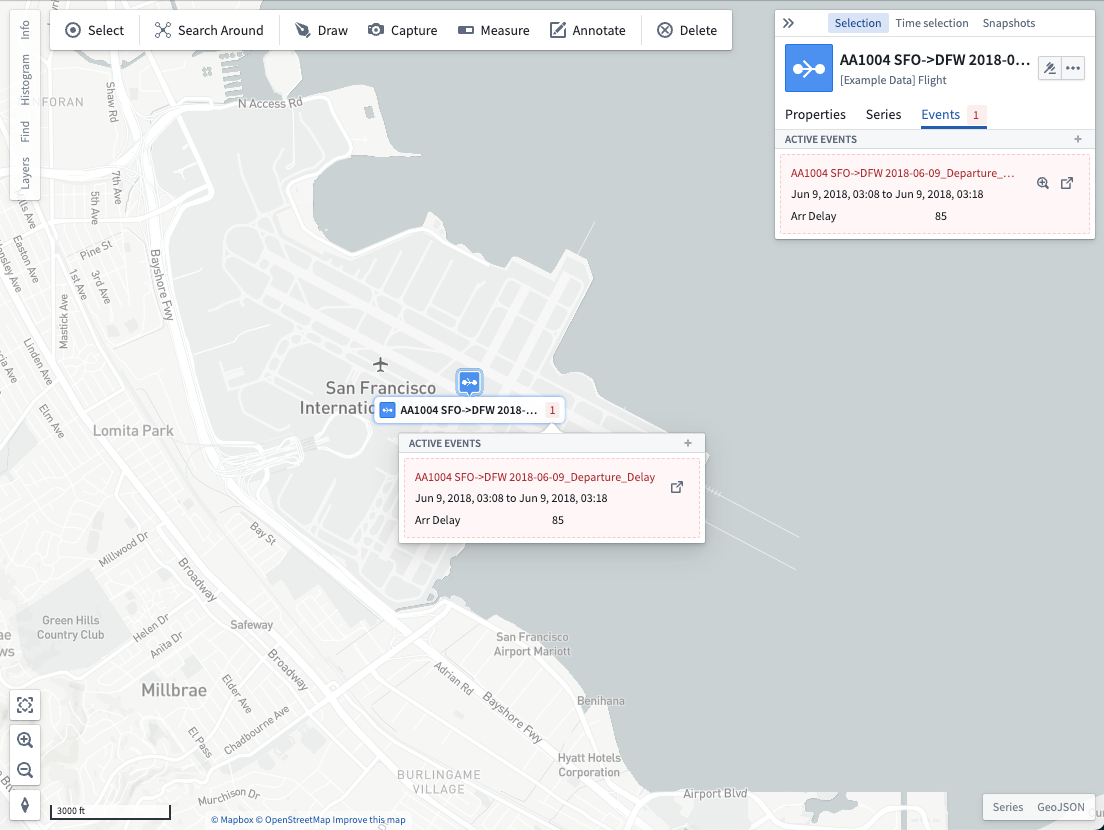
A linked event is an event object linked to another object. On the map, you can view those linked events by selecting the object and opening the Events tab. If the currently selected time lies between the start and end times of an event, the event will appear in the Active events section. Otherwise, the event is considered inactive and can be shown by using the Show inactive events option.
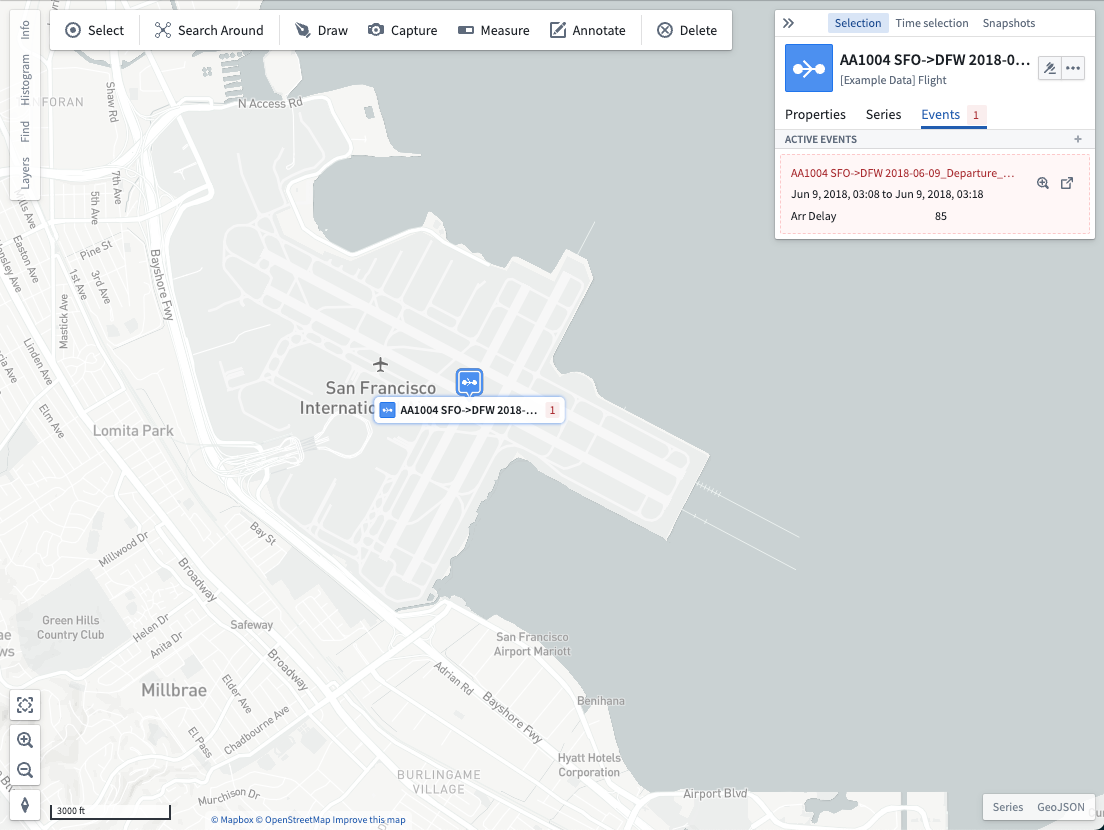
When the linked events are of a geospatial object type click + to add them to your map:
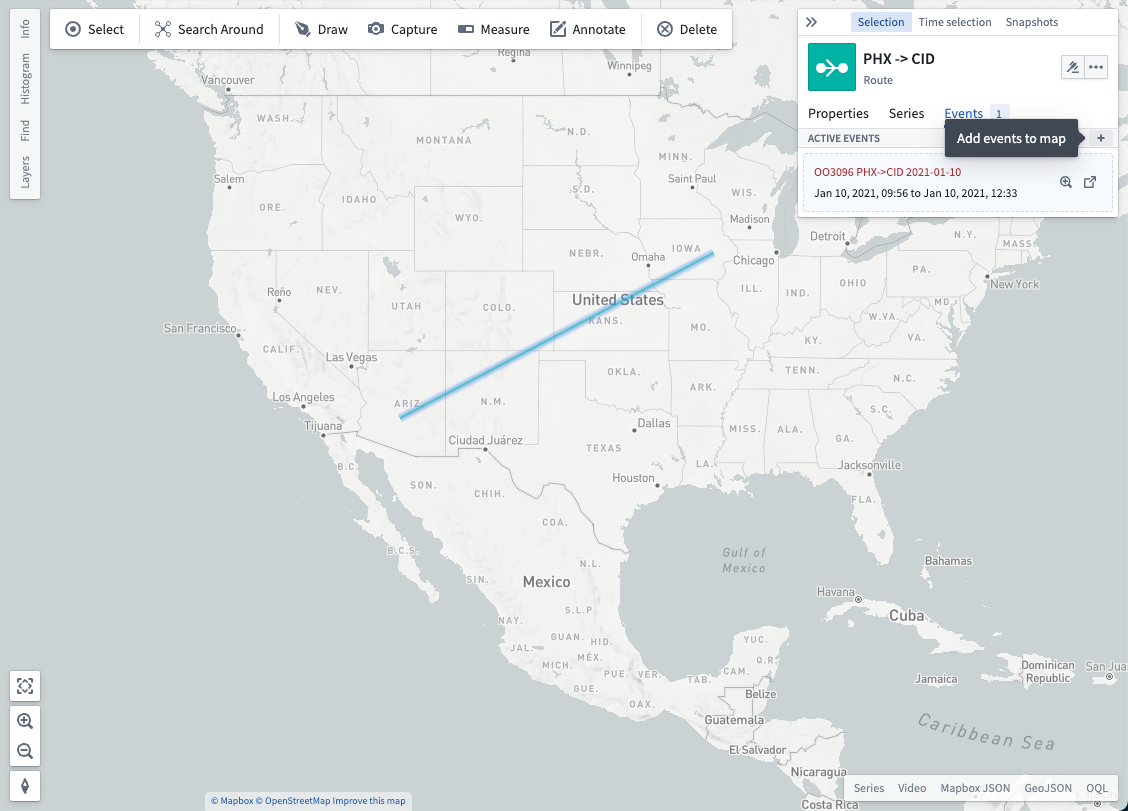
Each event has corresponding actions you may take:
- Set the selected time window to match the time endpoints of the event with the
 icon.
icon. - Open the event in Object Explorer with the
 icon.
icon.
Show on series panel [Planned deprecation]
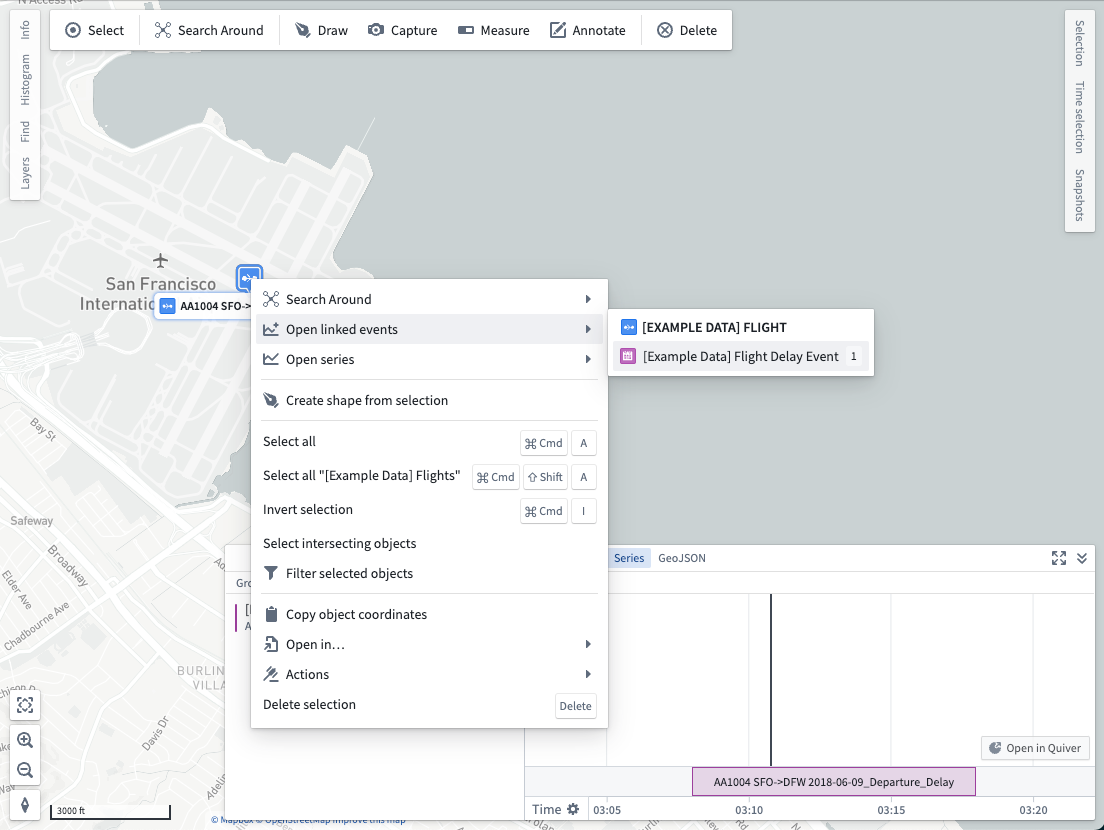
Right-click on an object and select Open linked events to open and add linked events to the series panel. Analyze your time series data in the context of important periods of time, and adjust the time selection so the map reflects a time of interest.
Show counts in labels
If you enable labels for a layer, a count of active events also displays in the label for each object. Hover over the active event count to view the active events:
Timeline geometries
Defined by an event object's paired timestamp properties, timeline geometries render as event layers in a map's timeline and can be styled by an object property. Timeline geometries offer additional custom style options when compared to event objects rendered as a map layer.
Learn more about adding and configuring timeline geometries on your map.
中文翻译
事件(Events)
事件是包含特定时间点或时间段时间信息的对象类型(object types)或时间线几何图形(timeline geometries);最常见的情况是,事件对象具有标记时间段开始和结束的时间戳属性(timestamp properties)。事件对象在地图画布上以图标形式呈现,同时在屏幕底部的时间线面板中作为时间线几何图形显示。您可以通过样式设置,帮助用户更好地理解对象事件与时间的关系。
请查看下表,了解事件对象与时间线几何图形之间的区别。
| 功能行为或配置 | 事件对象(Event object) | 时间线几何图形(Timeline geometry) |
|---|---|---|
| 渲染配置前提条件 | 在 Ontology Manager 中配置,事件对象包含开始和结束时间戳属性。 | 在地图的图层(Layers)面板中配置,时间线几何图形要求对象至少有一个时间戳属性(具体取决于几何图形的形状)。任何至少包含一个时间戳属性的对象都可以在地图的时间线上渲染。 |
| 地图画布效果 | 用于基于不透明度的样式设置。 | 无效果。仅会向地图的时间线添加图层。 |
| 地图时间线效果 | Foundry 会自动在地图的时间线上显示事件对象。 | 一旦在地图的图层面板中配置,Foundry 会将具有时间戳属性的对象显示为时间线几何图形。事件对象会覆盖默认的时间线样式。 |
| 时间线样式选项 | 无时间线样式选项。事件对象包含一个显示对象颜色的条形。 | 提供多种时间线样式选项,例如形状和自定义颜色。 |
| 多时间线图层时的显示行为 | 事件对象仅显示在 Ontology Manager 中配置的事件时间段。 | 您可以根据对象的时间戳属性,在地图的图层面板中配置多个时间线几何图形图层。 |
事件对象(Event objects)
事件对象是包含特定时间点或时间段时间信息的对象类型。最常见的情况是,事件对象具有标记时间段开始和结束的时间戳属性。了解有关在 Ontology 中配置事件的更多信息。
一旦您将事件对象作为图层添加到地图,即可应用自定义样式、探索其链接事件,并在时间线中查看事件时间段。
事件对象会自动在时间线中填充一个事件图层,并且可以通过添加与事件对象开始和结束时间相同的时间线几何图形来进行样式设置。在左侧面板的样式(Style)部分中,还有额外的显示选项:
- 形状(Shape): 默认使用开始和结束时间属性绘制一个条形。对象类型的开始和结束时间在 Ontology Manager 的功能(Capabilities)选项卡中配置。
- 颜色(Color): 选择颜色,使用固定颜色(Fixed color)、函数(Function)、属性(Property)或链接传感器(Linked sensor)为事件对象的图标着色。
如果您在图层面板中添加了时间线几何图形,它将覆盖时间线中该事件图层的外观。但是,事件的开始和结束时间仍可用于地图上基于不透明度的样式设置。
使用事件对象进行样式设置
您可以对地图上的事件对象进行样式设置,使其仅在当前时间选择(time selection)与事件时间段重叠时才可见。利用此功能,您可以使地图随时间变化而响应,仅显示当前相关的事件对象。了解有关使用事件对象进行样式设置的更多信息。
链接事件(Linked events)
链接事件是指链接到另一个对象的事件对象。在地图上,您可以通过选择对象并打开事件(Events)选项卡来查看这些链接事件。如果当前选择的时间位于事件的开始和结束时间之间,该事件将显示在活动事件(Active events)部分中。否则,该事件被视为非活动事件,可以通过使用显示非活动事件(Show inactive events)选项来显示。
当链接事件属于地理空间对象类型(geospatial object type)时,点击 + 将其添加到地图:
每个事件都有相应的操作可供执行:
- 使用 图标,将选定的时间窗口设置为与事件的时间端点匹配。
- 使用 图标,在 Object Explorer 中打开事件。
在序列面板中显示 [计划弃用]
右键单击对象并选择打开链接事件(Open linked events),以打开链接事件并将其添加到序列面板(series panel)。在重要时间段的背景下分析您的时间序列数据,并调整时间选择,使地图反映感兴趣的时间点。
在标签中显示计数
如果您为某个图层启用了标签,则每个对象的标签中还会显示活动事件的计数。将鼠标悬停在活动事件计数上,即可查看活动事件:
时间线几何图形(Timeline geometries)
时间线几何图形由事件对象的成对时间戳属性定义,在地图的时间线中作为事件图层渲染,并且可以通过对象属性进行样式设置。与作为地图图层渲染的事件对象相比,时间线几何图形提供了额外的自定义样式选项。