Map Layer Editor(地图图层编辑器(Map Layer Editor))
The Map Layer Editor application allows you to create, edit, and preview map layers. A map layer contains geospatial data and defines how the data should be visualized. You can use map layers in the Map Application and the Workshop map widget.
The Map Layer Editor provides a point-and-click UI for configuring map layers that contain vector or raster data. If you need more control or want to use more advanced mapping features, you can instead choose to write a Mapbox GL JS Style Specification document ↗.
Create a new map layer
In Foundry, navigate to the folder in which you wish to create the map layer, and select Map Layer from the New menu:

Then, add a data source or choose to write a Mapbox JSON document to begin configuring your layer.
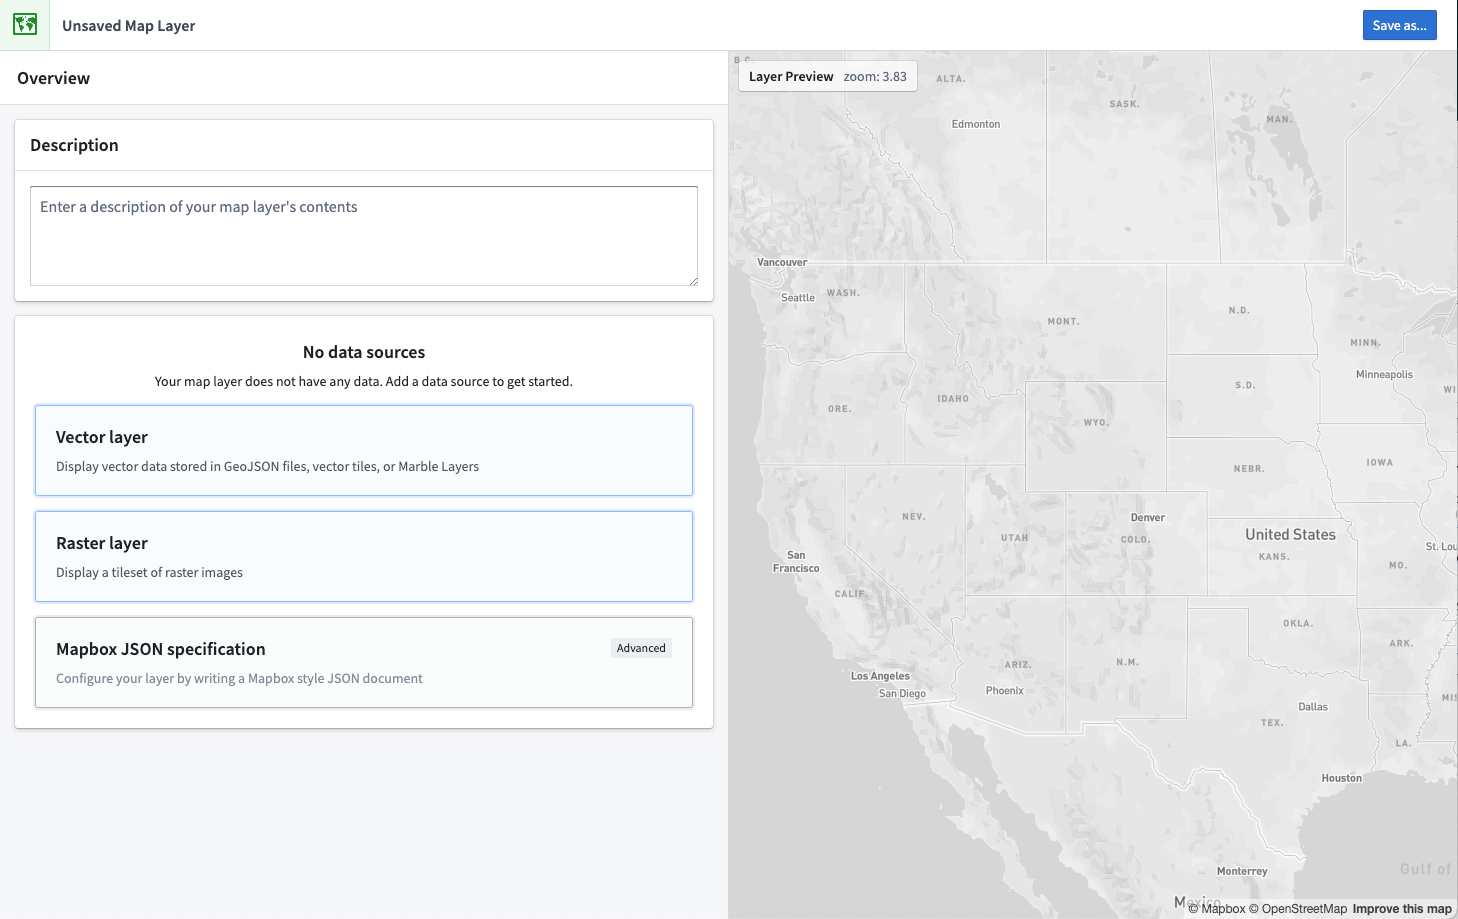
:::callout{theme="warning"} We recommend only using a Mapbox JSON document when you require functionality that is not supported by the vector or raster layers. :::
You can preview your map layer live in the Layer Preview panel on the right.
Always click Save after creating or modifying a map layer to make the layer available in the Map application.
Vector layers
Vector layers display geometry data from GeoJSON or vector tile sources. There are four ways to specify a data source:
- GeoJSON File: Select a manually uploaded GeoJSON file.
- Dataset GeoJSON File: Select a dataset, and then choose a GeoJSON file contained in that dataset.
- GeoJSON URL: Enter a URL for a GeoJSON file.
- MVT URL: Enter a URL for a vector tileset.
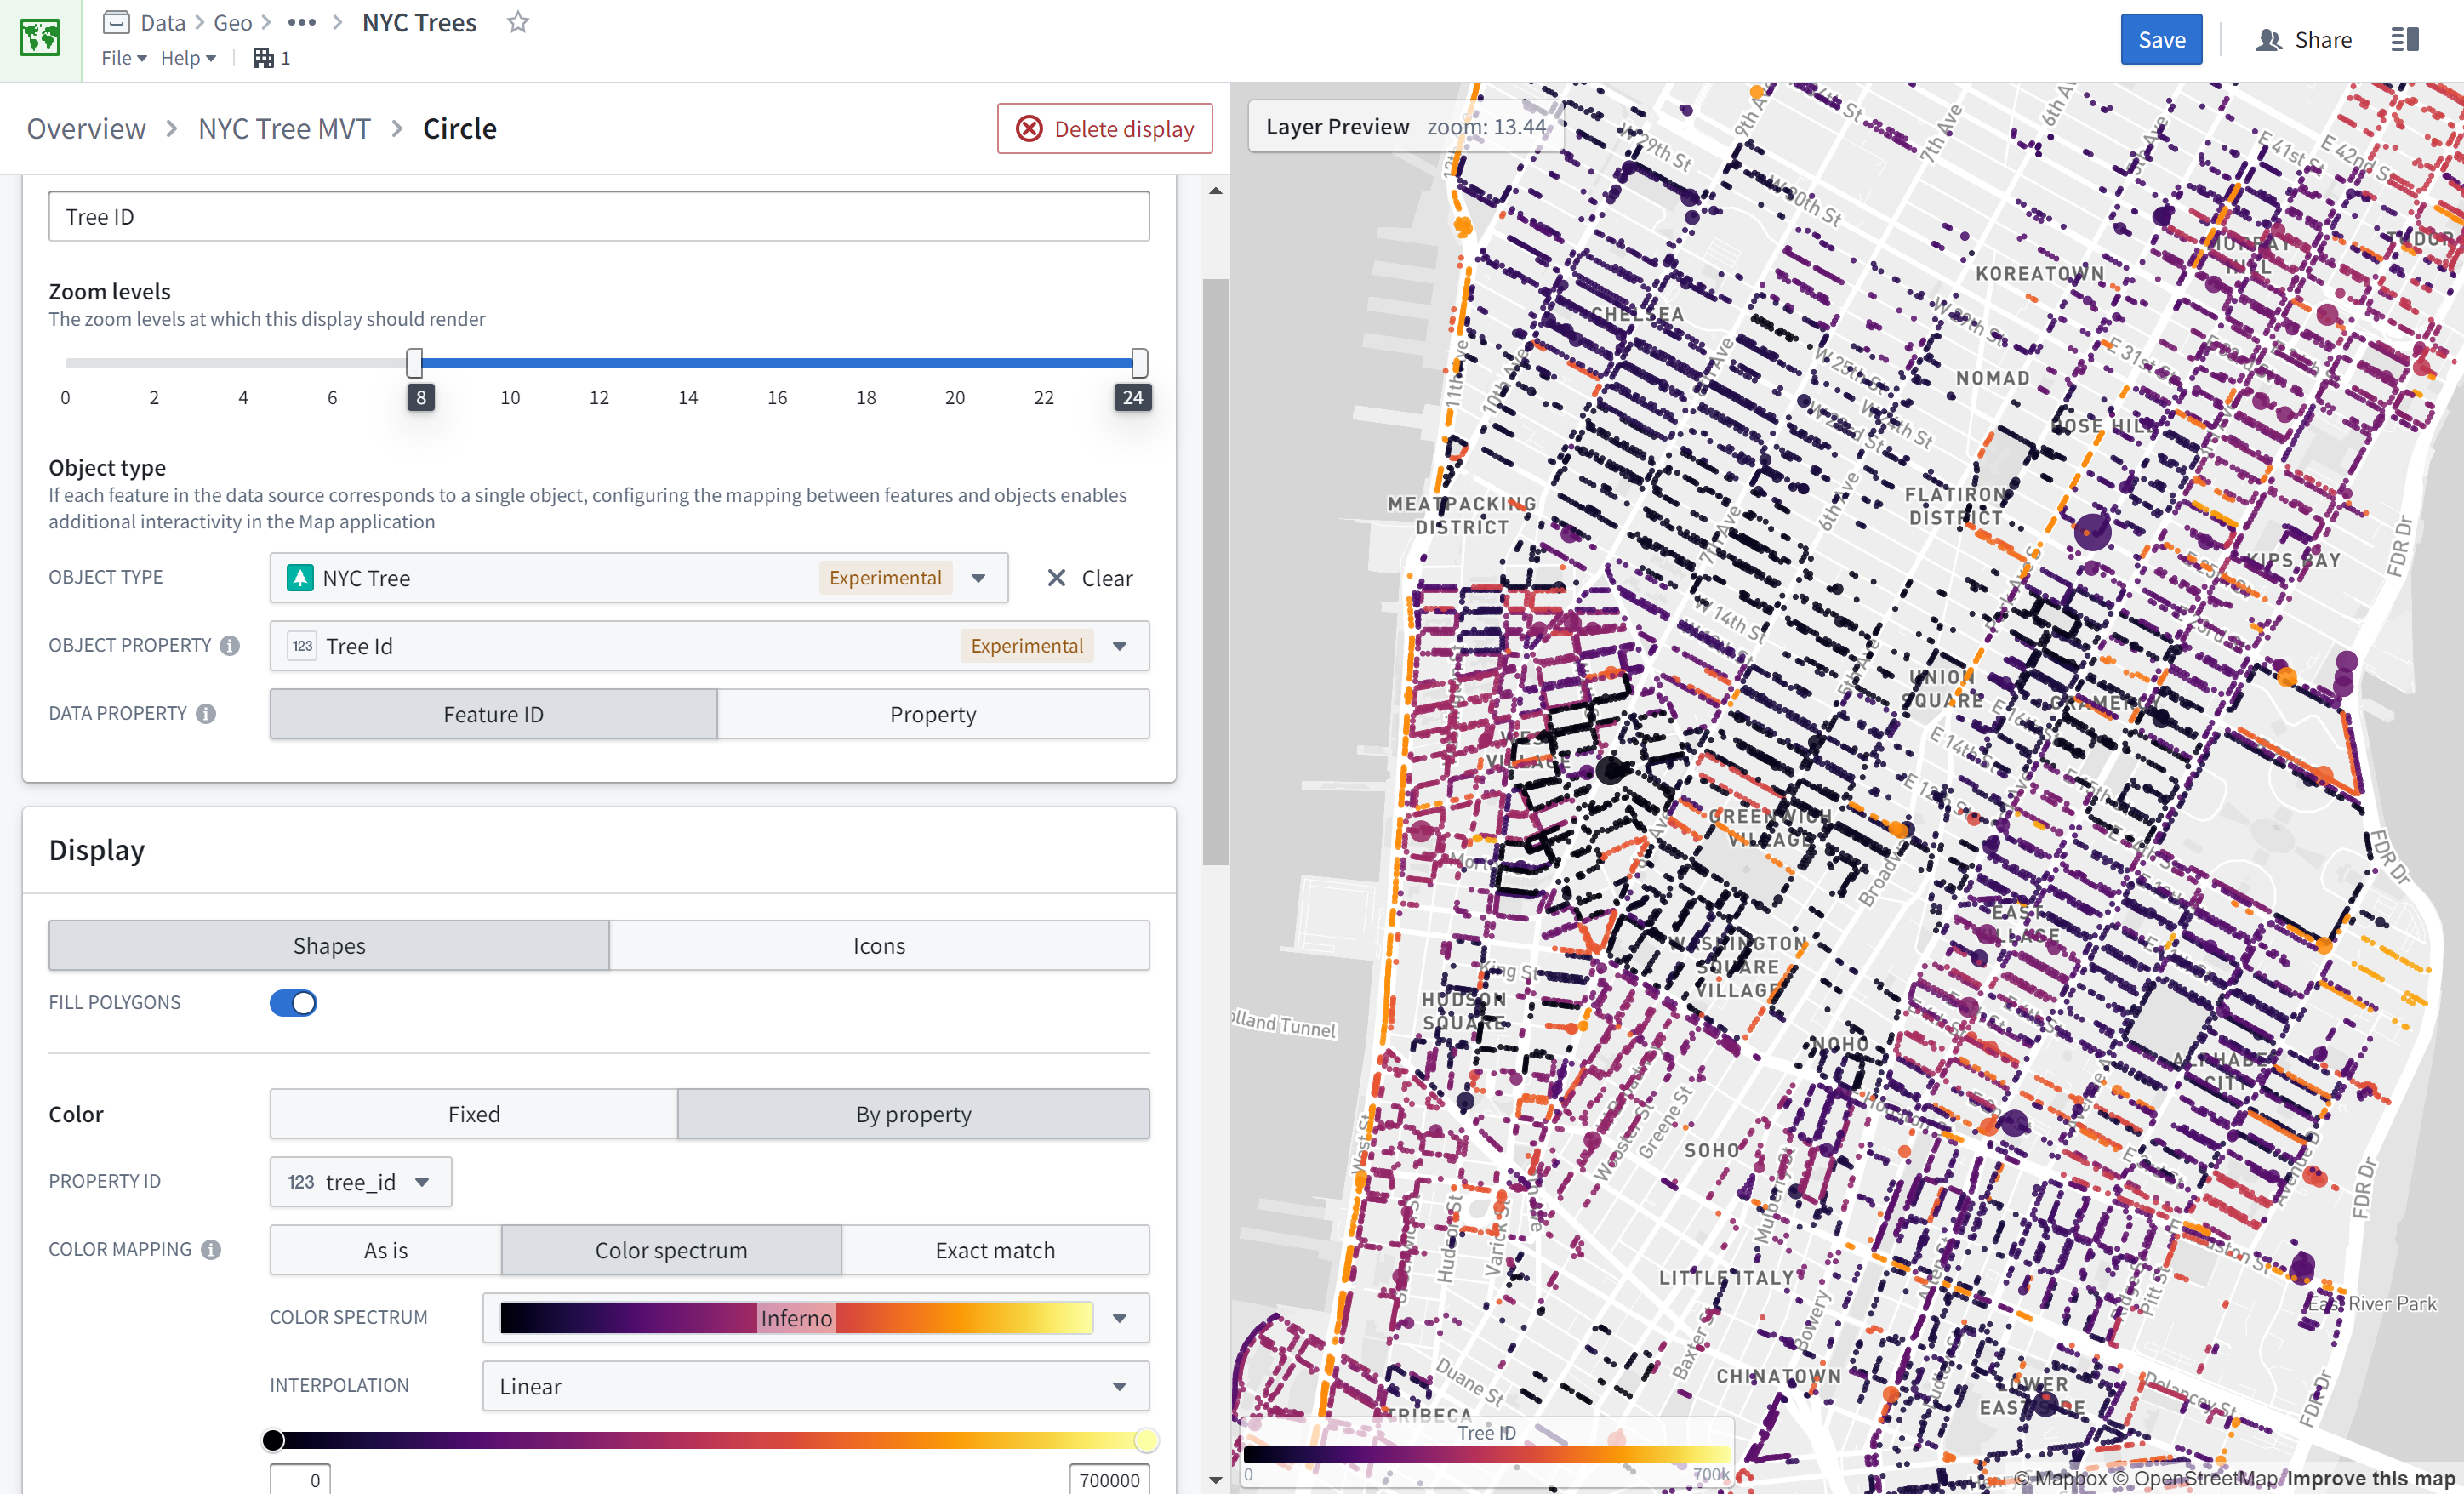
After adding a source, you can add one or more displays to configure how your data is visualized on the map.
Raster layers
Raster layers display bitmap data from a raster tileset. Configure a raster data source by specifying the URL for the tileset.
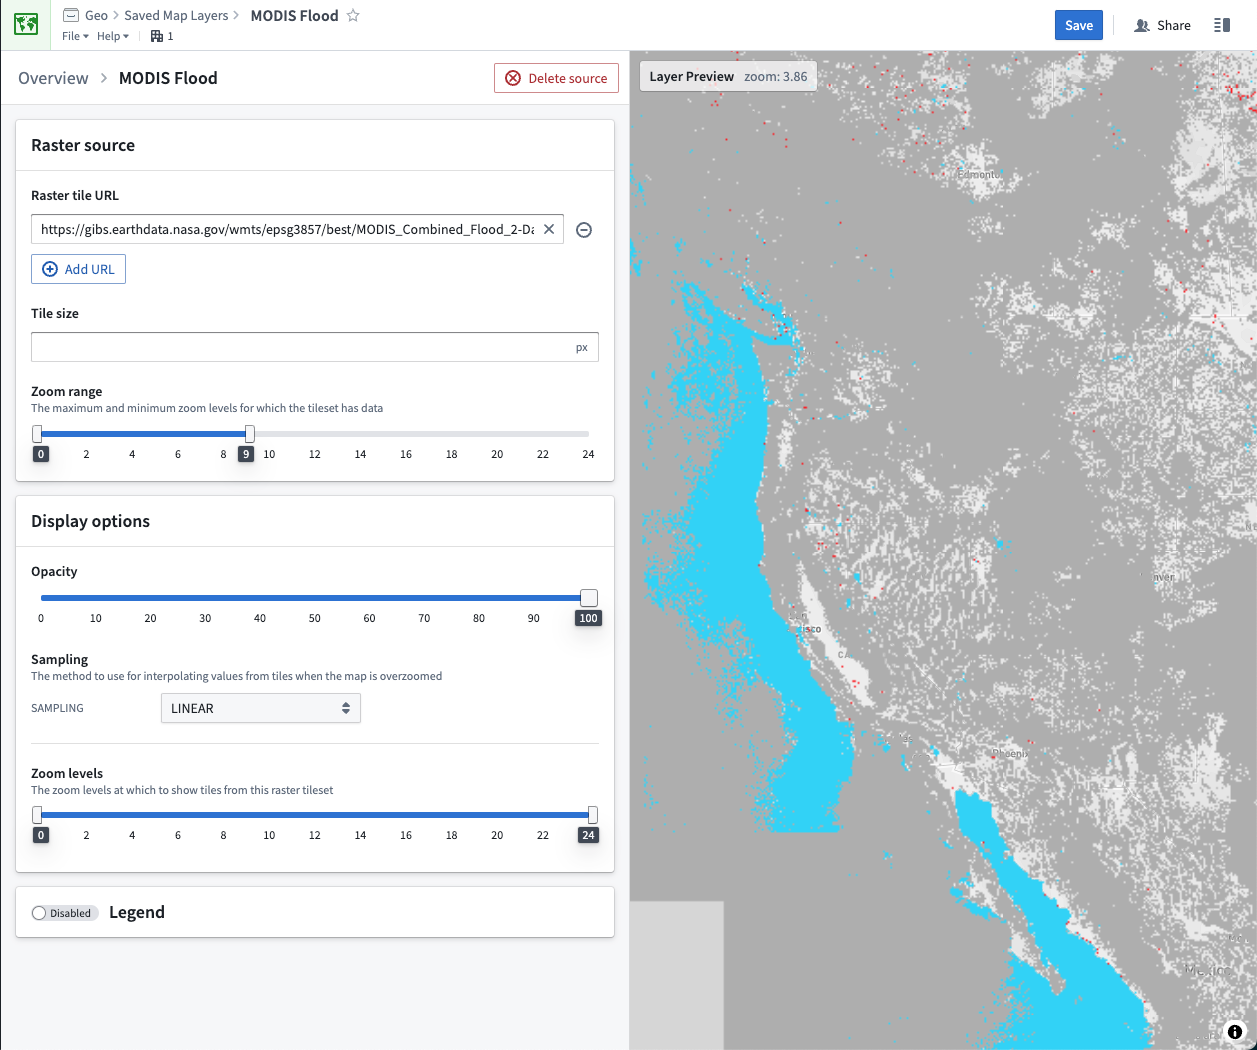
The available display options for raster layers are:
- Opacity: How opaque or transparent to display the layer.
- Sampling: The interpolation method to use when the map is zoomed in such that the raster imagery must be scaled up.
- Linear: interpolates values using an average of the closest source pixels, which can result in a blurry appearance when overzoomed.
- Nearest: interpolates by selecting the nearest source pixel, which creates a sharp but pixelated appearance when overzoomed.
- Zoom levels: The maximum and minimum zoom levels at which to display the layer.
Object layers
Object layers display data directly from your Ontology. Only object types that are synced to OSS or OQL (deprecated) and have a geopoint or geoshape property type can be displayed via object layers.
:::callout{theme="neutral"} Although OSS or OQL (deprecated) is required for object layers, it is not available on all instances. Contact your Palantir representative for more information. :::
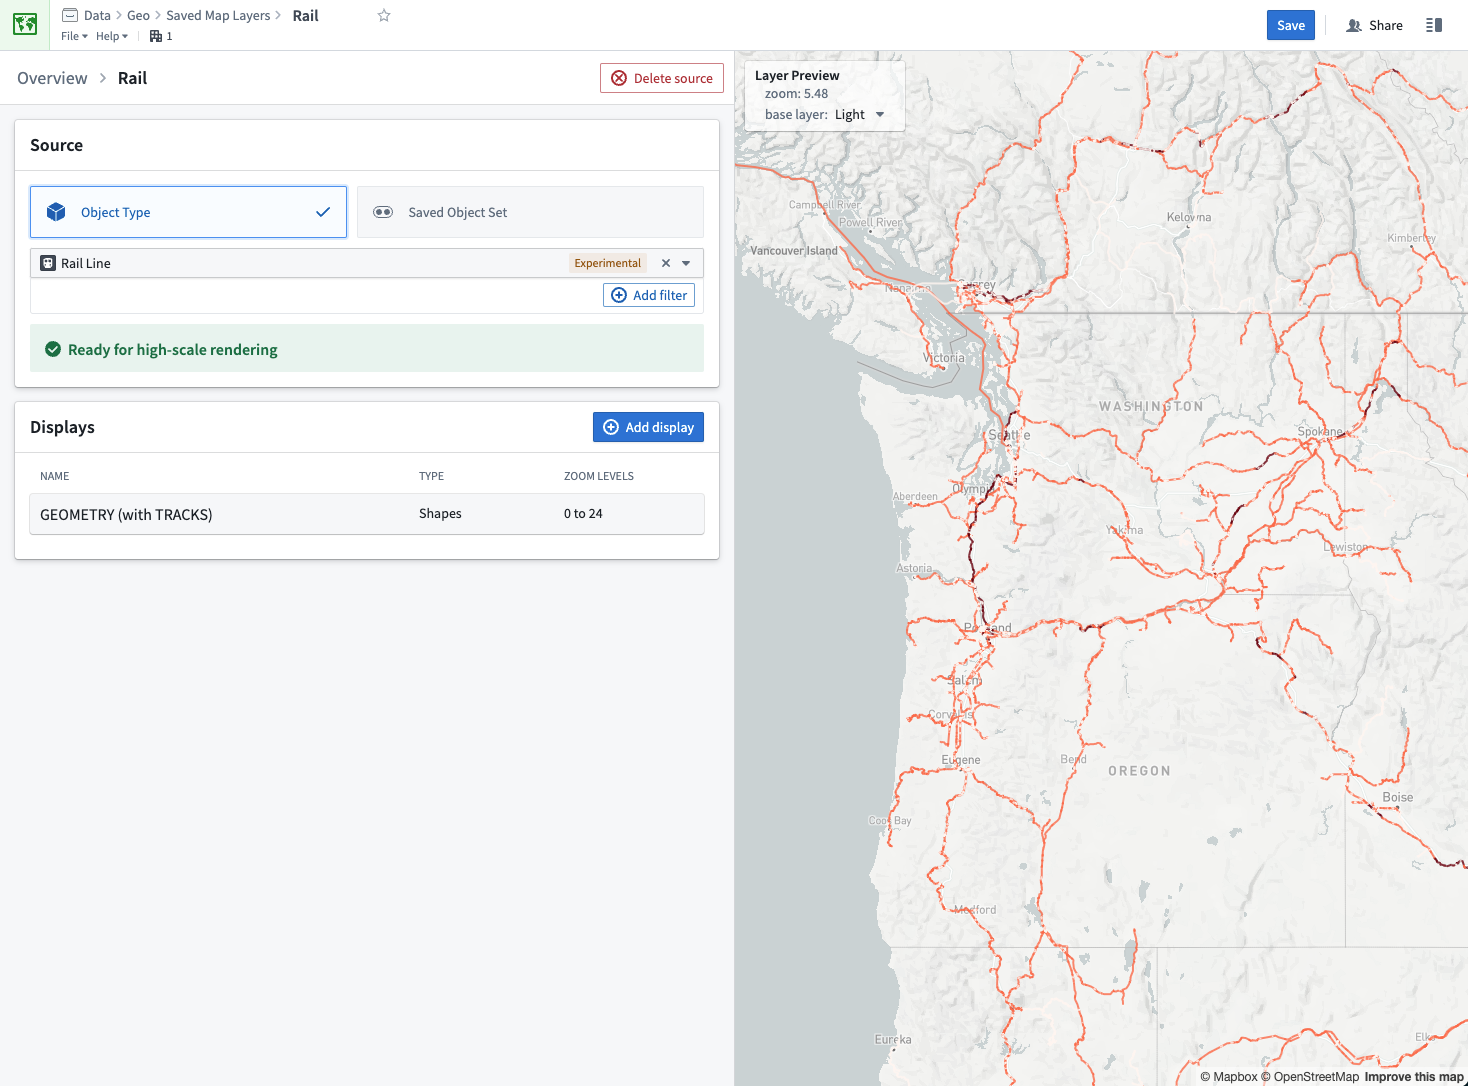
Object layers provide two ways to specify the data you want to render:
- Object type: Select an object type and optionally define filters. All matching objects will display in your map layer.
- Saved object set: Select an exploration saved from Object Explorer. The layer app will display all objects that are present in your saved exploration.
The options for configuring object layer displays are the same as for vector layers.
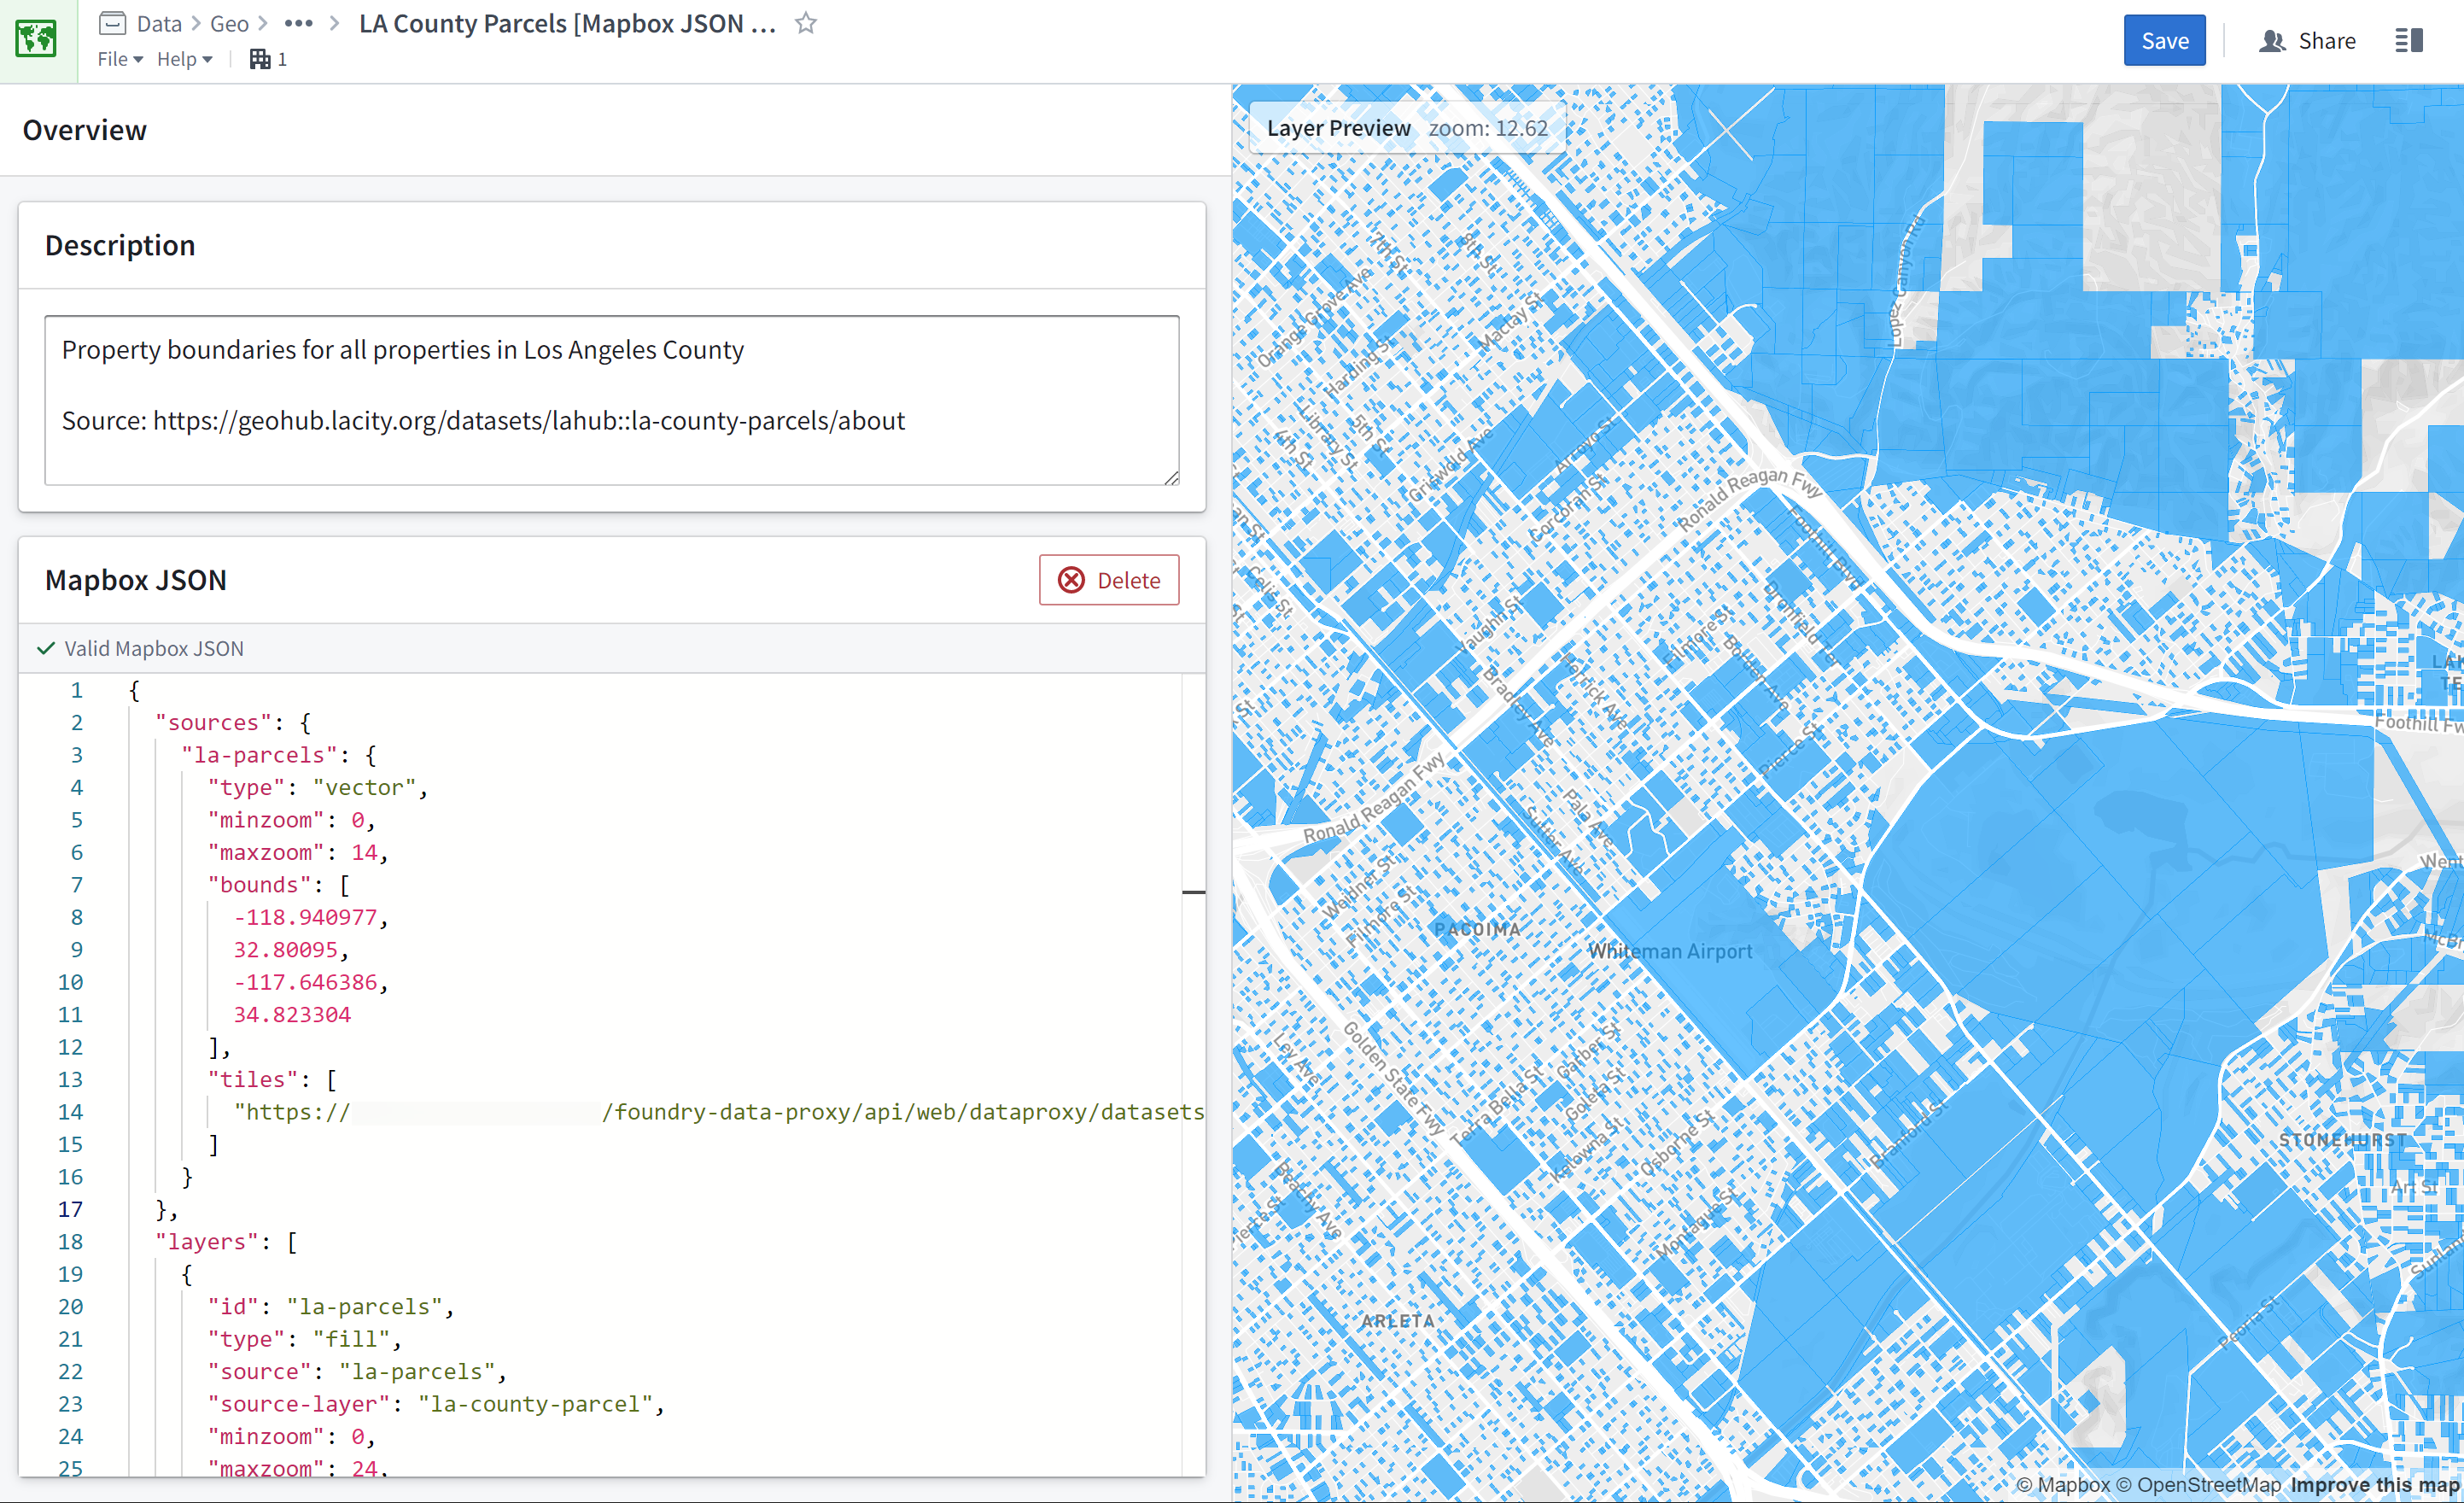
Mapbox JSON layers
For Mapbox JSON layers, you can edit the JSON document in the Map Layer Editor. The editor validates the JSON and highlights any errors.
The JSON content must conform to the Mapbox GL JS Style Specification ↗, but only the sources and layers properties are supported (and both are required).
中文翻译
地图图层编辑器(Map Layer Editor)
地图图层编辑器应用允许您创建、编辑和预览地图图层。地图图层包含地理空间数据,并定义数据的可视化方式。您可以在地图应用和Workshop地图组件中使用地图图层。
地图图层编辑器提供点击式用户界面,用于配置包含矢量(vector)或栅格(raster)数据的地图图层。如果您需要更多控制或希望使用更高级的地图功能,可以选择编写Mapbox GL JS样式规范文档 ↗。
创建新地图图层
在Foundry中,导航至您希望创建地图图层的文件夹,然后从新建菜单中选择地图图层:
接着,添加数据源或选择编写Mapbox JSON文档,开始配置您的图层。
:::callout{theme="warning"} 我们建议仅在需要矢量或栅格图层不支持的功能时,才使用Mapbox JSON文档。 :::
您可以在右侧的图层预览面板中实时预览地图图层。
创建或修改地图图层后,务必点击保存,以使该图层在地图应用中可用。
矢量图层(Vector layers)
矢量图层显示来自GeoJSON或矢量瓦片(vector tile)源的几何数据。指定数据源有四种方式:
- GeoJSON文件: 选择手动上传的GeoJSON文件。
- 数据集GeoJSON文件: 选择一个数据集,然后选择该数据集中包含的GeoJSON文件。
- GeoJSON URL: 输入GeoJSON文件的URL。
- MVT URL: 输入矢量瓦片集(vector tileset)的URL。
添加源后,您可以添加一个或多个显示配置,以定义数据在地图上的可视化方式。
栅格图层(Raster layers)
栅格图层显示来自栅格瓦片集(raster tileset)的位图数据。通过指定瓦片集的URL来配置栅格数据源。
栅格图层的可用显示选项包括:
- 不透明度(Opacity): 控制图层的显示不透明度或透明度。
- 采样(Sampling): 当地图放大导致栅格图像需要缩放时使用的插值方法。
- 线性(Linear): 使用最近源像素的平均值进行插值,过度放大时可能导致图像模糊。
- 最近邻(Nearest): 通过选择最近的源像素进行插值,过度放大时会产生清晰但像素化的效果。
- 缩放级别(Zoom levels): 显示图层的最大和最小缩放级别。
对象图层(Object layers)
对象图层直接显示来自您的本体(Ontology)的数据。只有同步到OSS或OQL(已弃用)且具有地理点(geopoint)或地理形状(geoshape)属性类型的对象类型,才能通过对象图层显示。
:::callout{theme="neutral"} 虽然对象图层需要OSS或OQL(已弃用),但并非所有实例都支持。请联系您的Palantir代表了解更多信息。 :::
对象图层提供两种方式来指定要渲染的数据:
- 对象类型(Object type): 选择一个对象类型,并可选择定义过滤器。所有匹配的对象将显示在地图图层中。
- 已保存对象集(Saved object set): 选择从对象浏览器保存的探索。图层应用将显示已保存探索中的所有对象。
配置对象图层显示的选项与矢量图层相同。
Mapbox JSON图层
对于Mapbox JSON图层,您可以在地图图层编辑器中编辑JSON文档。编辑器会验证JSON内容并高亮显示任何错误。
JSON内容必须符合Mapbox GL JS样式规范 ↗,但仅支持sources和layers属性(且两者均为必填项)。