Time and temporal data in the map(地图中的时间与时态数据)
The map has a collection of features for visualizing and working with data that varies over time. There are a variety of forms that temporal data takes, each of which can be used and visualized in different ways.
Time-based data types available on a map
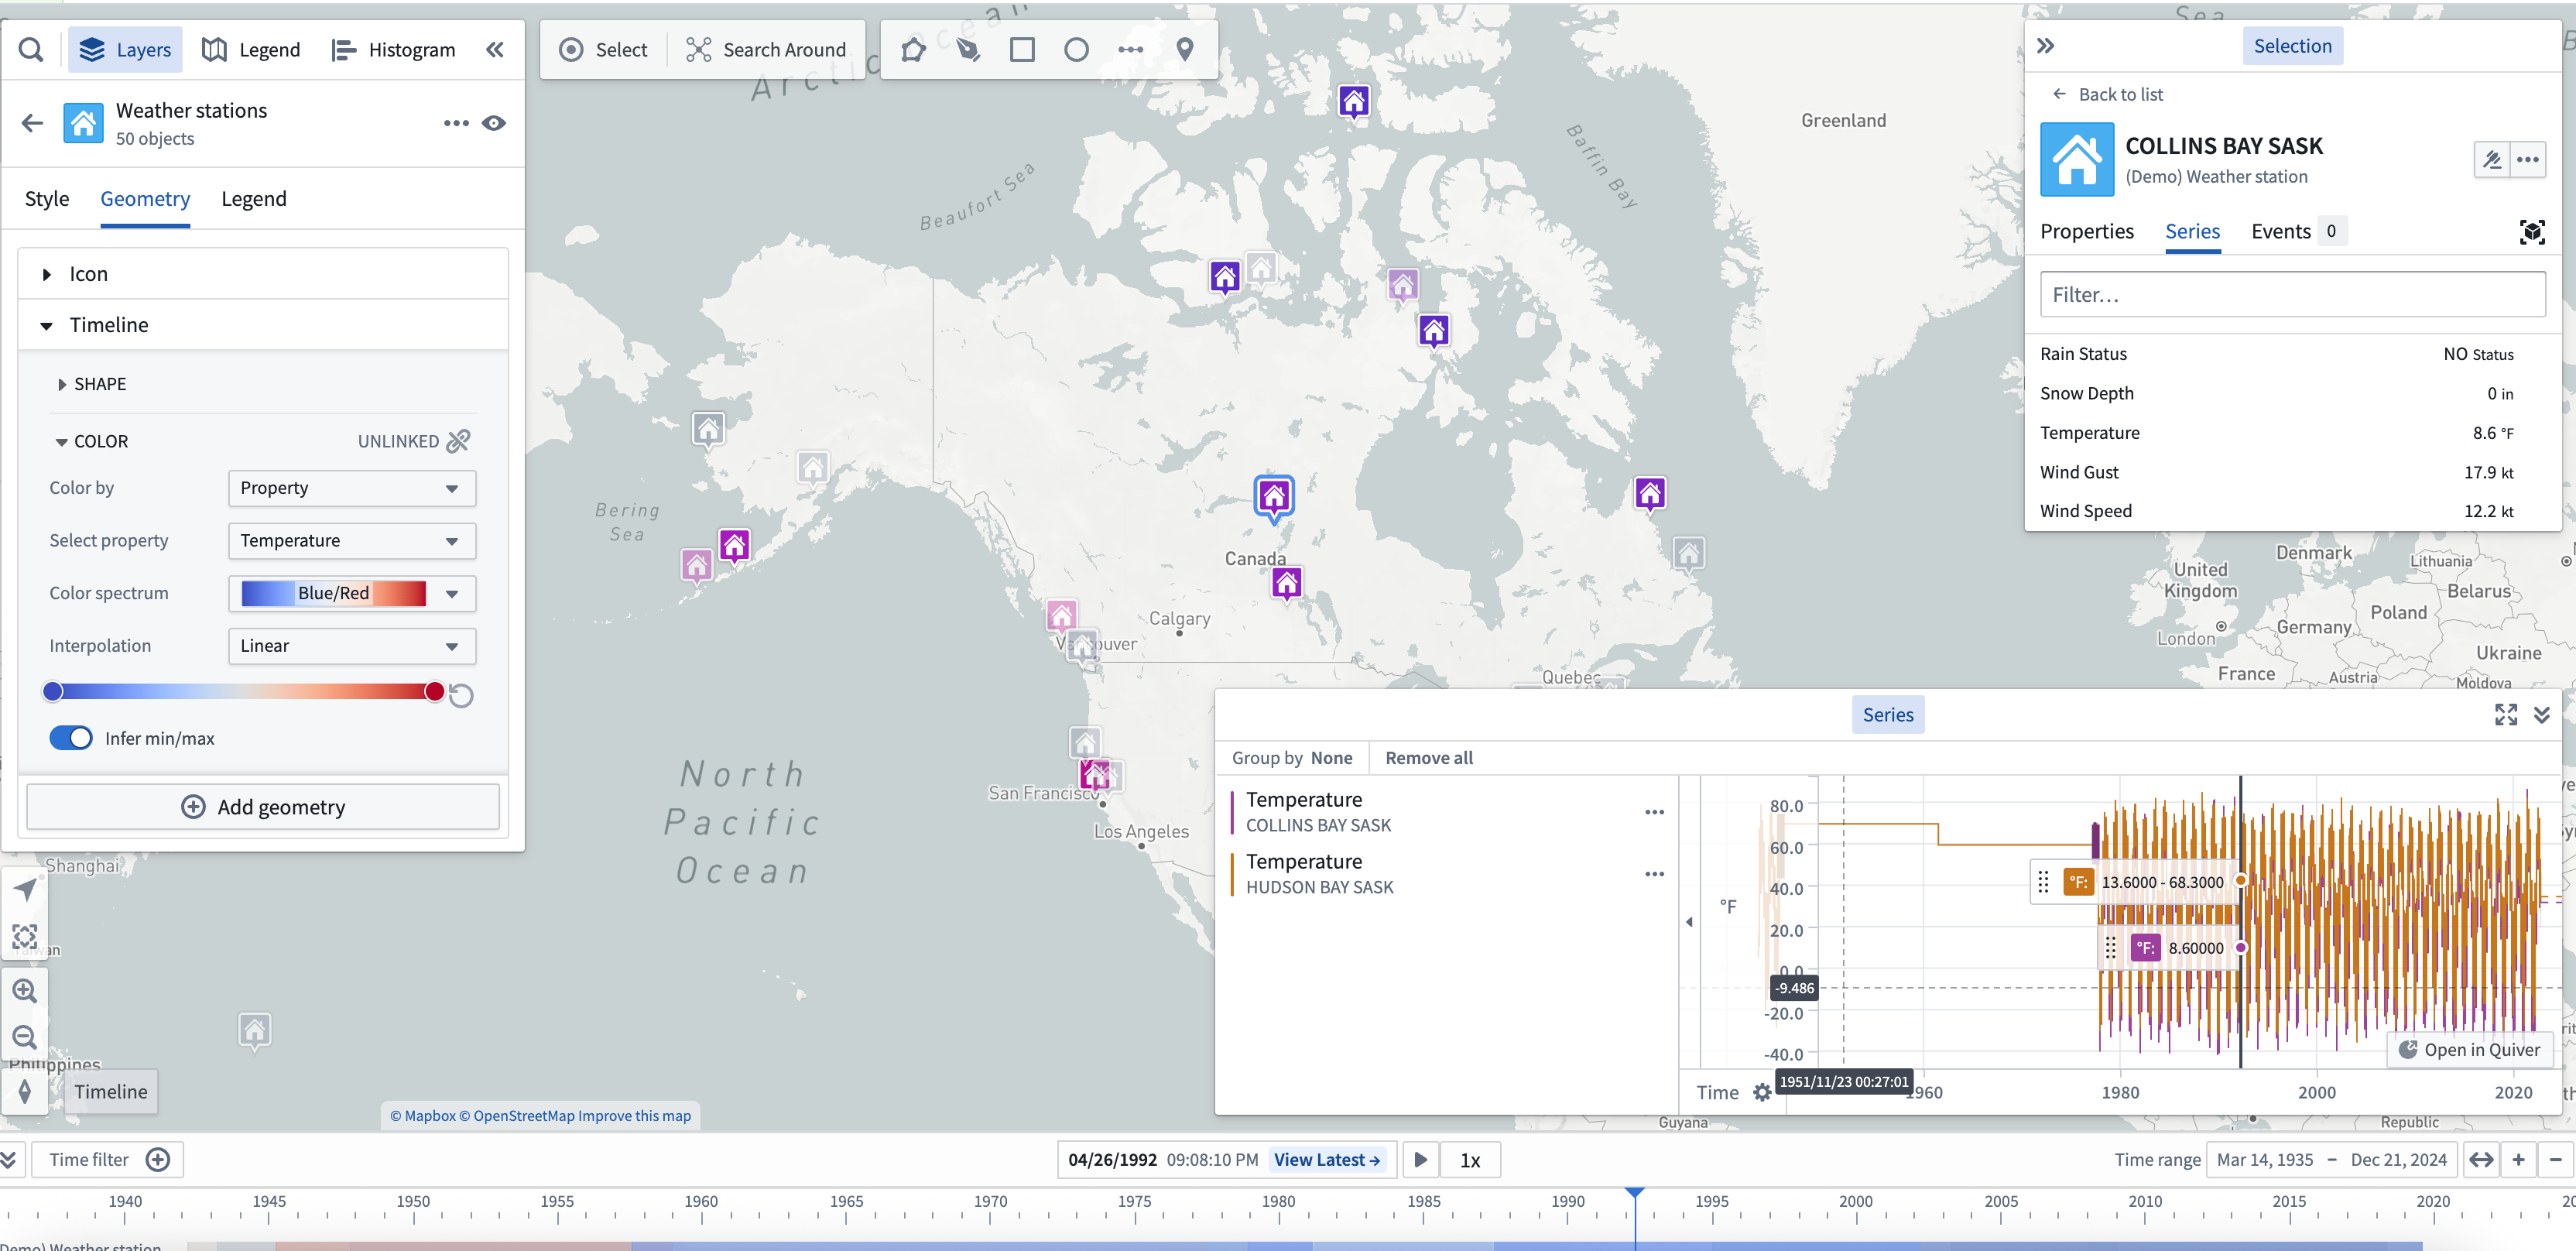
Time series
Time series are measured values that change over time. You can configure time series values in the Ontology as time series properties. Use time series to style objects on your map, and view them in the timeline.
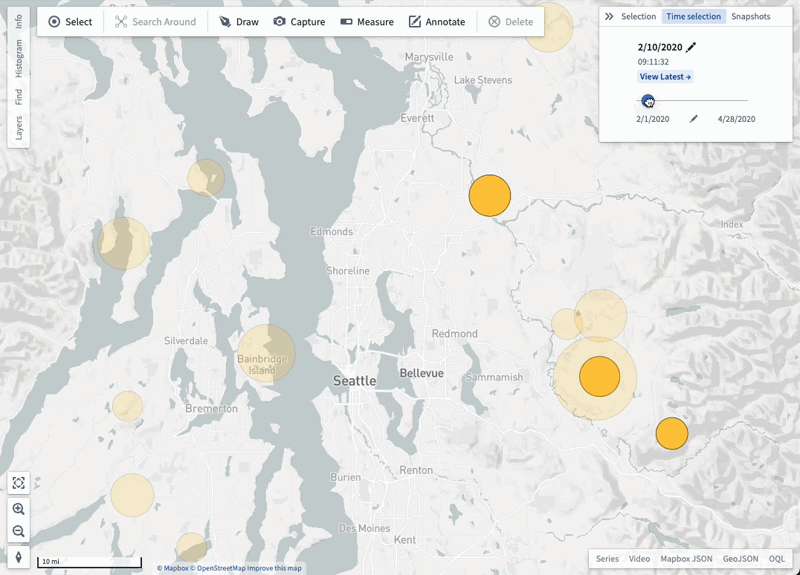
Events
Events objects are objects that have additional metadata that associate the object with a specific time or time range. Event objects can be used to control the opacity of objects on your map and visualized in the timeline.
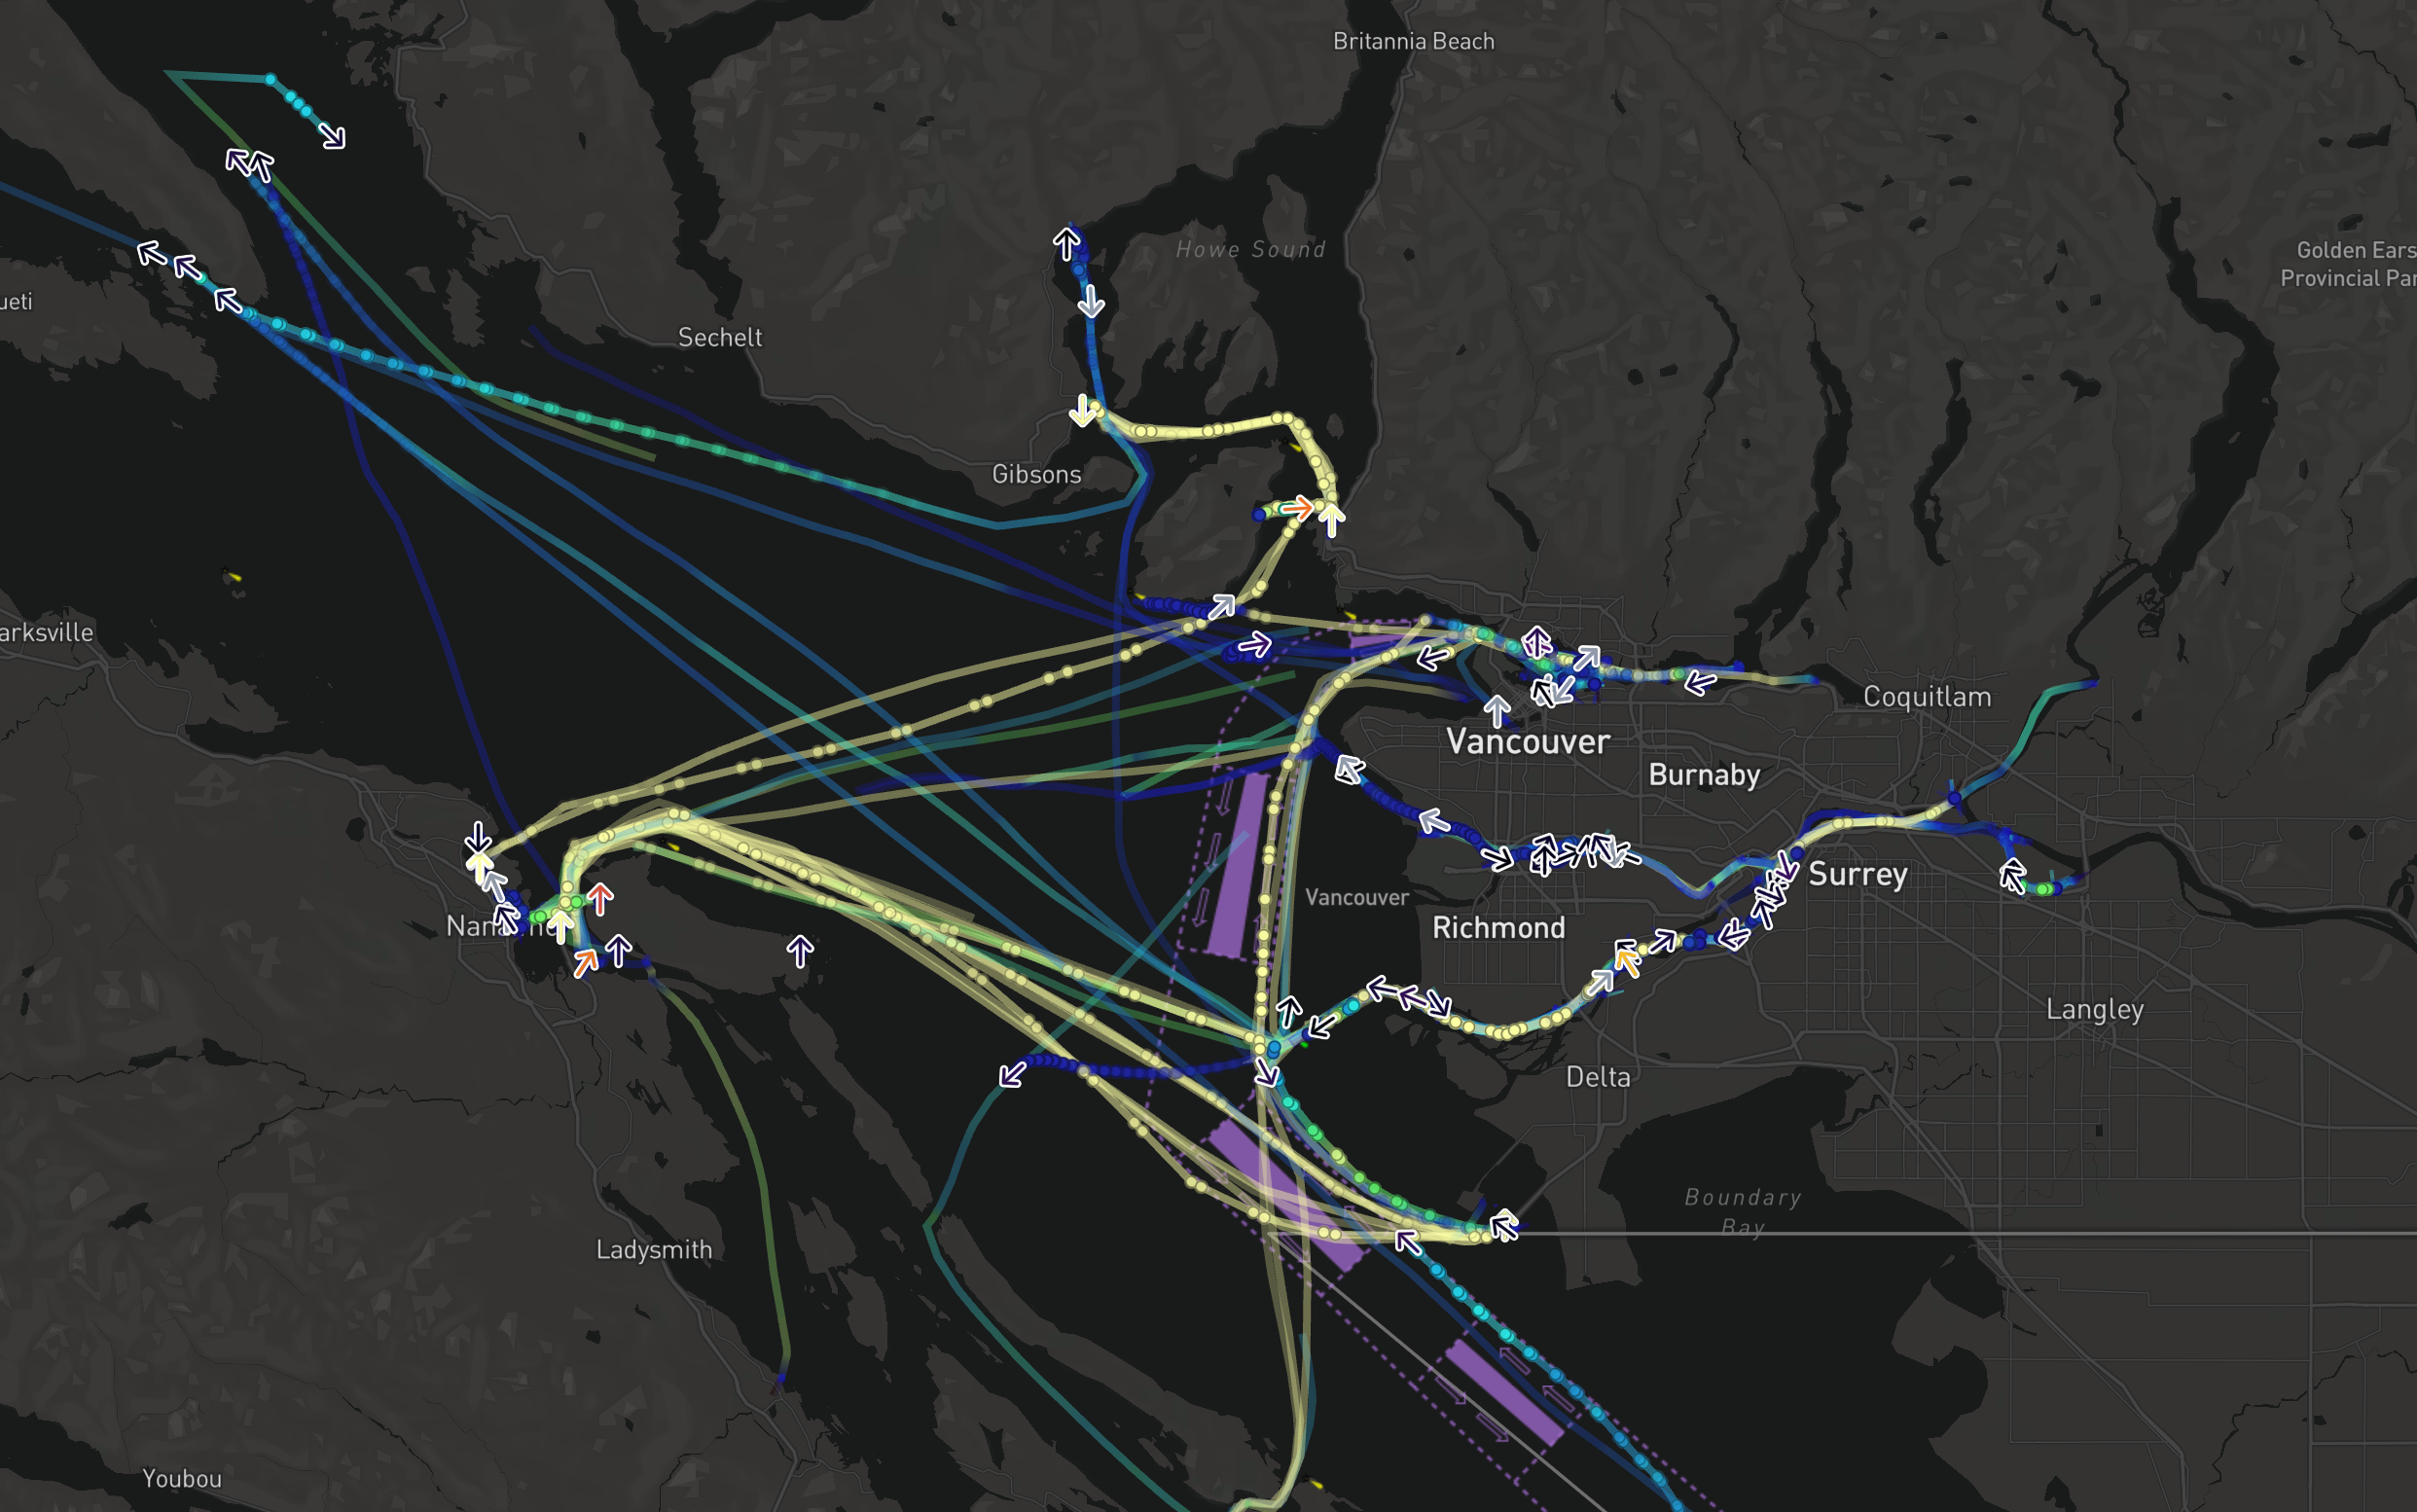
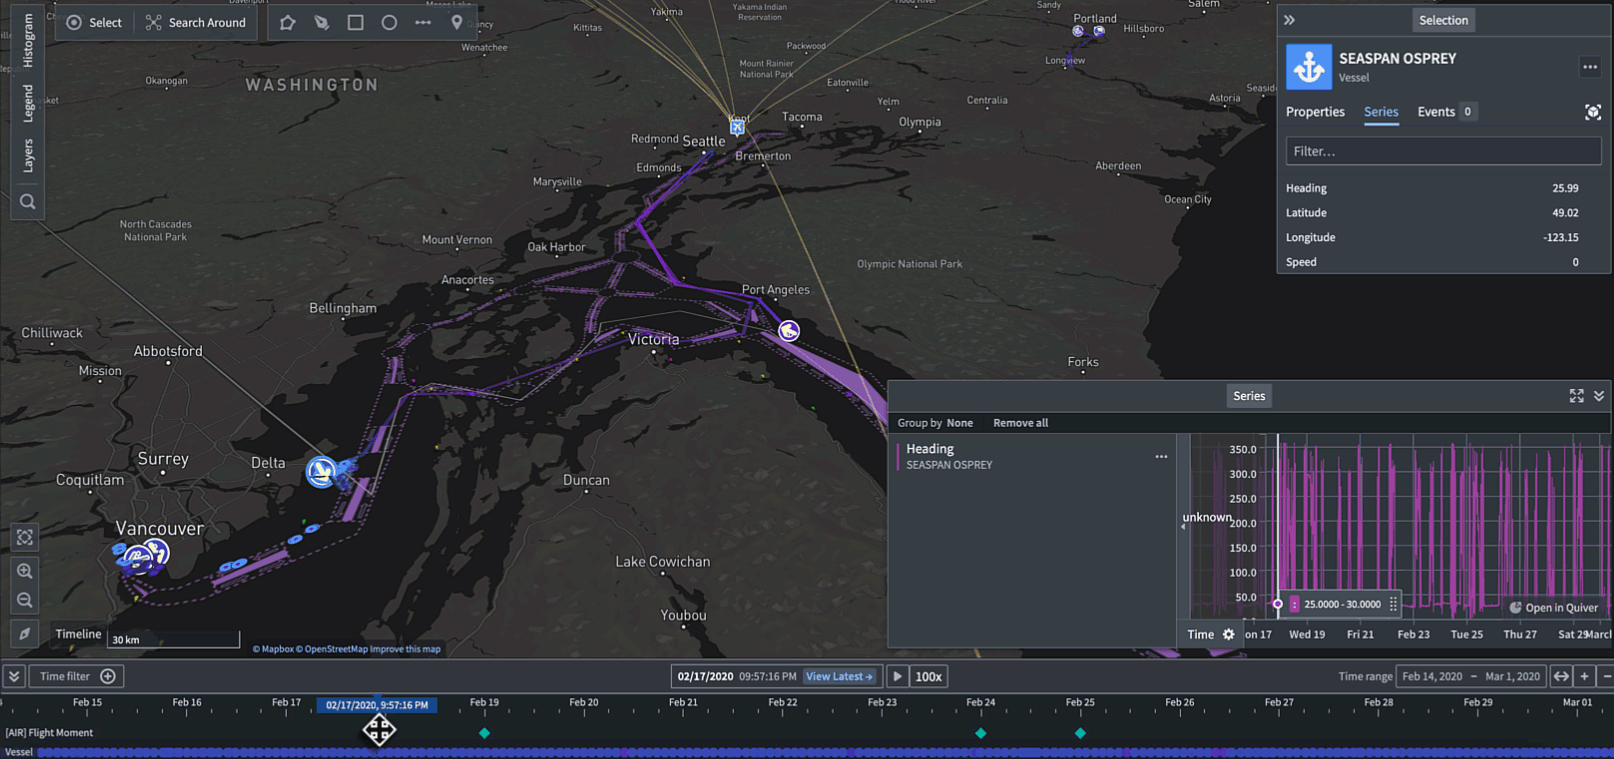
Tracks
Use tracks to represent objects that have a position which changes over time. The track styling options let you customize how you visualize the positions of an object over time.
Selected time and time range
All temporal data shown on a map respects the current selected time and time range, enabling you to see how your data changes over time and to inspect specific times in the past.
Select View latest to launch the Latest Data view, where the selected time will automatically update to match the current time. Use the Latest Data view in combination with streaming data to visualize data on your map that updates in real time.
You can view the map's selected time and time range in the timeline.
For example, depending on the selected time, the color of time-based styling will vary.
:::callout{theme="neutral"} The select time and time range will affect the way data is shown on the map even if the timeline is not open. :::
Adjust the selected time, time range, and filtered time window
Use the timeline to adjust the:
中文翻译
地图中的时间与时态数据
地图提供了一系列用于可视化和处理随时间变化的数据的功能。时态数据有多种形式,每种形式都可以通过不同方式使用和可视化。
地图上可用的基于时间的数据类型
时间序列(Time series)
时间序列是指随时间变化的测量值。您可以在本体(Ontology)中将时间序列值配置为时间序列属性。使用时间序列可以为地图上的对象设置样式,并在时间轴中查看它们。
事件(Events)
事件对象是包含额外元数据的对象,这些元数据将对象与特定时间或时间范围关联起来。事件对象可用于控制地图上对象的不透明度,并在时间轴中进行可视化。
轨迹(Tracks)
使用轨迹来表示位置随时间变化的对象。轨迹样式选项允许您自定义对象随时间变化的位置可视化方式。
选定时间与时间范围
地图上显示的所有时态数据都会遵循当前选定的时间和时间范围,使您能够查看数据随时间的变化情况,并检查过去的特定时间点。
选择查看最新数据(View latest)可启动最新数据(Latest Data)视图,其中选定的时间将自动更新以匹配当前时间。将最新数据视图与流式数据结合使用,可以在地图上可视化实时更新的数据。
您可以在时间轴中查看地图的选定时间和时间范围。
例如,根据选定的时间不同,基于时间的样式颜色也会发生变化。
:::callout{theme="neutral"} 即使时间轴未打开,选定的时间和时间范围也会影响数据在地图上的显示方式。 :::
调整选定时间、时间范围和过滤时间窗口
使用时间轴可以调整: