Time series(时间序列)
Time series are measured values that change over time. You can configure time series values in the Ontology as time series properties. The map contains features to help you view and analyze time series data that is associated with geospatial objects.
Explore related time series
Select an object on your map that has associated time series data. You can see any related time series in the Series tab of the selection panel. The value shown next to a series reflects the value of the series at the current selected time.
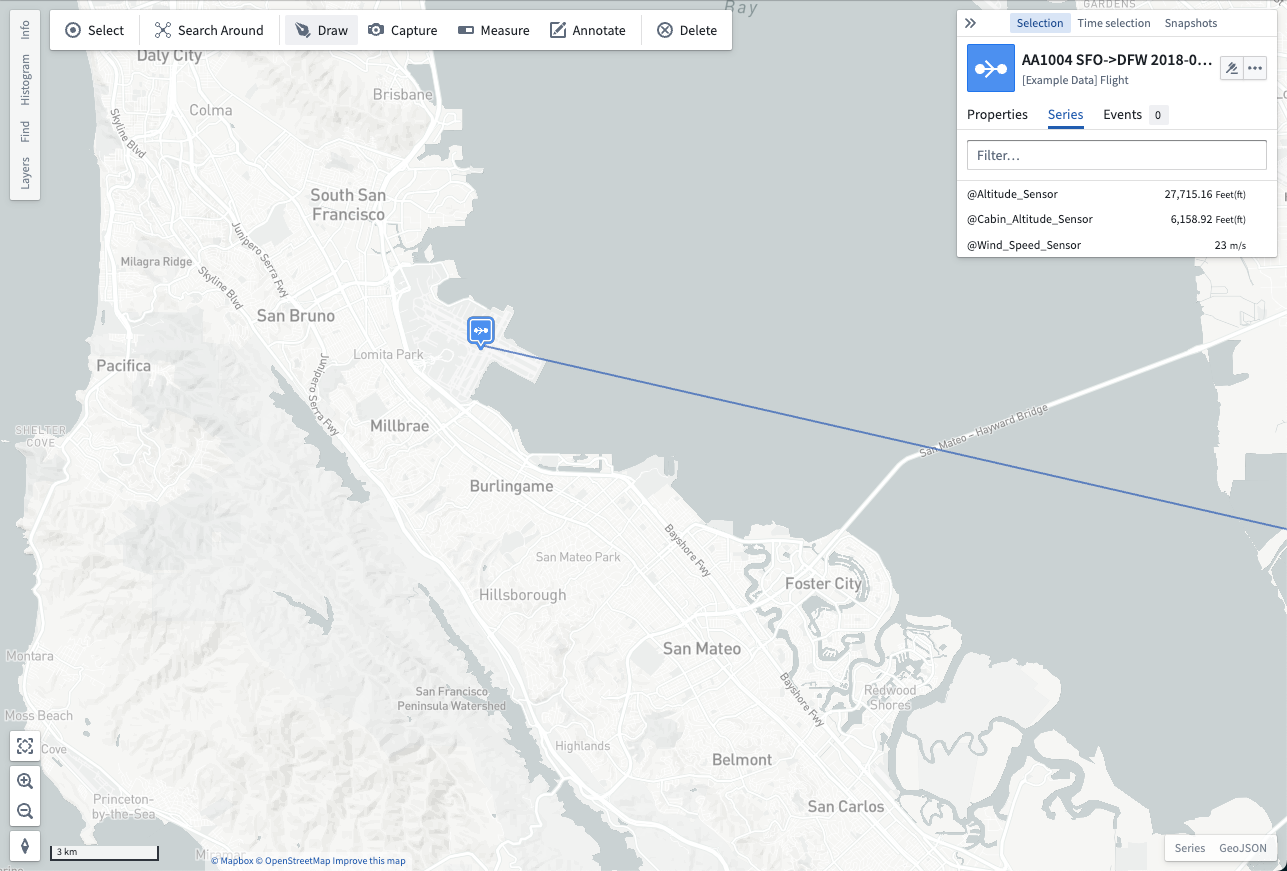
You can also add a time series explicitly to the series-panel by right-clicking an object and selecting Add series to series view. Additionally, you can select an object to render the Selection panel before navigating to the Series tab. From the Series tab, select the ellipsis icon that appears when hovering over a series row to open a menu that contains additional actions related to the time series where you can select Add to series view.
| Right-click to add a time series | Use the Selection panel to add a time series |
|---|---|
 |
 |
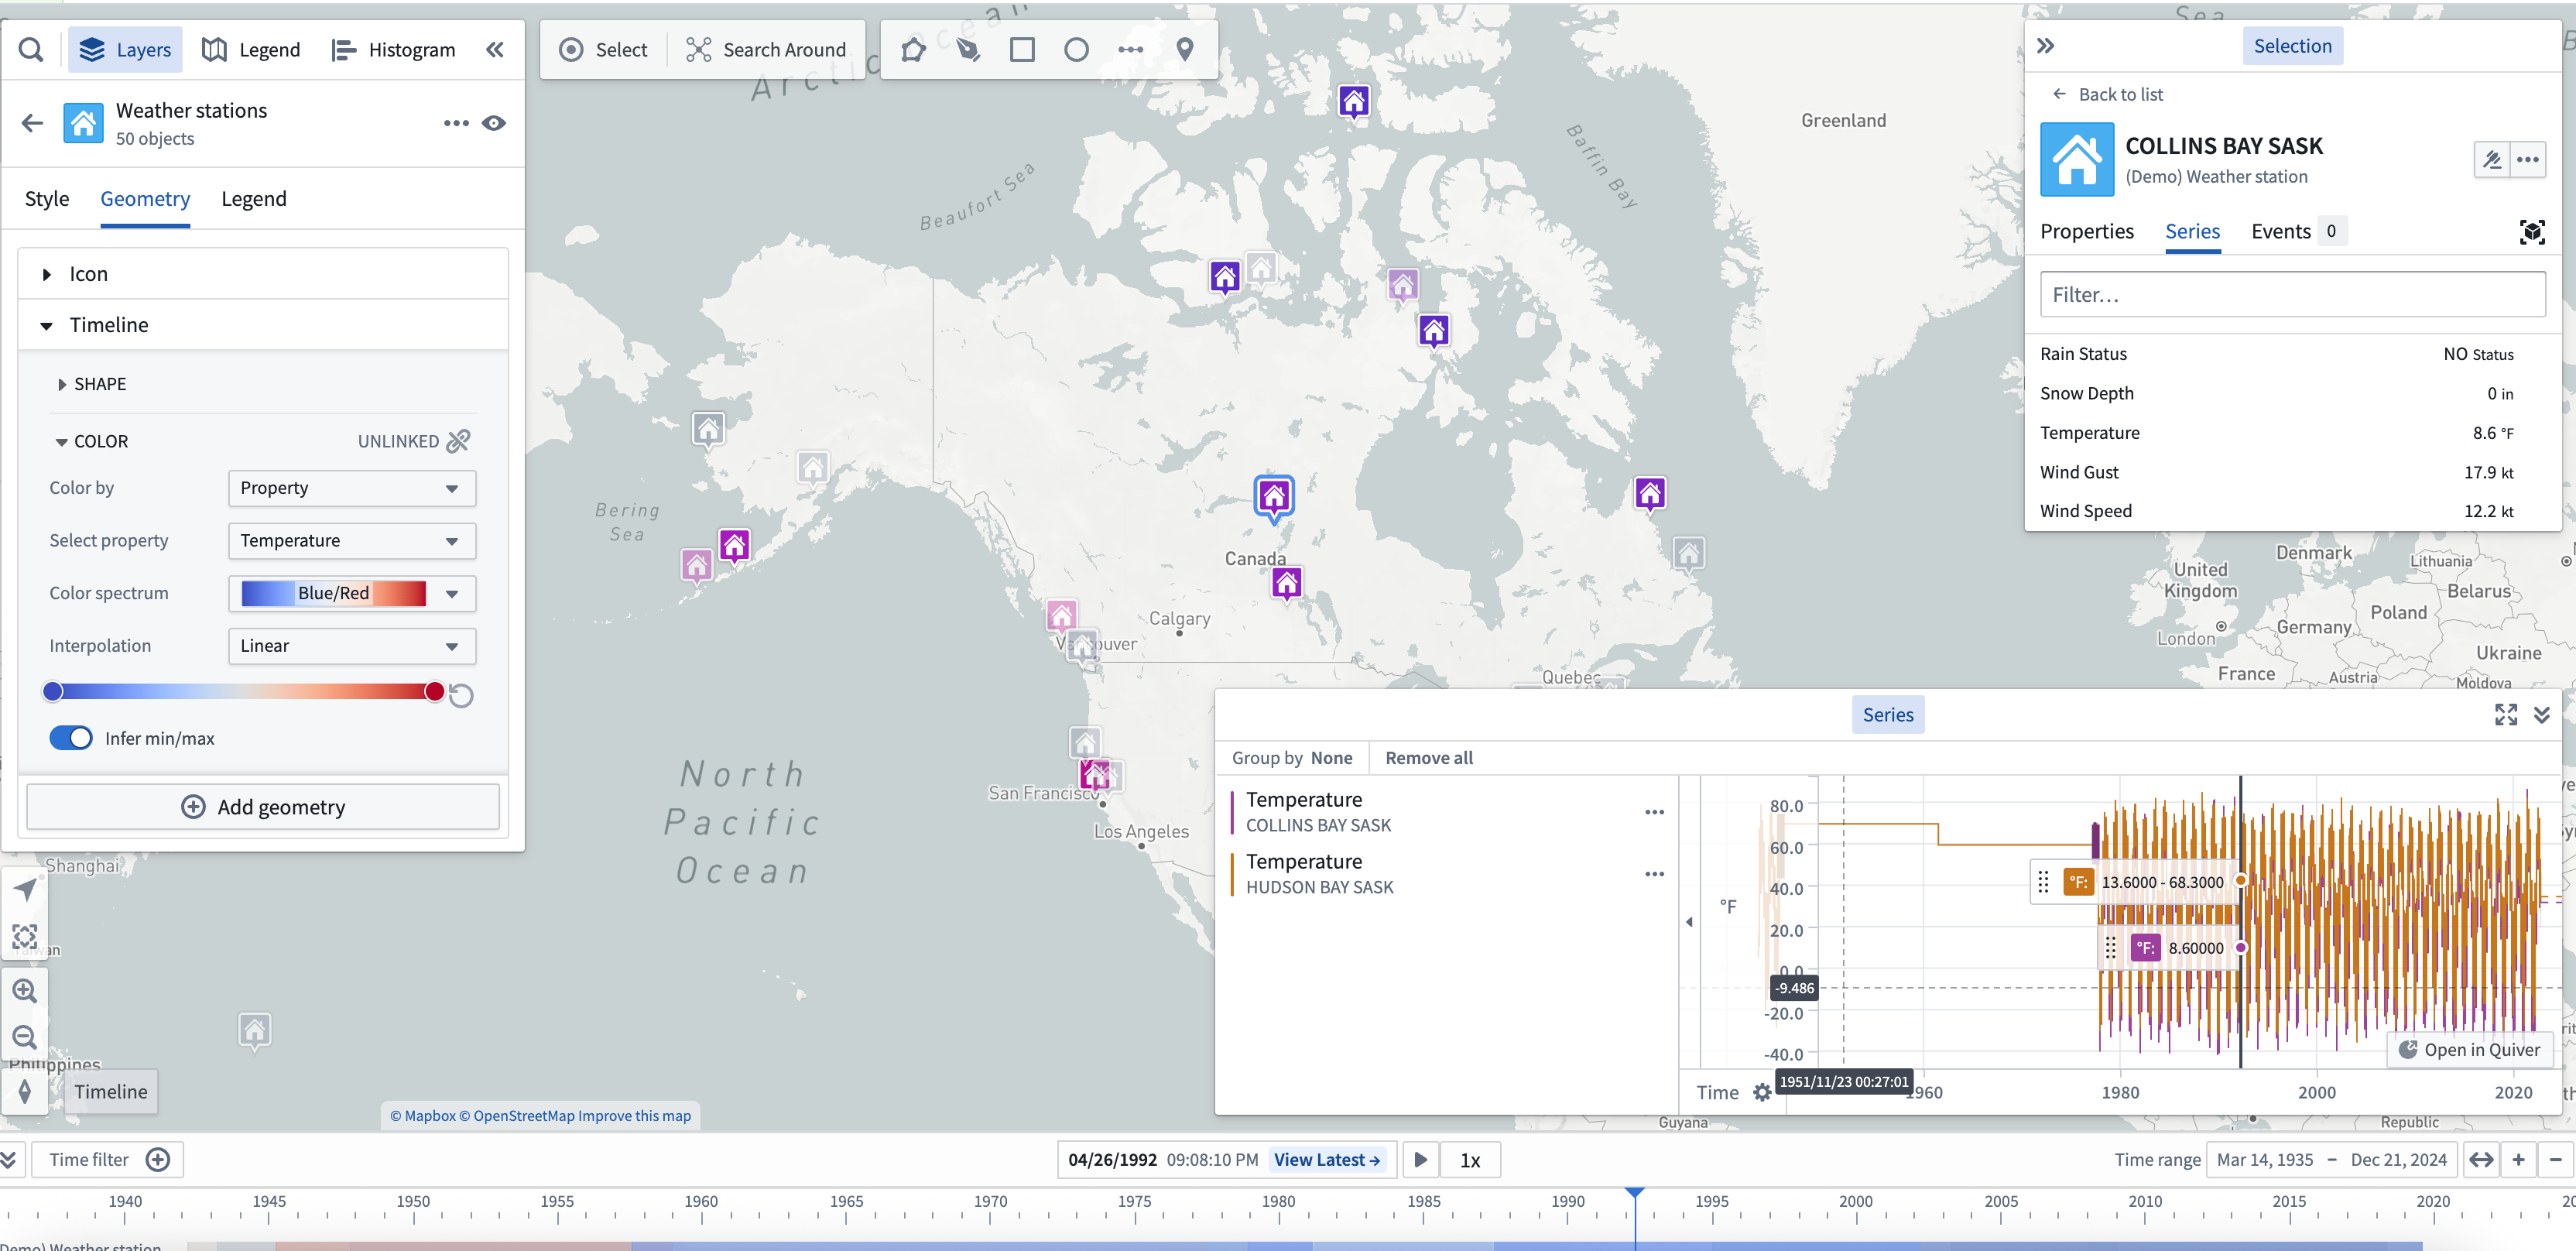
When you add a time series to the timeline, a visualization of the series over time will appear at the bottom of the map. You can use the timeline to examine the series and access more time series actions from its entry on the timeline legend.
Use time series for styling
When objects on your map have associated time series data, you can color the objects by an associated time series. Use this to make your map responsive to the current time selection and help you understand how your data is changing over time. Read more about using time series for value-based styling.
Interact with time series in the timeline [Beta]
:::callout{theme="neutral" title="Beta"} Interacting with a time series in the Map timeline is in the beta phase of development and may not be available on your enrollment. Functionality may change during active development. Contact Palantir Support to request access to this feature. :::
You can add a time series to your map's timeline in two ways:
- Right-click menu: Right-click an object on your map and select Add series to the timeline before choosing a series from the menu.
- Selection panel: Select an object on your map, open the Selection panel, and navigate to the Series tab. Next, select the … that appears when hovering over a series row to open a menu that contains additional actions related to the selected time series before choosing Add to timeline.
Once you add a time series to the timeline, you can configure its rendered styles and optionally toggle its visibility using the timeline legend.
中文翻译
时间序列
时间序列(Time series)是随时间变化的测量值。您可以在本体论(Ontology)中将时间序列值配置为时间序列属性(Time series properties)。地图中包含多种功能,可帮助您查看和分析与地理空间对象关联的时间序列数据。
探索相关时间序列
在地图上选择具有关联时间序列数据的对象。您可以在选择面板的序列(Series)选项卡中查看任何相关的时间序列。序列旁边显示的值反映了该序列在当前选定时间(Selected time)的值。
您还可以通过右键单击对象并选择将序列添加到序列视图(Add series to series view),将时间序列(Time series)显式添加到序列面板。此外,您可以选择一个对象以渲染选择(Selection)面板,然后导航到序列(Series)选项卡。在序列(Series)选项卡中,选择悬停在序列行上时出现的省略号图标,打开包含与时间序列相关的其他操作的菜单,然后选择添加到序列视图(Add to series view)。
| 右键单击添加时间序列 | 使用**选择(Selection)**面板添加时间序列 |
|---|---|
|
|
当您将时间序列添加到时间轴时,序列随时间变化的可视化效果将显示在地图底部。您可以使用时间轴(Timeline)来检查序列,并通过时间轴图例上的条目访问更多时间序列操作。
使用时间序列进行样式设置
当地图上的对象具有关联的时间序列数据时,您可以根据关联的时间序列为对象着色。利用此功能,您可以使地图响应当前的时间选择(Time selection),并帮助您了解数据随时间的变化。了解更多关于使用时间序列进行基于值的样式设置(Value-based styling)的信息。
在时间轴中与时间序列交互 [Beta]
:::callout{theme="neutral" title="Beta"} 在地图时间轴中与时间序列交互功能处于Beta开发阶段,可能在您的环境中不可用。功能在活跃开发期间可能会发生变化。请联系Palantir支持以请求访问此功能。 :::
您可以通过两种方式将时间序列添加到地图的时间轴:
- 右键菜单: 右键单击地图上的对象,选择将序列添加到时间轴(Add series to the timeline),然后从菜单中选择一个序列。
- 选择面板: 选择地图上的一个对象,打开选择(Selection)面板,然后导航到序列(Series)选项卡。接下来,选择悬停在序列行上时出现的…,打开包含与所选时间序列相关的其他操作的菜单,然后选择添加到时间轴(Add to timeline)。
将时间序列添加到时间轴后,您可以使用时间轴图例配置其渲染样式,并可选择切换其可见性。