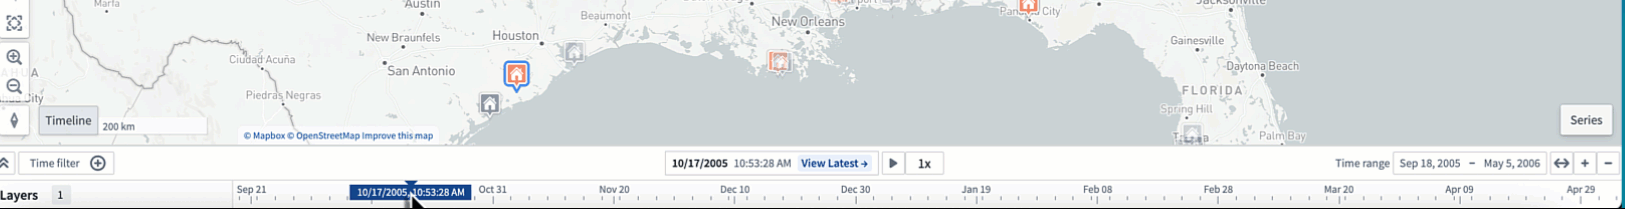
Timeline(时间轴(Timeline))
You can use the timeline to view time-based data as well as configure the time window and selected time. You can set the selected time and time range, further inspect the time-based properties of objects, and filter to specific objects in a given time range.
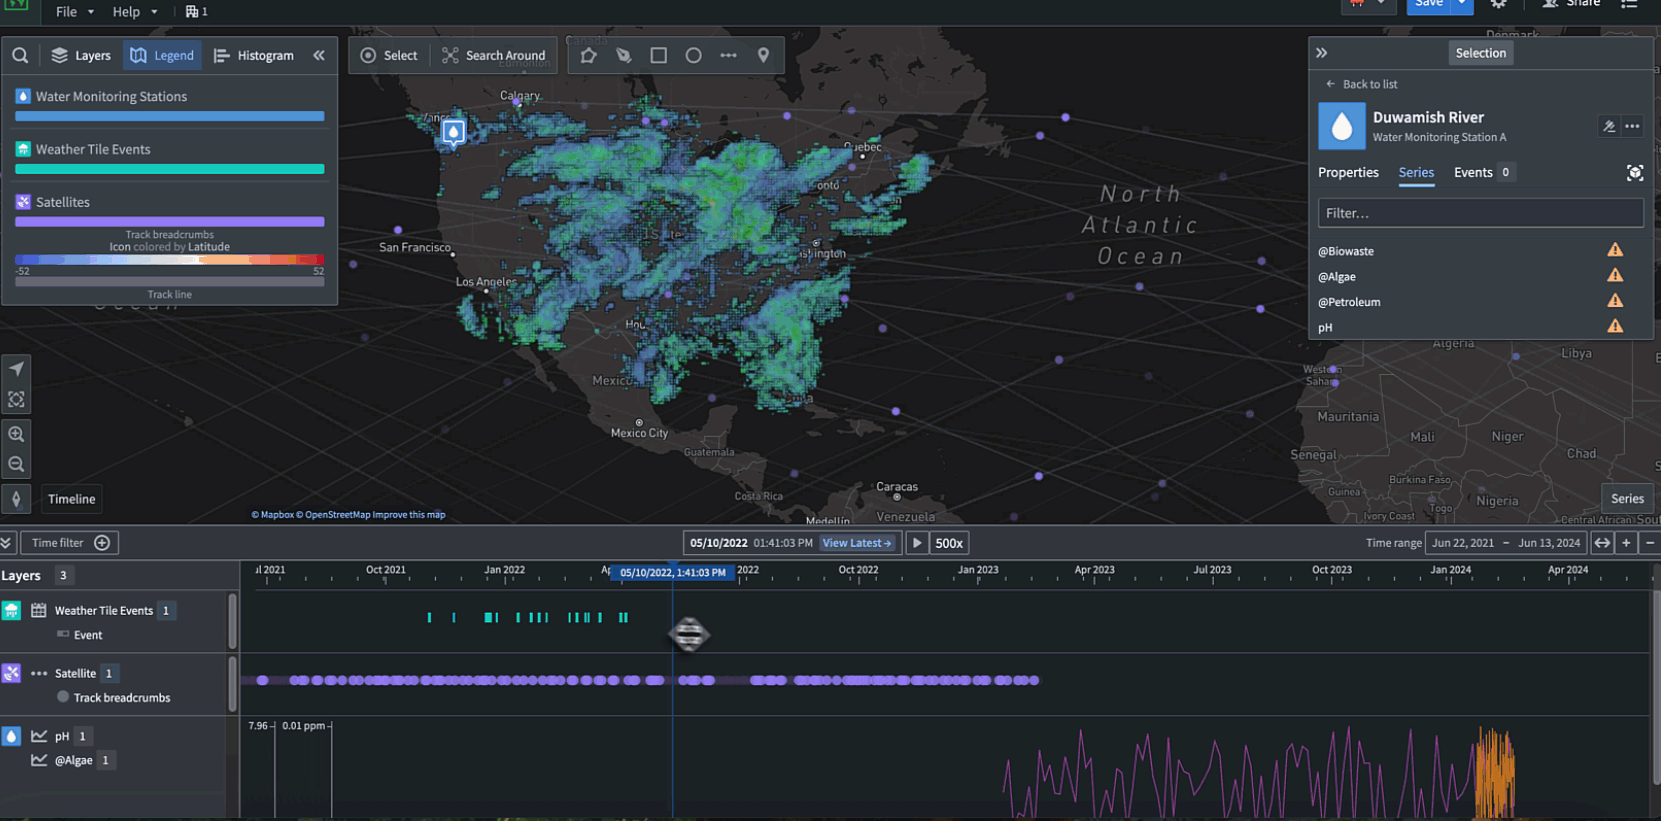
The timeline can be used to view events, such as event objects and timeline geometries, track breadcrumbs, and time series.
Even when the timeline is not open, the timeline's time range and selected time can affect any time-based data that is visible on the map.
Basic controls
Open and enable the timeline
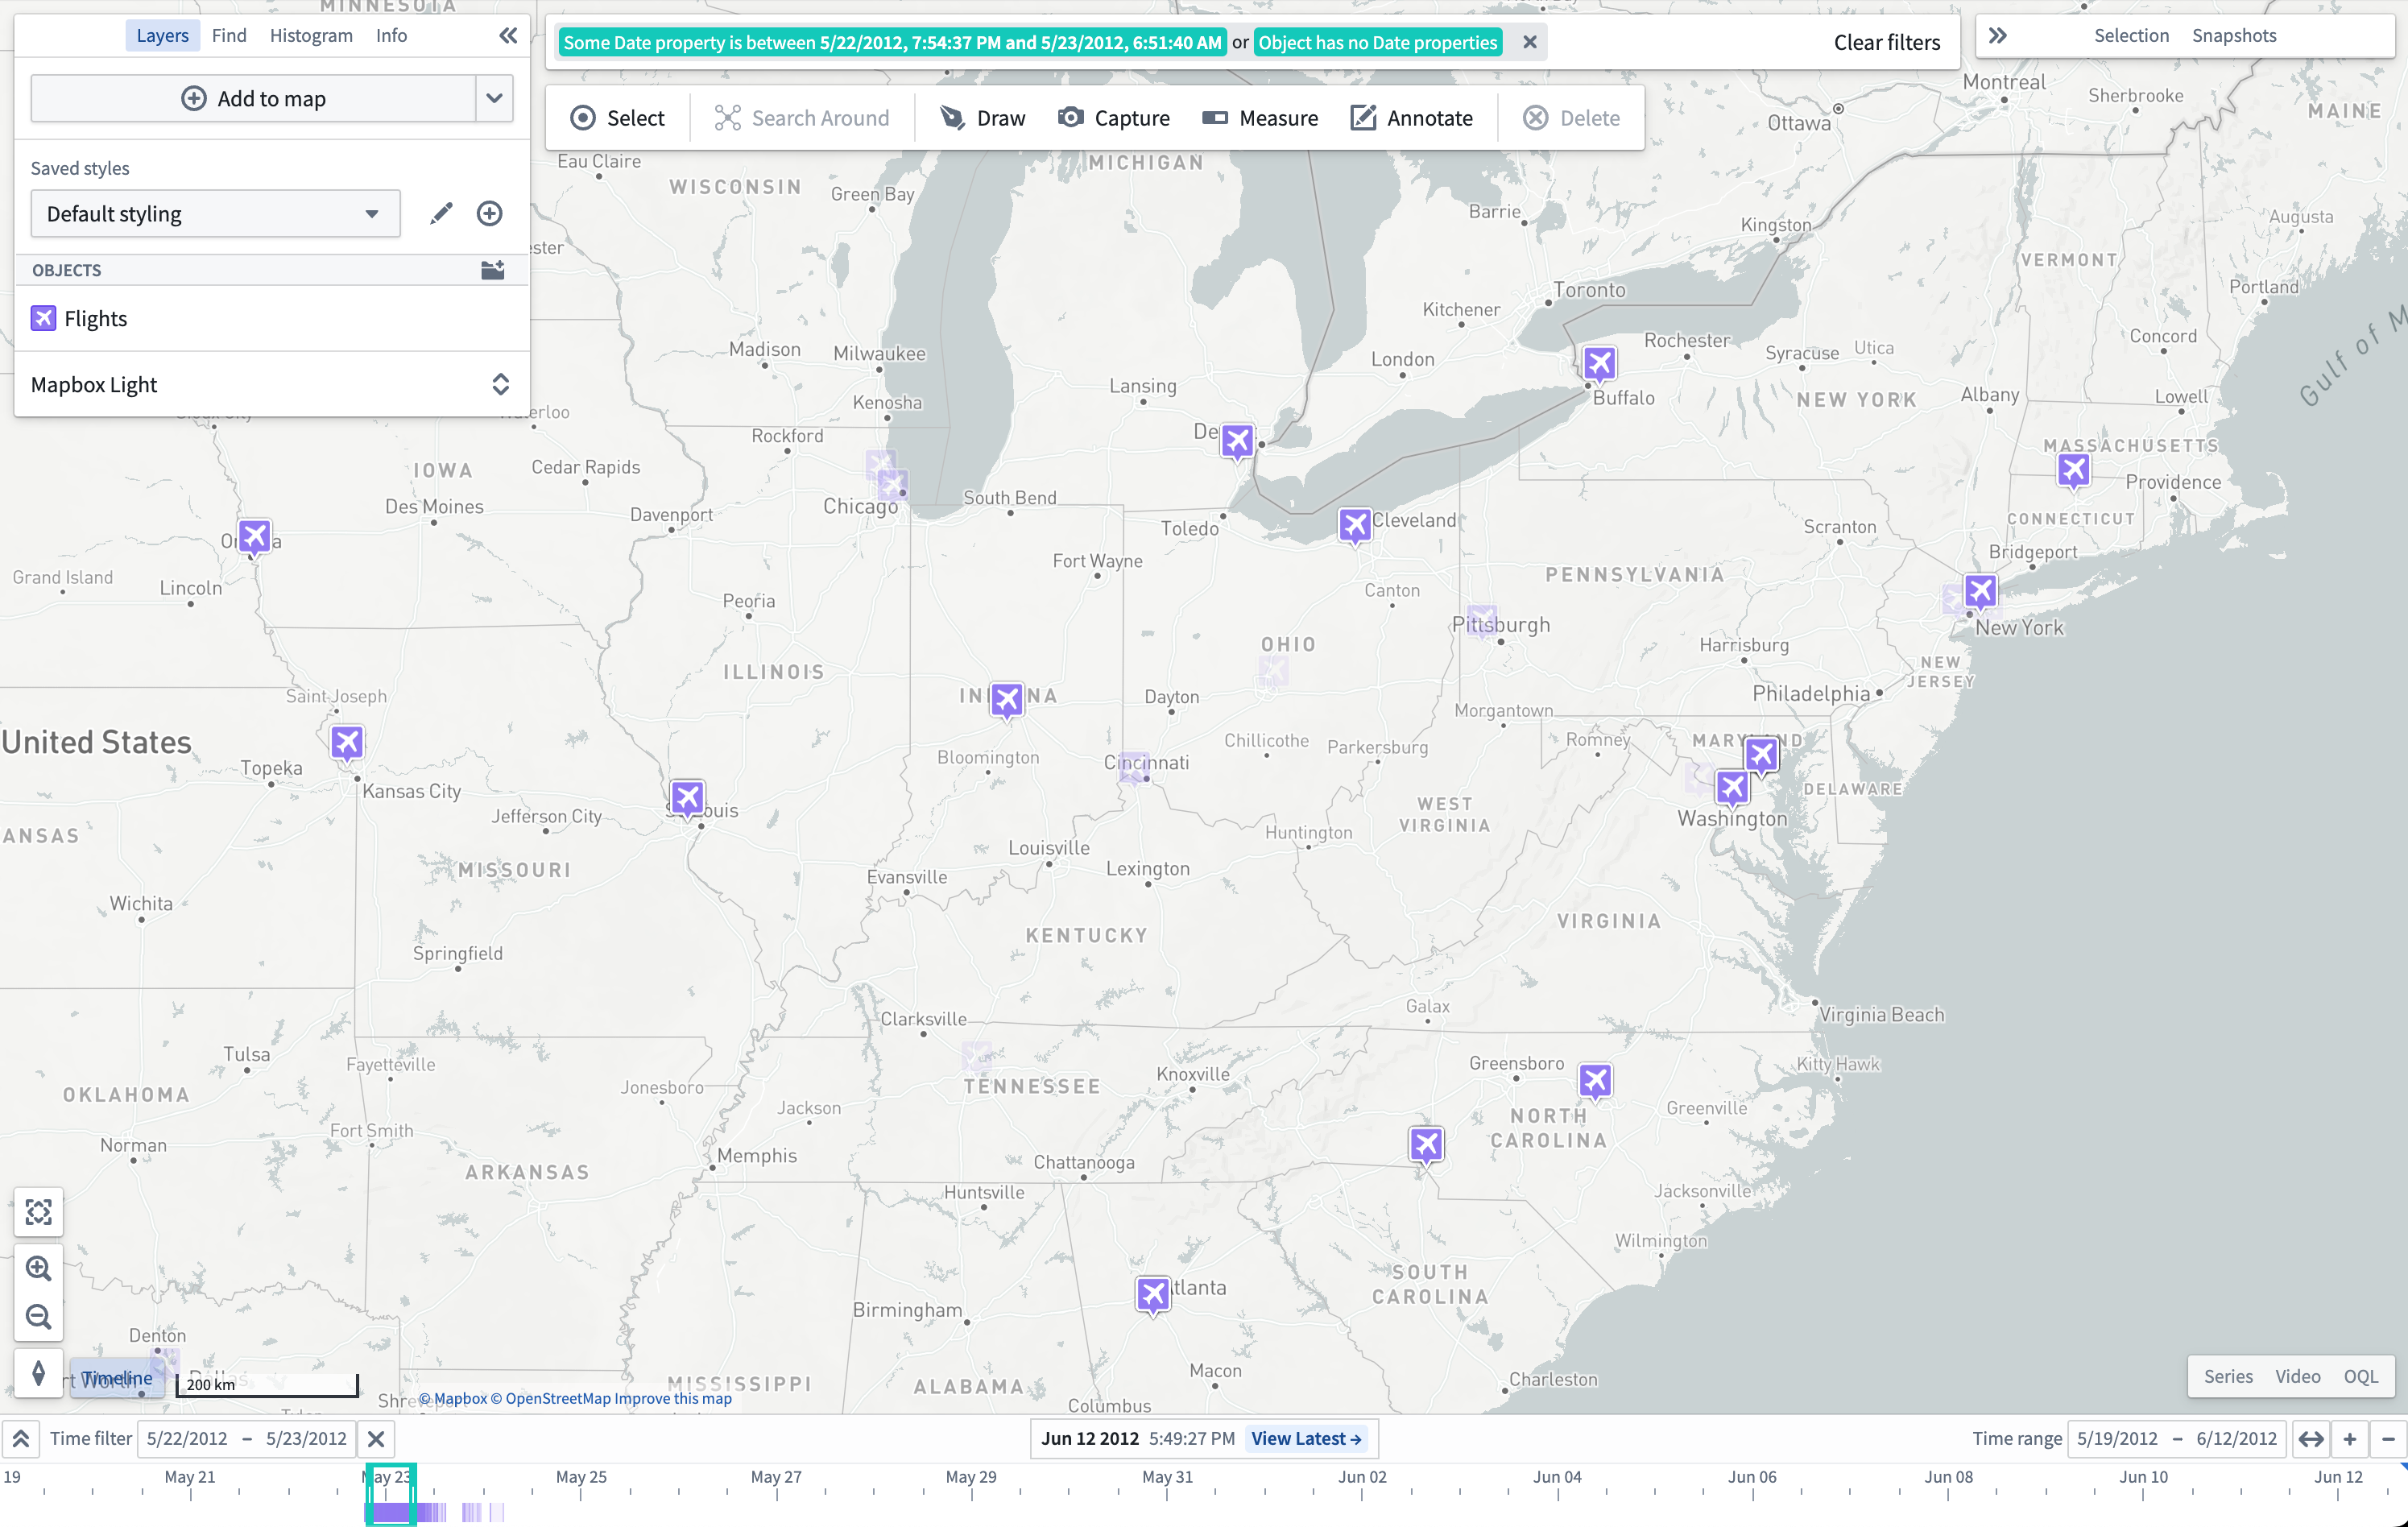
Select Timeline in the lower-left of the map canvas to show or hide the timeline.
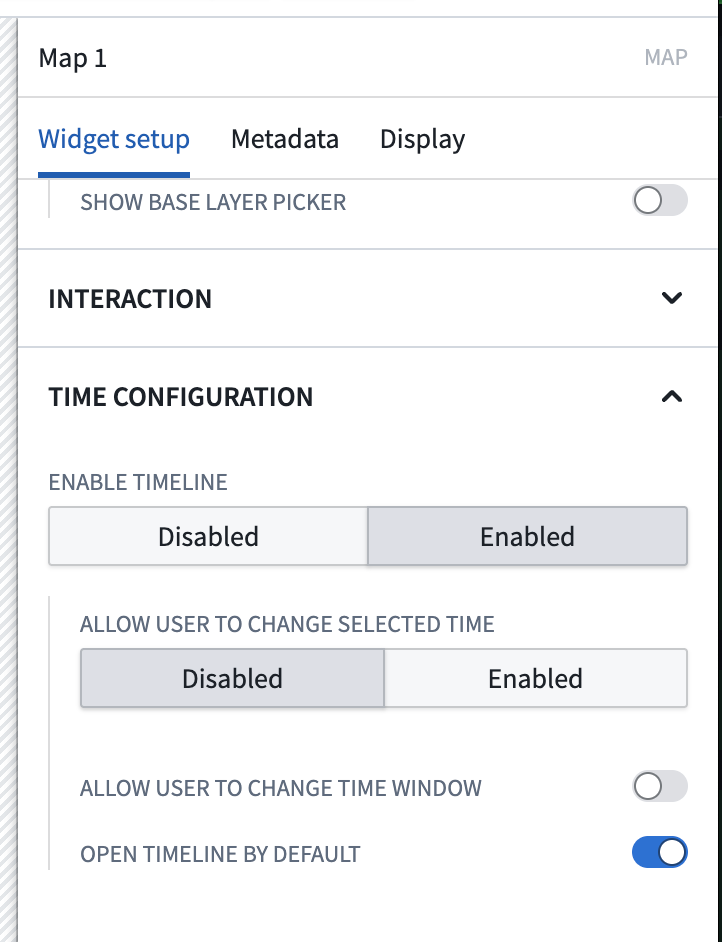
When embedding a map in Workshop using the Map widget, you can configure the timeline to open by default.
Adjust the selected time
The cursor position on the timeline represents the map's selected time. You can adjust the selected time by:
- Double-clicking or right-clicking on the timeline.
- Dragging the cursor to a new position.
- Selecting the date or timestamp in the middle of the timeline header to render a date and time picker.
To get a more specific date for the cursor, you can click the cursor form to input a specific date and time.
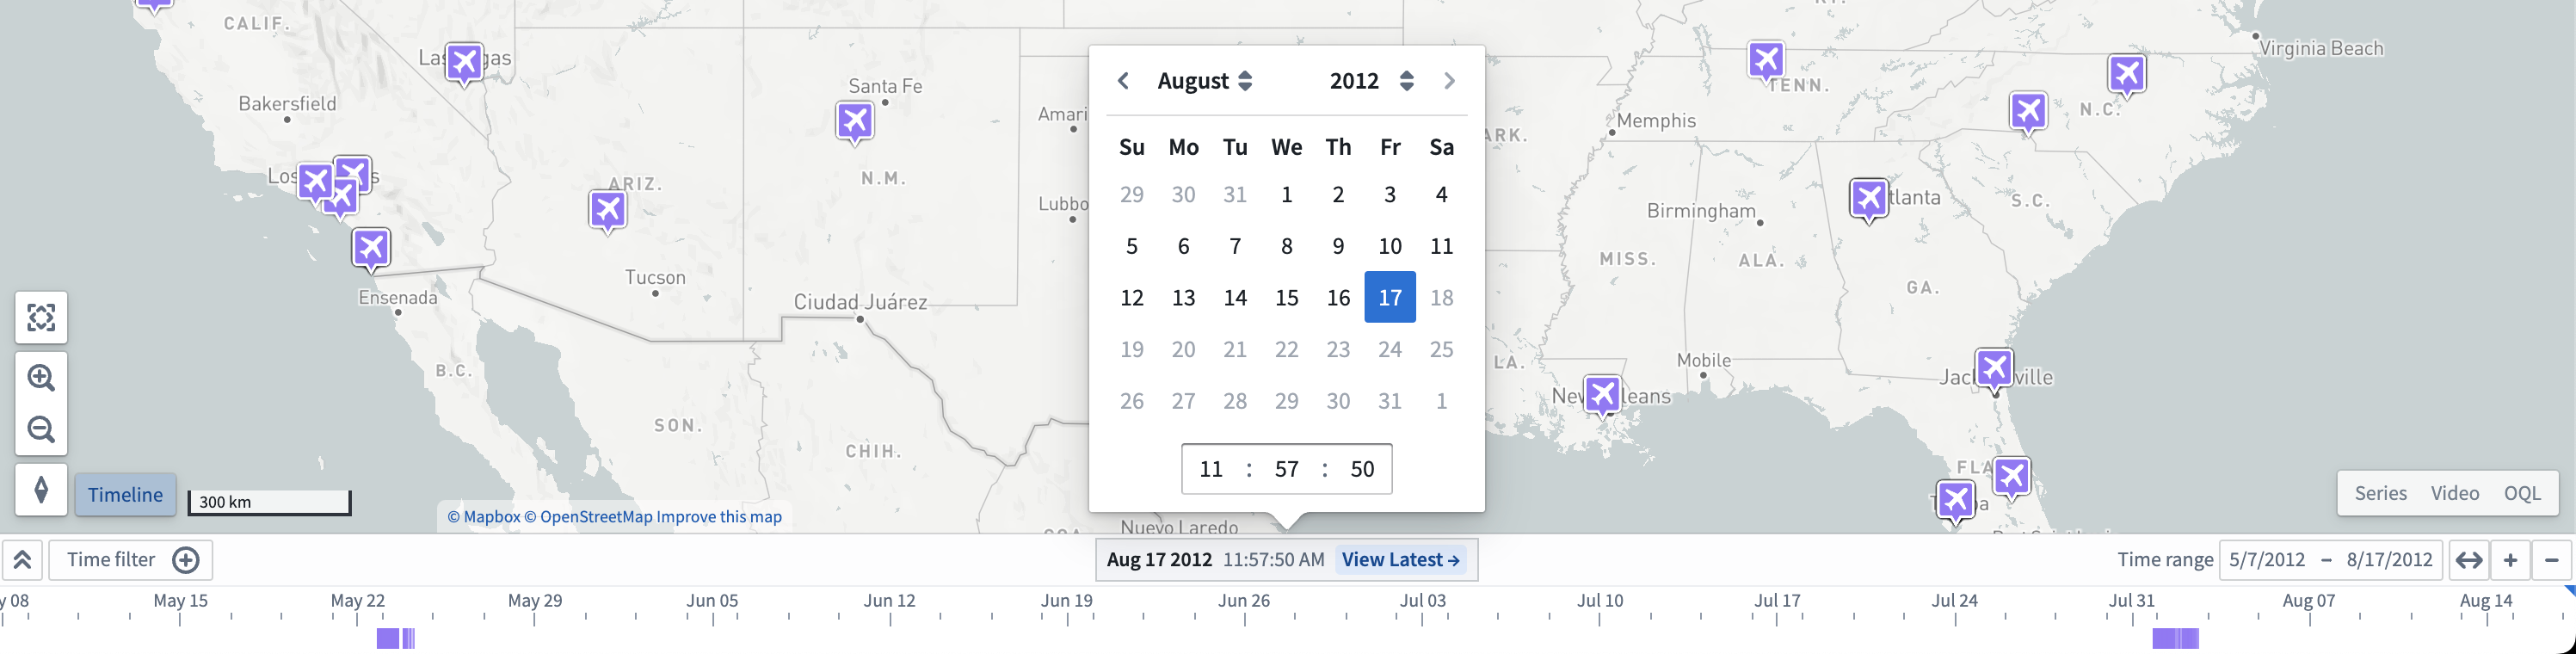
Select View latest to set the selected time to the current time. When on the Latest Data view, the selected time will automatically update to match the current time. Use Latest Data mode in combination with streaming data to visualize data on your map that updates in real time.
:::callout{theme="neutral"} When using the date and time selector, you can only select a time that lies within your object layer's current time range. :::
You can configure the default time selection and polling interval when in View latest mode for time series for all maps in Control Panel. Additionally, you can configure per-map polling interval, time zone, and time format in the settings panel.
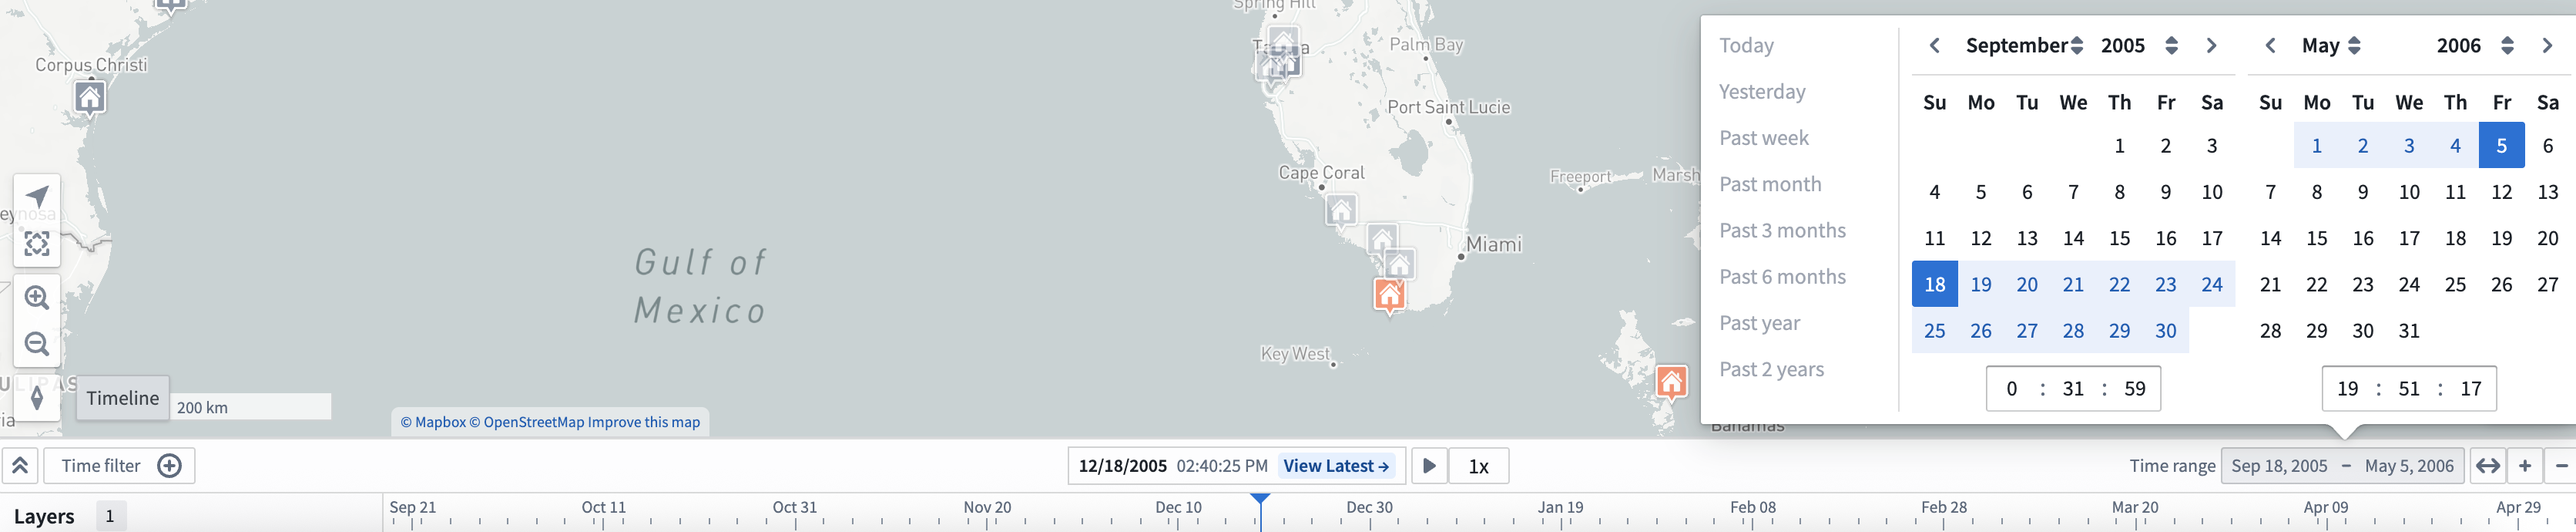
Adjust the time range
You can view the time range in the top right header of the timeline as well as from the start and end time of the timeline's view. You can adjust the time range with a mouse or trackpad by following the guidelines below.
Scroll controls:
- Use your mouse's scroll wheel to zoom in our out on the timeline, and press
Cmd(macOS)/Ctrl(Windows) before scrolling to pan the time range. - Use your trackpad to zoom in our out on the timeline by vertically swiping or pinching in or out.
Select Time range in the top right ribbon of the timeline header to input a specific date and time range for the timeline.
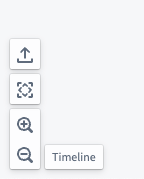
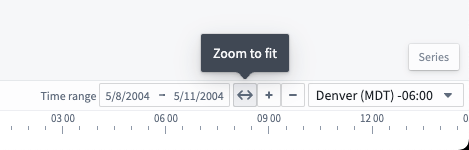
To get an automatic time window based on the data in the timeline, select the Zoom to fit button, marked by bidirectional arrows.
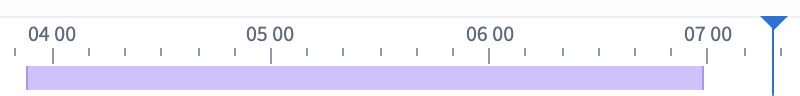
Filter the time window
You can filter events on a map by:
- Holding
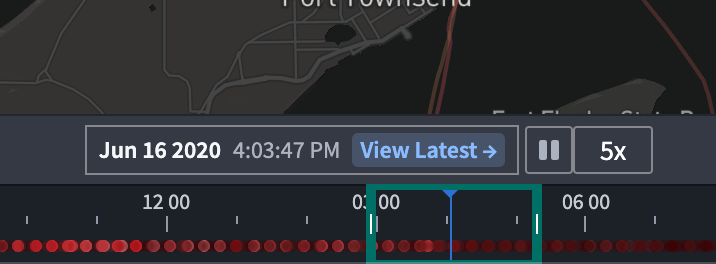
Shift, selecting a point in the timeline, and dragging your cursor on the timeline to create a time filter window. - Using the Time filter button in the control bar of the timeline.
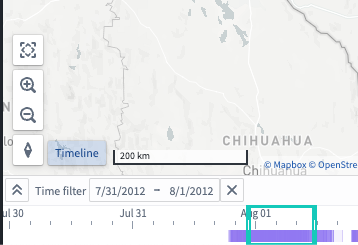
The Time filter is also available at the top of your map canvas. Objects on the map that match the filter are fully opaque, while objects that do not match the time filter are faded out.
Timeline playback
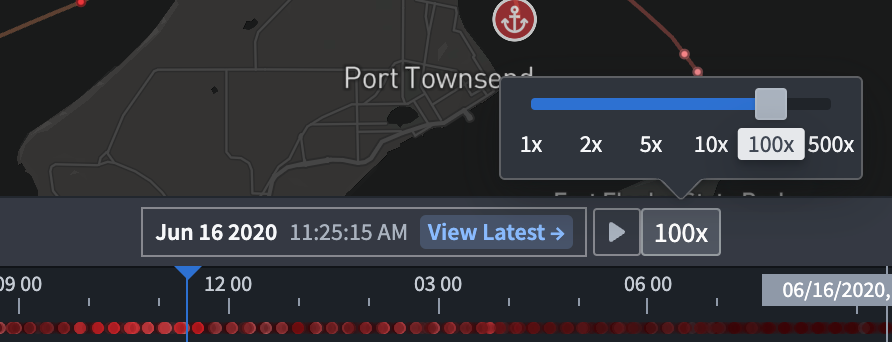
You can use the play button (⏵) to move the time cursor automatically; playback speed can be adjusted with the speed presets (1x, 2x, 5x, 10x, 100x, and so on).
The cursor will loop automatically through the time window on the timeline or a time filter if it exists.
Expand the timeline
When the timeline is collapsed, data added to the timeline is not visible. However, you can still change the time range, filtered time window, and selected time.
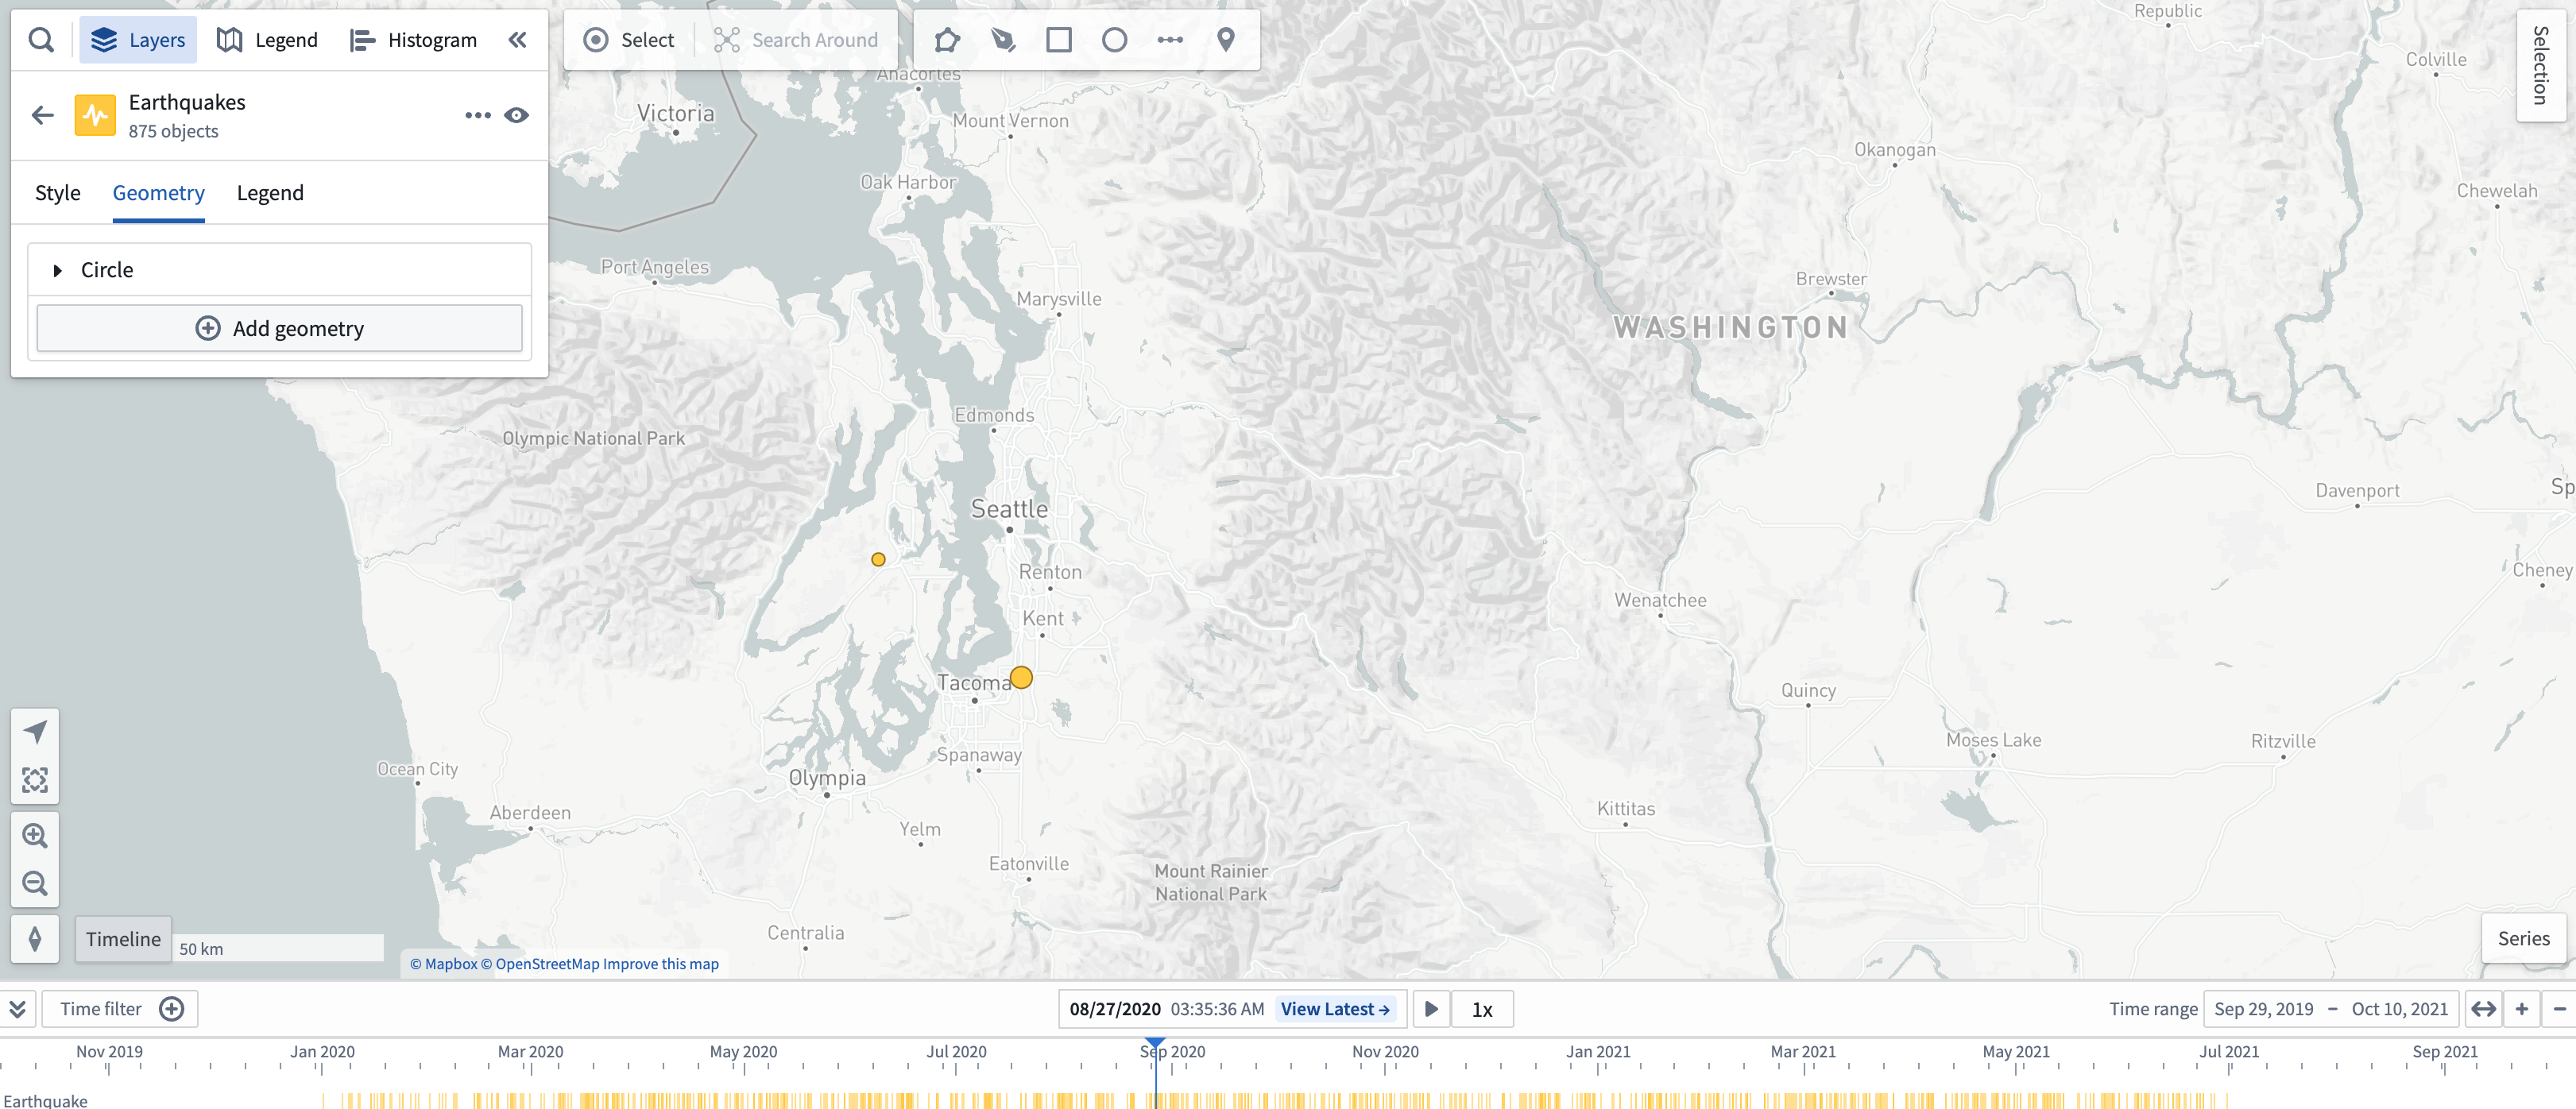
To show each object type on its own timeline row, select the Expand (![]() ) in the control bar of the timeline.
) in the control bar of the timeline.
Add data to the timeline
All data added to the timeline is grouped by object type.
Events
Event objects
Event objects will automatically add an event layer to the timeline.
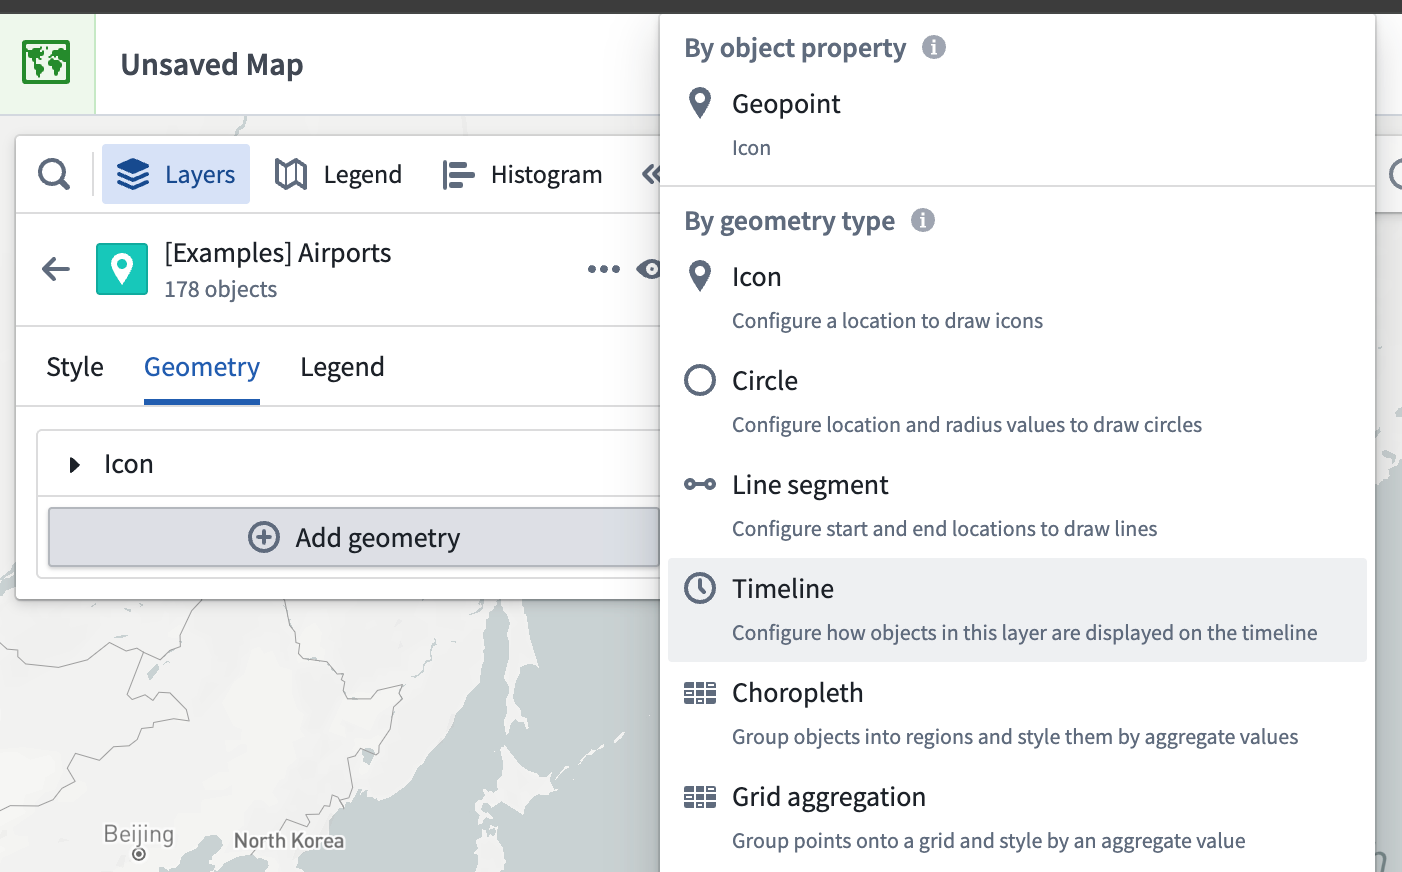
Timeline geometries
To make a new timeline event geometry layer appear on the timeline, add a timeline geometry from the Layers panel. Learn more about applying custom styling to timeline geometries.
Track breadcrumbs
Tracks with a breadcrumb geometry also render on the timeline depending on the time range and the map viewport.
You can animate the paths of objects on their track by moving the selected time to other points.
To make a new track breadcrumbs layer render on the timeline, add a track breadcrumbs geometry from the Layers panel.
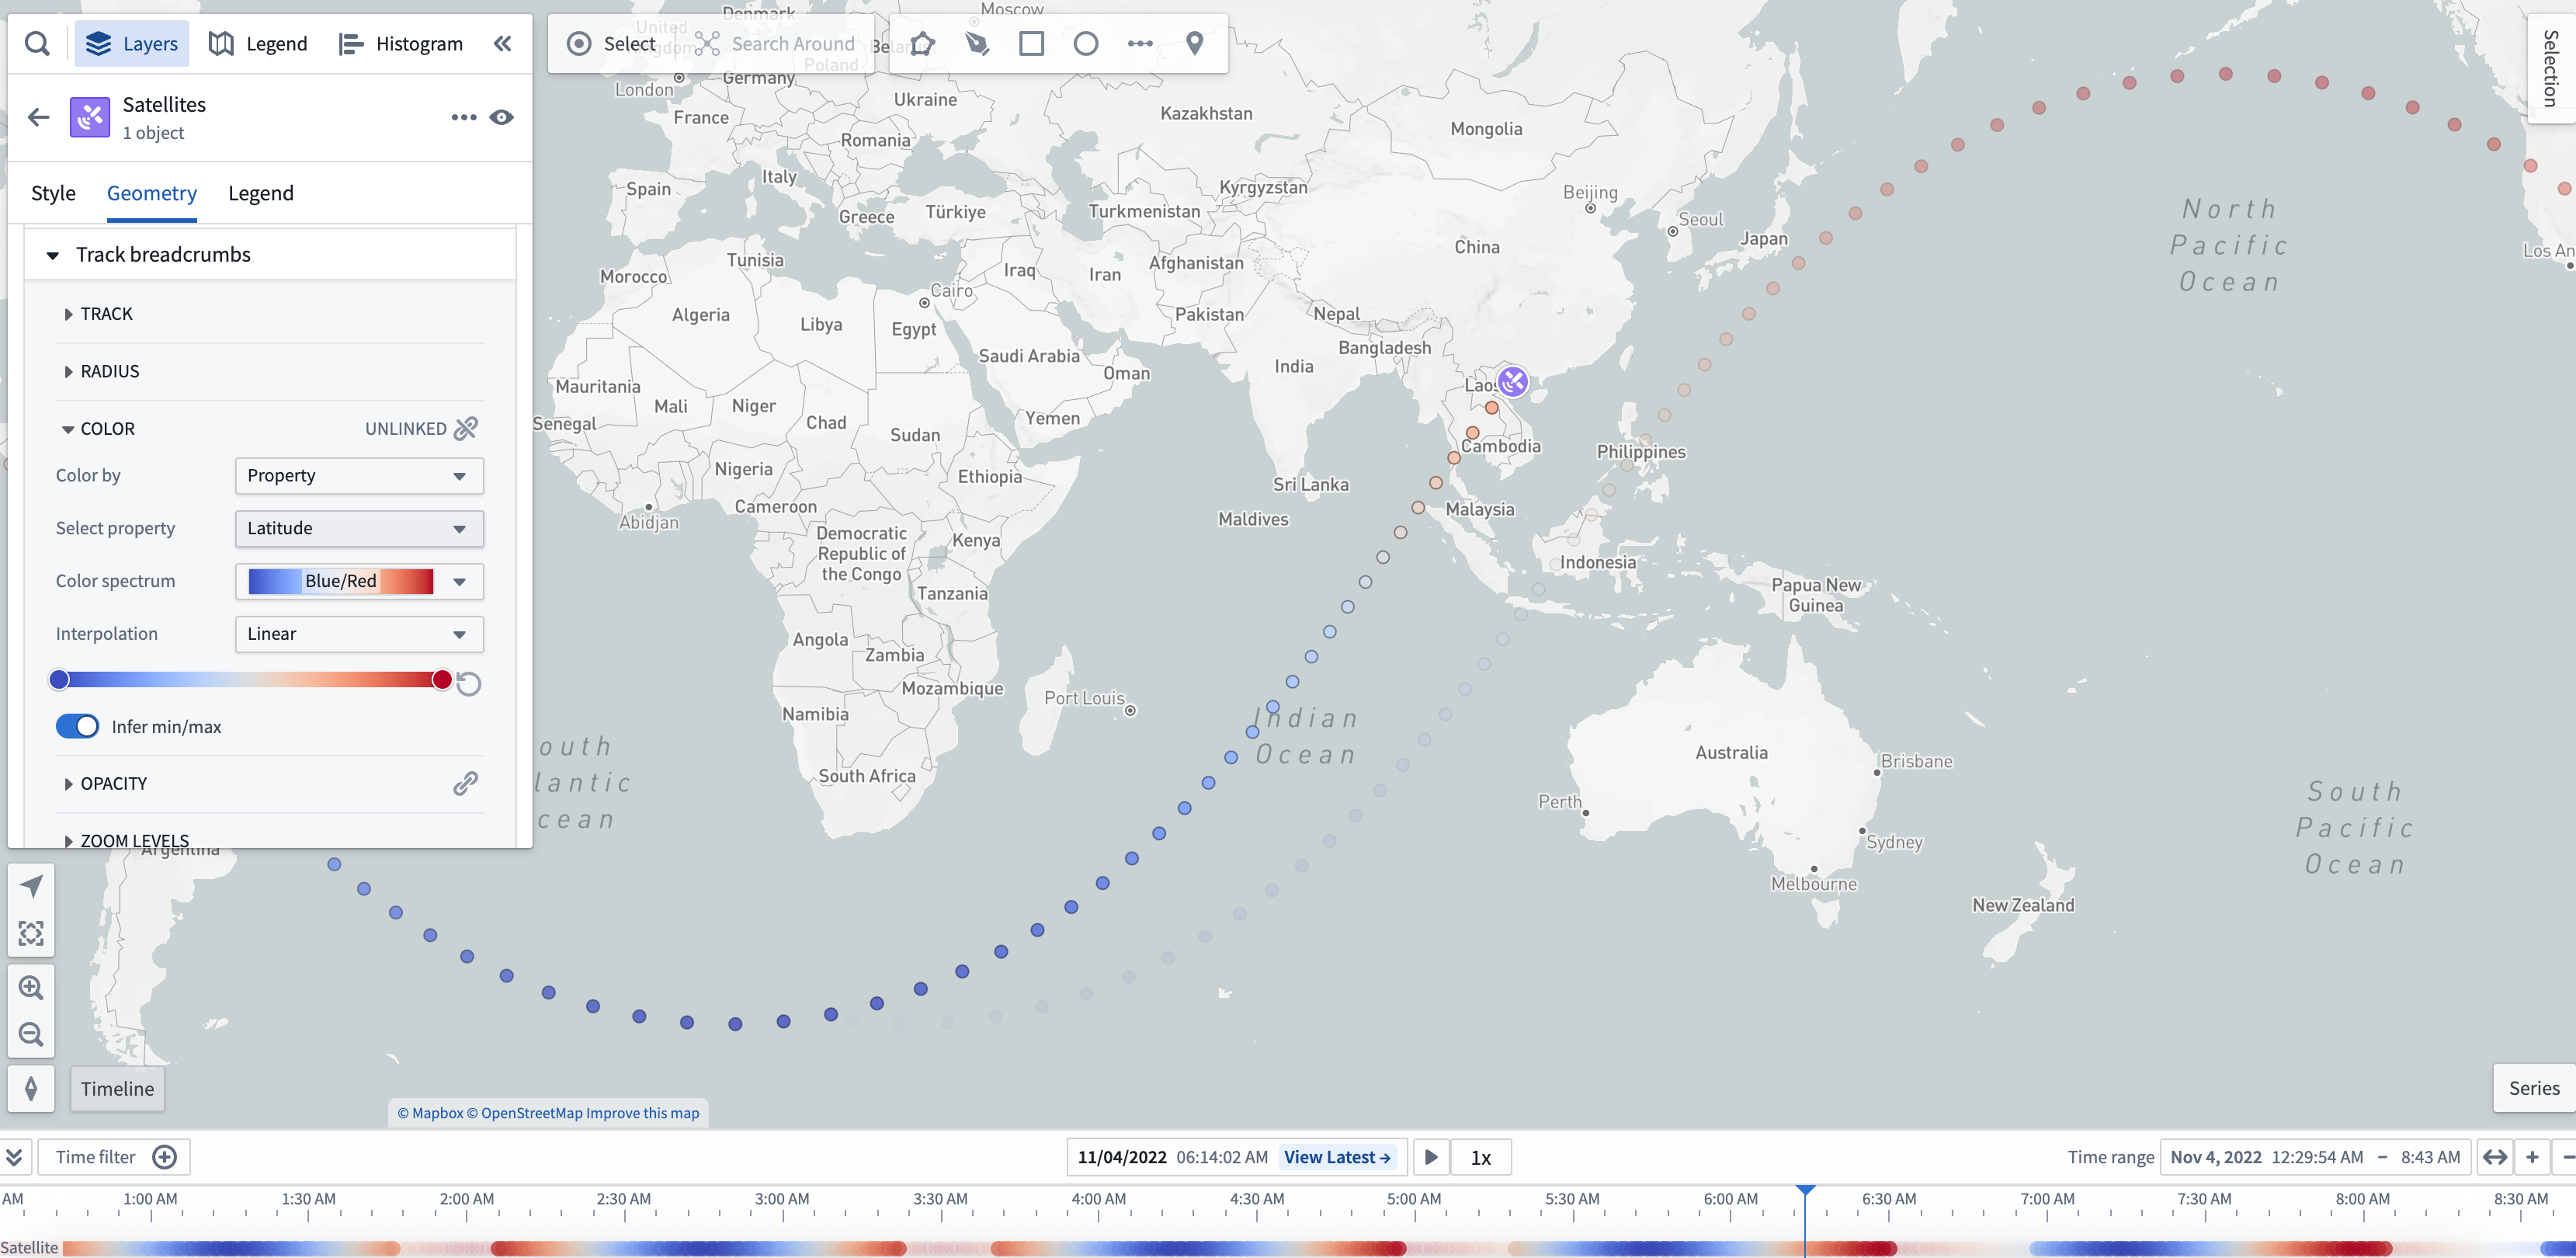
Once you add a track breadcrumbs layer on the timeline, you can access more timeline geometry actions from the layer's entry in the timeline legend, such as further styling in the Layers panel.
Time series [Beta]
Review the time series documentation to learn about adding and configuring a time series in your map's timeline.
FAQs
Will time-based data be visible on the map or timeline for large object sets?
If you add a large (greater than 1,000 objects) object set, then your map automatically loads objects on your map through tile-based loading.
For tile-based loading, timeline events, time-based styling, and filtered time window will not be available. To fix, switch to Object-based loading. This also may require reducing the number of objects to enhance performance.
Why am I unable to see time series styling on my map?
If styling from time series properties are not visible, this means that Map is unable to derive color from a temporal property. You should verify the selected time contains your data.
Why am I unable to see time-based opacity on my objects on my map?
Select a specific object that is not visible and check if the timestamp or date property on the object matches the selected time. You can only configure time-based object opacity on an event object.
Why am I unable to see any track breadcrumbs on my map?
Tracks with a breadcrumb geometry also render on the timeline depending on the time range.
Why am I unable to see any time-based data in my timeline?
If nothing is visible on the timeline, use the Zoom to fit button to show time events on the map in the timeline's Time range.
When visible, the timeline displays lines for an object's time properties.
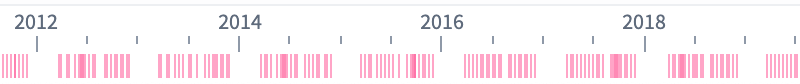
Additionally, the timeline displays bars for time ranges in an object's properties.
中文翻译
时间轴(Timeline)
您可以使用时间轴查看基于时间的数据,并配置时间窗口和选定时间。您可以设置选定时间与时间范围,进一步检查对象的基于时间的属性,并在给定时间范围内筛选特定对象。
时间轴可用于查看事件,例如事件对象和时间轴几何图形、轨迹面包屑以及时间序列(Time Series [Beta])。
即使时间轴未打开,时间轴的时间范围和选定时间也可能影响地图上可见的任何基于时间的数据。
基本控制
打开并启用时间轴
选择地图画布左下角的时间轴(Timeline)以显示或隐藏时间轴。
当使用地图组件(Map widget)在Workshop中嵌入地图时,您可以配置时间轴默认打开。
调整选定时间
时间轴上的光标位置代表地图的选定时间。您可以通过以下方式调整选定时间:
- 双击或右键单击时间轴。
- 将光标拖拽到新位置。
- 选择时间轴标题中间的日期或时间戳以调出日期和时间选择器。
要获取更精确的光标日期,可以点击光标表单输入具体的日期和时间。
选择查看最新(View latest)可将选定时间设置为当前时间。在最新数据(Latest Data)视图下,选定时间将自动更新以匹配当前时间。将最新数据模式与流式数据(streaming data)结合使用,可在地图上可视化实时更新的数据。
:::callout{theme="neutral"} 使用日期和时间选择器时,您只能选择位于对象图层(object layer)当前时间范围内的某个时间点。 ::>
您可以在控制面板中为所有地图配置时间序列在查看最新模式下的默认时间选择和轮询间隔(polling interval)。此外,您还可以在设置面板中配置每个地图的轮询间隔、时区和时间格式。
调整时间范围
您可以在时间轴右上角的标题中查看时间范围,以及时间轴视图的起始和结束时间。按照以下指南,使用鼠标或触控板调整时间范围。
滚动控制:
- 使用鼠标滚轮在时间轴上放大或缩小,按下
Cmd(macOS)/Ctrl(Windows)键同时滚动可平移时间范围。 - 使用触控板,通过垂直滑动或捏合手势在时间轴上放大或缩小。
选择时间轴标题右上角的时间范围(Time range)以输入时间轴的具体日期和时间范围。
要基于时间轴中的数据自动调整时间窗口,请选择缩放至适配(Zoom to fit)按钮,该按钮以双向箭头标记。
筛选时间窗口
您可以通过以下方式在地图上筛选事件:
- 按住
Shift键,在时间轴上选择一个点,然后拖拽光标以创建时间筛选窗口。 - 使用时间轴控制栏中的时间筛选(Time filter)按钮。
时间筛选也位于地图画布顶部。与筛选条件匹配的地图对象将完全不透明,而不匹配时间筛选的对象则会淡出显示。
时间轴播放
您可以使用播放按钮(⏵)自动移动时间光标;播放速度可通过速度预设(1x、2x、5x、10x、100x 等)进行调整。
光标将在时间轴的时间窗口或时间筛选(如果存在)范围内自动循环。
展开时间轴
当时间轴折叠时,添加到时间轴的数据不可见。但是,您仍然可以更改时间范围、筛选时间窗口和选定时间。
要显示每种对象类型在时间轴上的独立行,请选择时间轴控制栏中的展开(![]() )。
)。
向时间轴添加数据
添加到时间轴的所有数据均按对象类型分组。
事件
事件对象
事件对象会自动向时间轴添加一个事件图层。
时间轴几何图形
要使新的时间轴事件几何图形图层出现在时间轴上,请从图层(Layers)面板添加时间轴几何图形。了解有关为时间轴几何图形应用自定义样式的更多信息。
轨迹面包屑
具有面包屑几何图形(breadcrumb geometry)的轨迹也会根据时间范围和地图视口(viewport)在时间轴上渲染。
您可以通过将选定时间移动到其他点来动画显示对象在其轨迹上的路径。
要使新的轨迹面包屑图层在时间轴上渲染,请从图层面板添加轨迹面包屑几何图形。
一旦您在时间轴上添加了轨迹面包屑图层,您可以从时间轴图例中的图层条目访问更多时间轴几何图形操作,例如在图层面板中进行进一步样式设置。
时间序列 [Beta]
请查阅时间序列文档,了解如何在地图的时间轴中添加和配置时间序列。
常见问题解答
对于大型对象集,基于时间的数据在地图或时间轴上是否可见?
如果您添加了一个大型(超过 1,000 个对象)对象集,则地图会自动通过基于瓦片的加载(tile-based loading)加载地图上的对象。
对于基于瓦片的加载,时间轴事件、基于时间的样式和筛选时间窗口将不可用。要解决此问题,请切换到基于对象(Object-based)的加载。这也可能需要减少对象数量以提升性能。
为什么我在地图上看不到时间序列样式?
如果时间序列属性的样式不可见,这意味着地图无法从时间属性(temporal property)中派生颜色。您应验证选定时间是否包含您的数据。
为什么我在地图上看不到对象的基于时间的不透明度?
选择一个不可见的特定对象,检查该对象的时间戳或日期属性是否与选定时间匹配。 您只能在事件对象上配置基于时间的对象不透明度。
为什么我在地图上看不到任何轨迹面包屑?
具有面包屑几何图形的轨迹也会根据时间范围在时间轴上渲染。
为什么我在时间轴上看不到任何基于时间的数据?
如果时间轴上没有任何可见内容,请使用缩放至适配按钮,在时间轴的时间范围内显示地图上的时间事件。
当可见时,时间轴会显示对象时间属性的线条。
此外,时间轴还会显示对象属性中时间范围的条形。