Choropleths(等值区域图 (Choropleths))
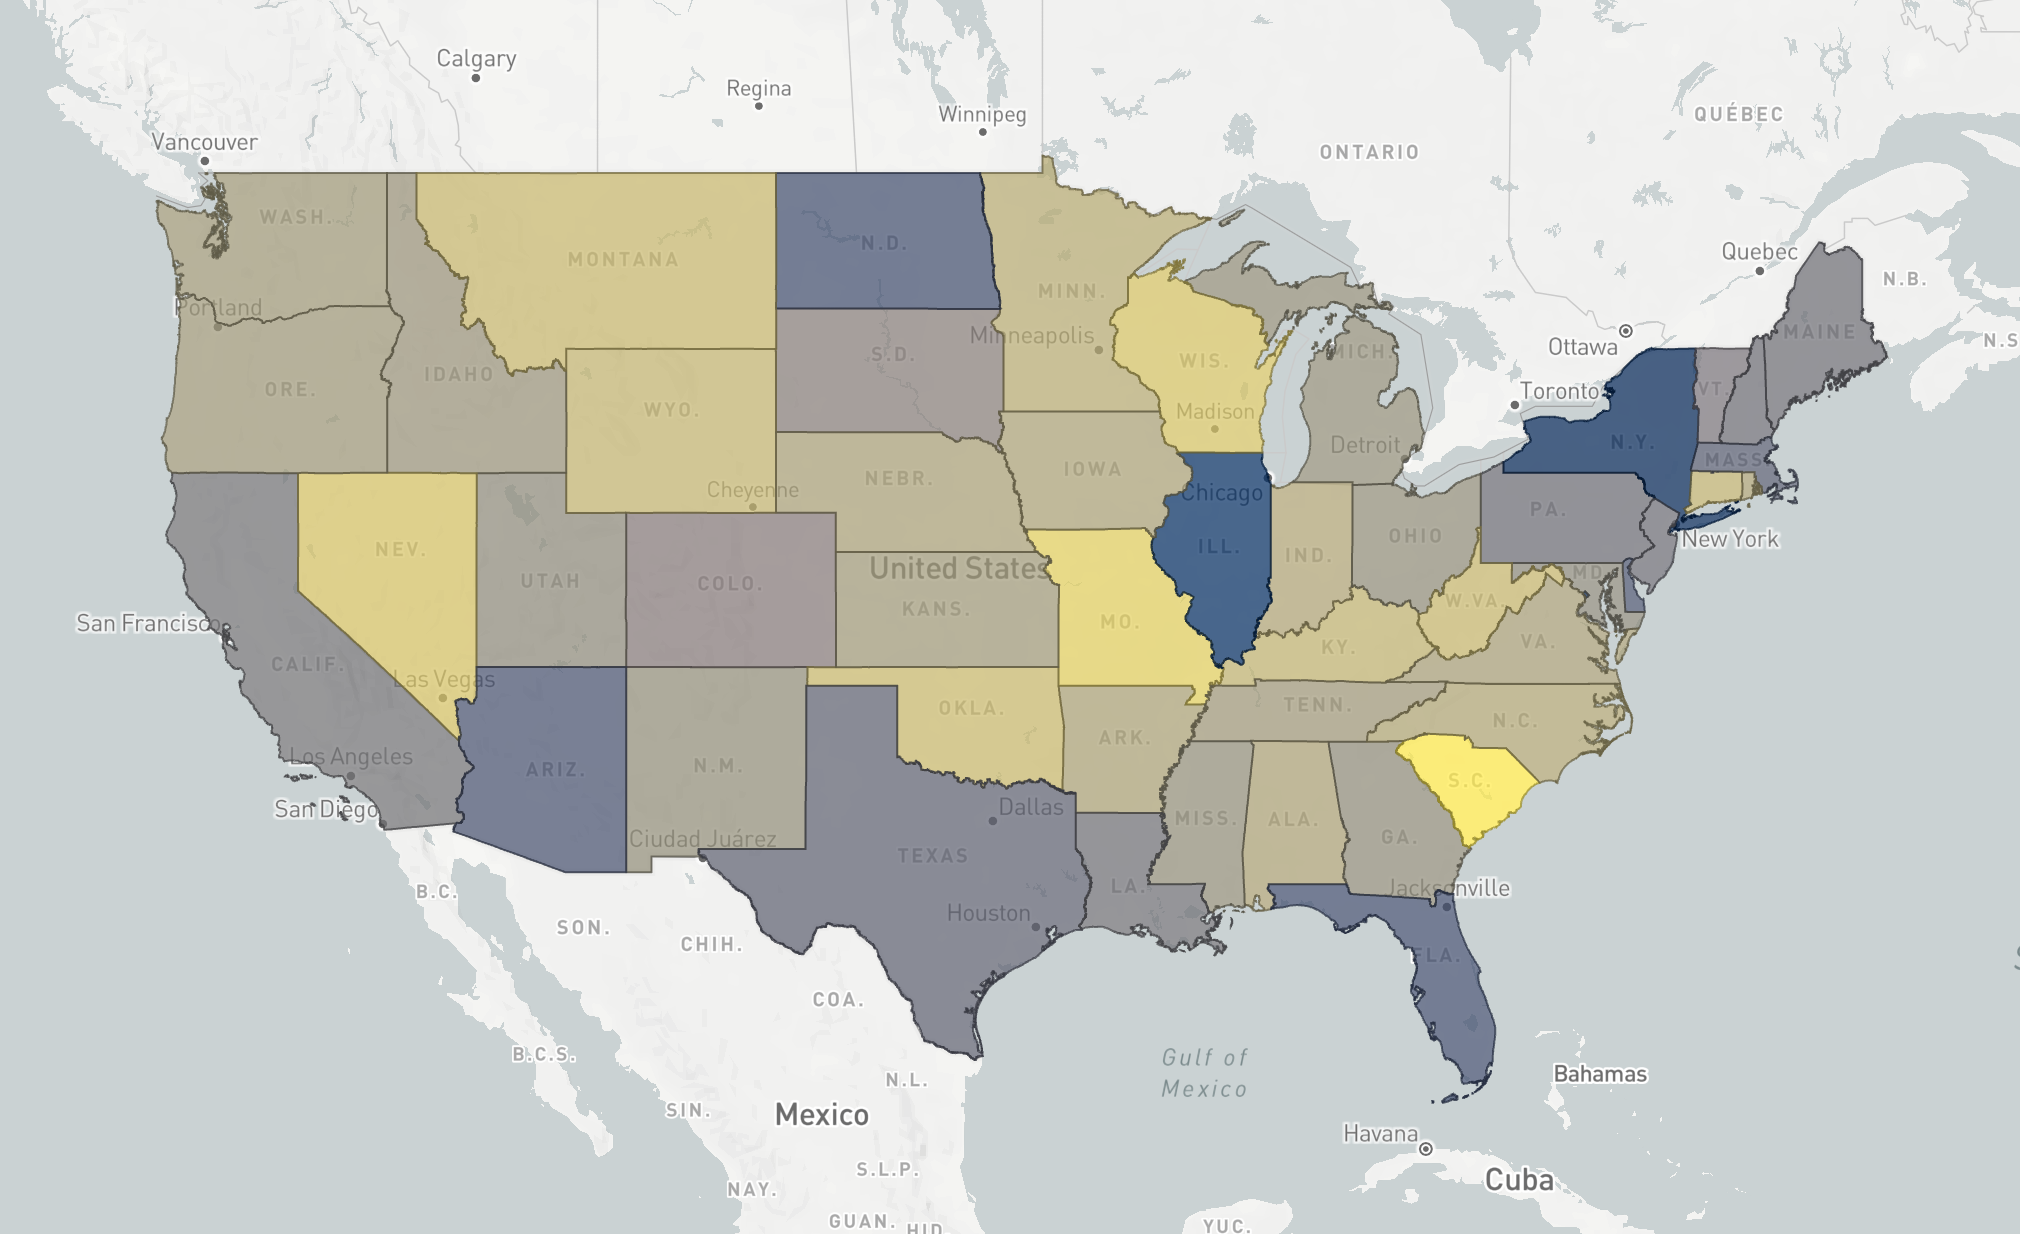
A choropleth map displays regions colored by an aggregation computed across all objects in each region. Choropleths are useful for visualizing spatial patterns in large datasets. This example map shows a choropleth map generated from 31 million traffic accident objects, where each US state is colored by the average severity of accidents that occurred within it.
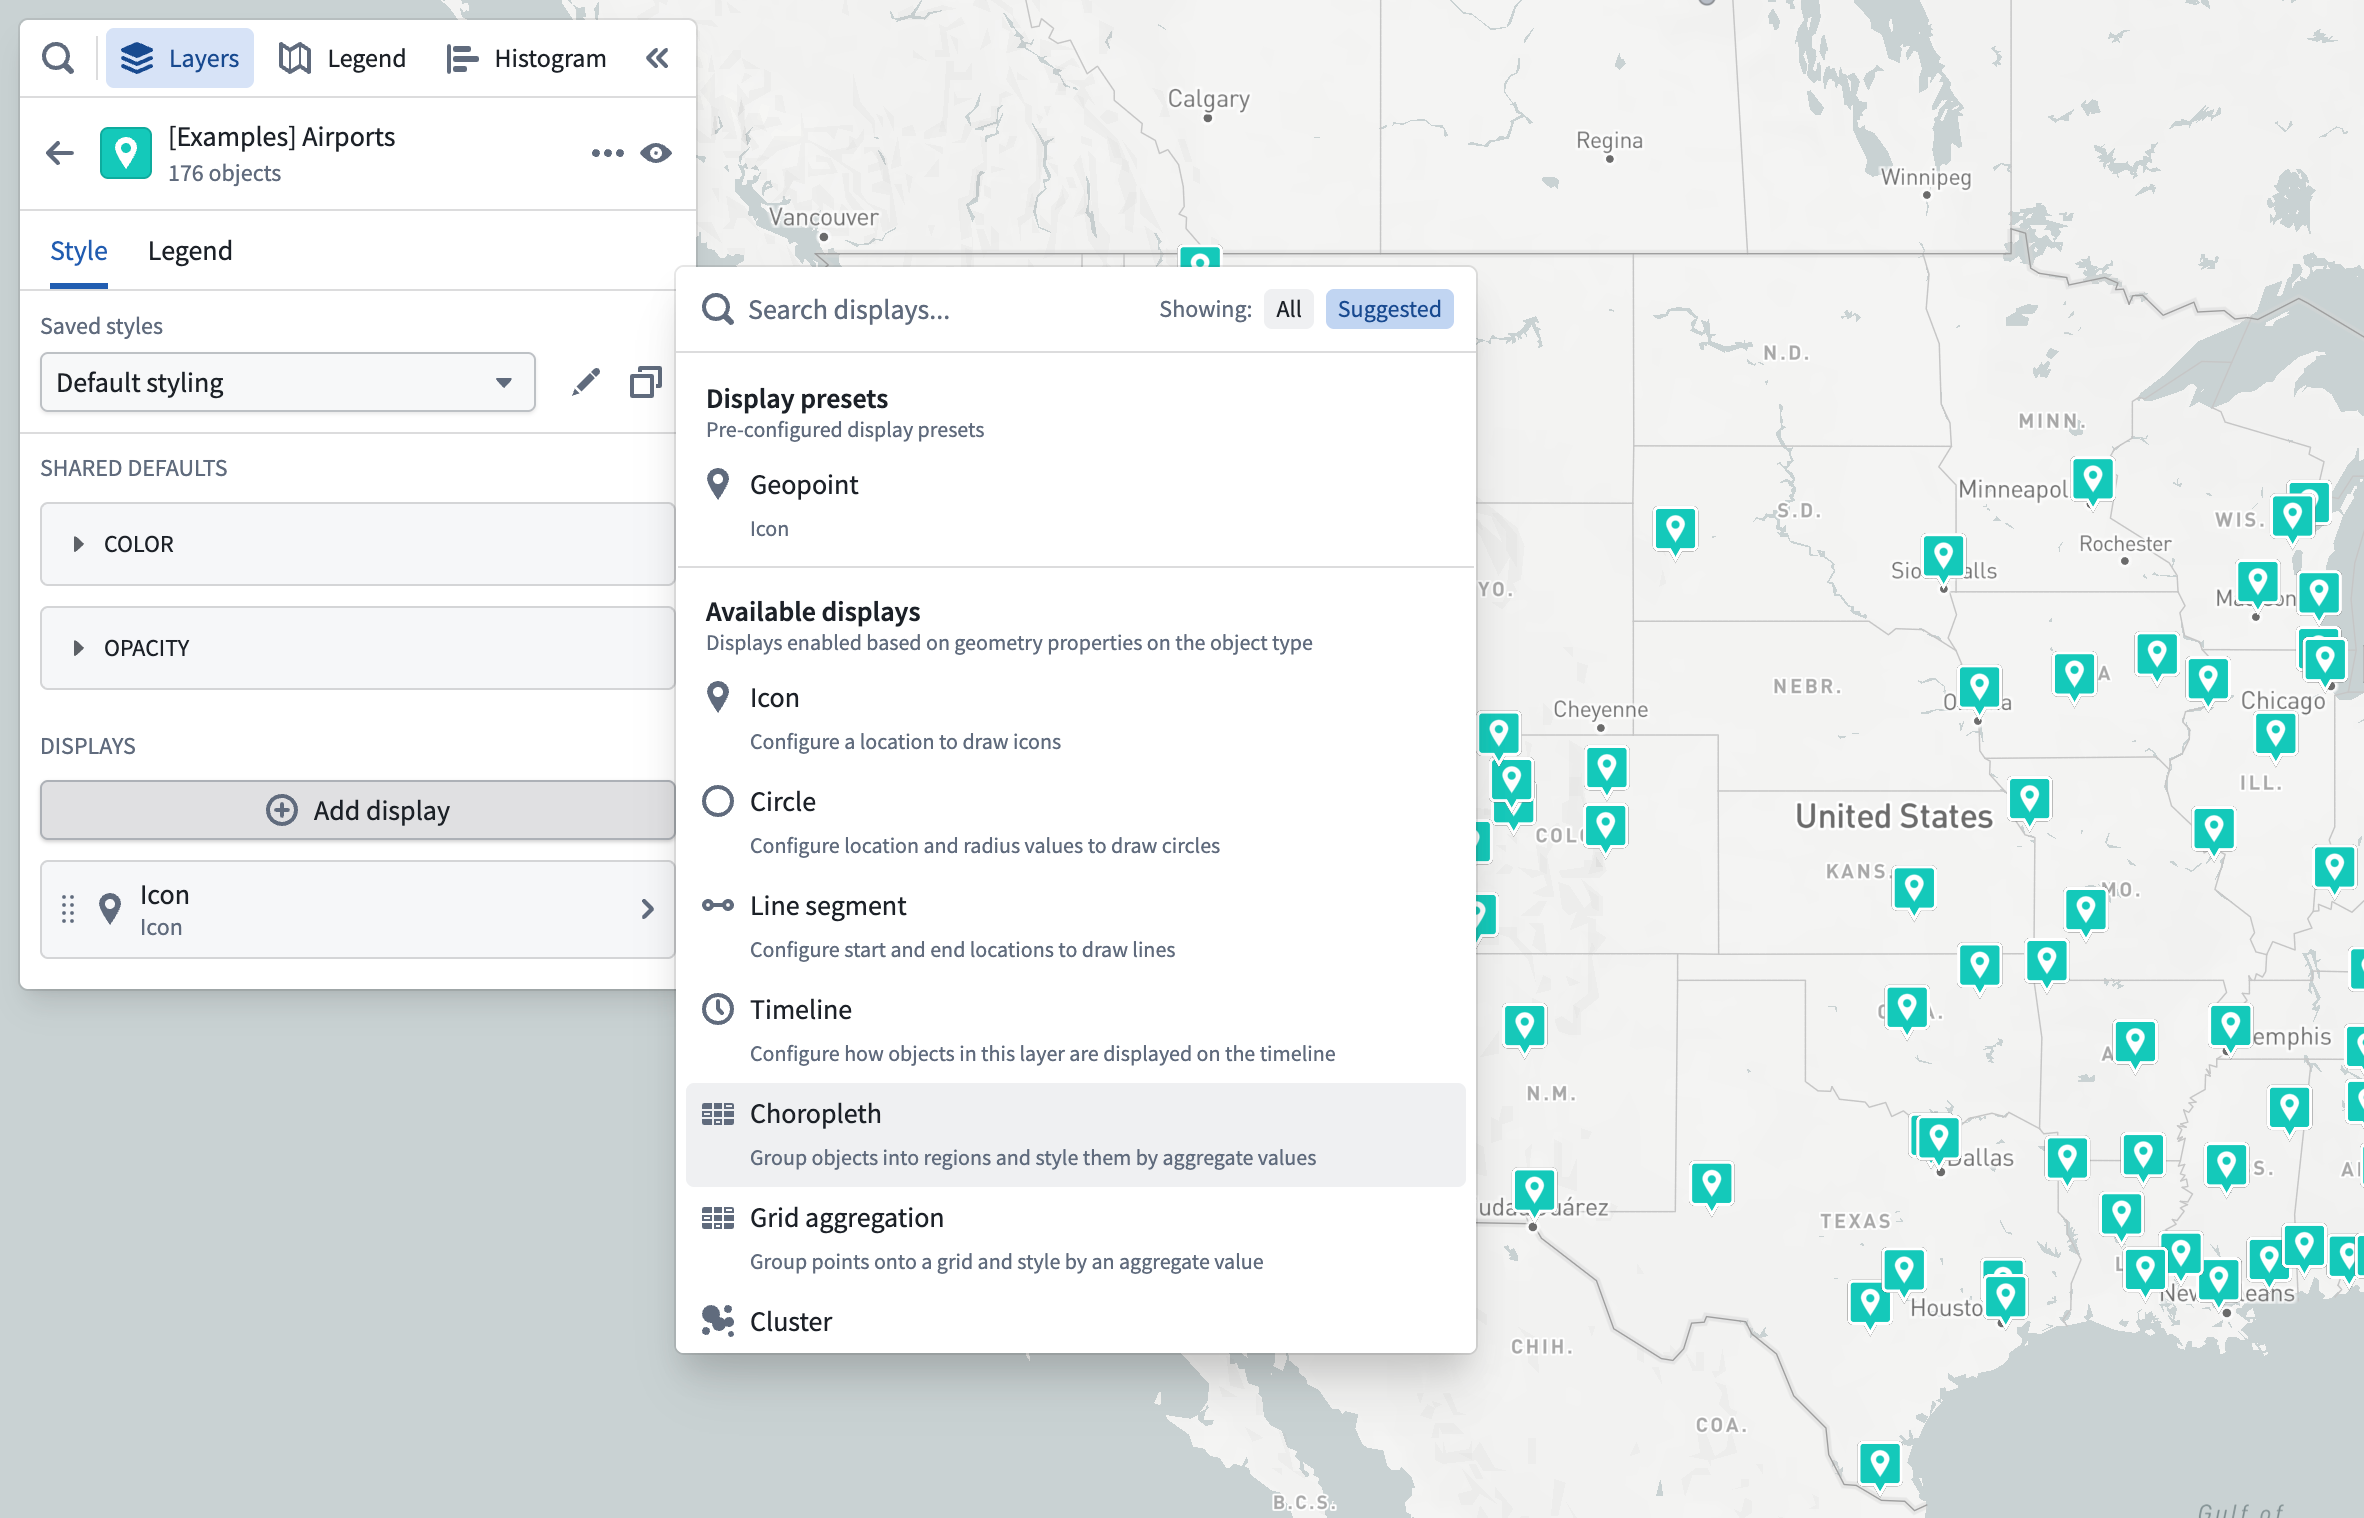
To configure a choropleth map, add the objects you want to compute aggregations over to the map, and add a choropleth styler from the Add display menu in the Styling panel.
You then need to specify how to group objects into regions, as well as how each region should be displayed. A choropleth region has the same styling options as polygon displays, with the only difference that all the values are based on aggregations computed over all objects in each region.
Grouping objects into regions
The Regions section of styling for choropleths lets you specify how to group objects into regions, where each region will show as a single polygon on the map. You can group objects together by a property that has a boundary identifier type supported by the Map application, or an object type linked to the objects in your layer.
Group by boundary identifiers
The map application supports rendering choropleths for objects that are configured with some common identifier types. The polygon geometry for these boundary types is built in to the Map application, making your data integration easier if your data already has one of these identifier types attached.
Some examples of identifier types that the map supports are:
- ISO 3166 country codes
- US State abbreviations (CA, TX, OR, …)
- US County FIPS codes
See the Ontology objects for the map page for more information on the full range of identifiers supported, and how to configure property types to reference them for use in maps.
To configure a boundary identifier, select the Property option in the Group by dropdown menu, and then choose from the properties that have an identifier configured in the Property dropdown menu. Only properties that are configured in the Ontology as a boundary identifier will be shown.
After selecting a boundary property, all objects with the same value for that property type will be grouped together when computing aggregations for styling.
Group by linked objects
If you need to provide your own geometry for regions, you can group objects together by selecting an ontology link. The Map application will then group together objects that are linked to the same object. Learn more about the ontology configuration for custom region geometry.
Styling by aggregation
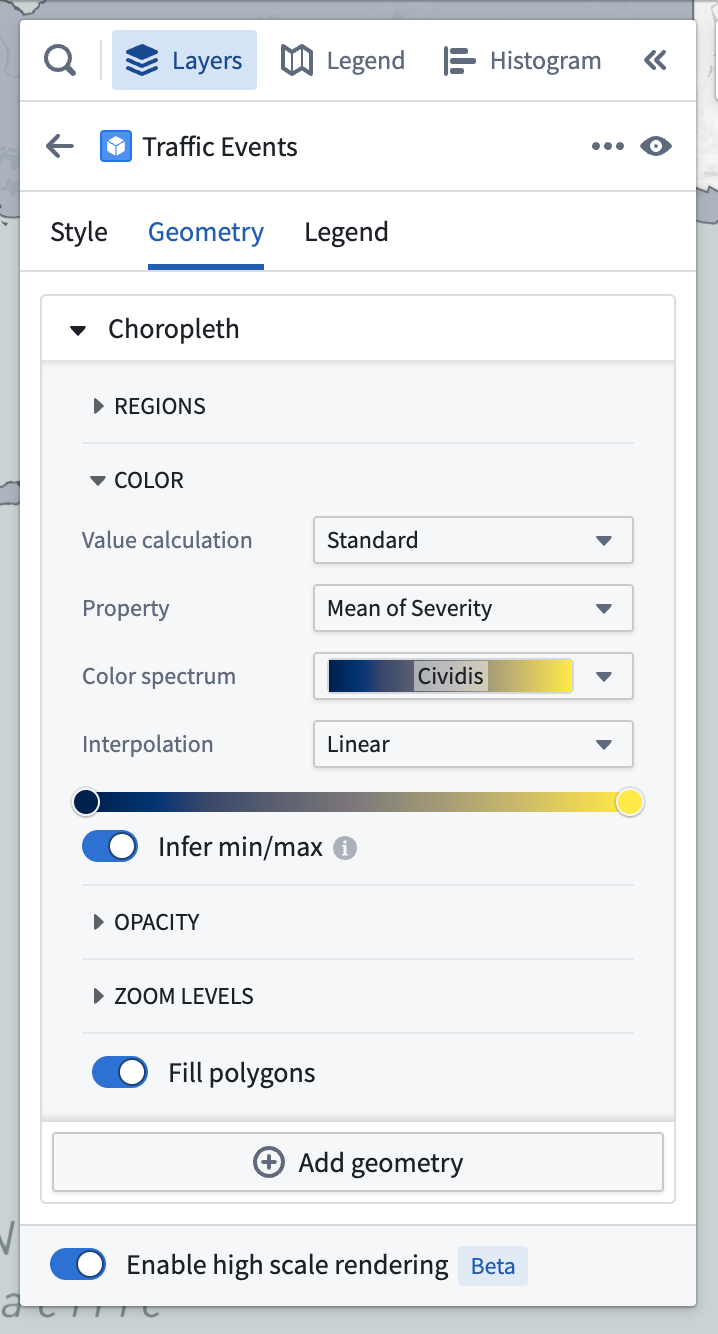
Value-based styling is different in choropleth maps, since each region is colored based on an aggregation computed over the objects within. There are two ways to define aggregations for a choropleth, standard, and expression.
Standard aggregations
A standard aggregation is a simply way to define an aggregation over a property of the objects in a region. To configure a standard aggregation, open the Property menu and select the property and aggregation function (sum, mean, max, min) you want to use.
Expression aggregations
An expression aggregation lets you define a custom aggregation over the objects in a region. Build an expression aggregation by adding multiple expression references, and the last reference in the list provides the value that will be used to color the region. Each reference can be one of:
- A simple aggregation over a property of the objects grouped into a region
- A property from the region itself (only available when grouping by linked objects)
- An operation that combines two other references
For example, this map uses an expression aggregation to color US Forest Service Ranger Districts by the density of trails in each district.
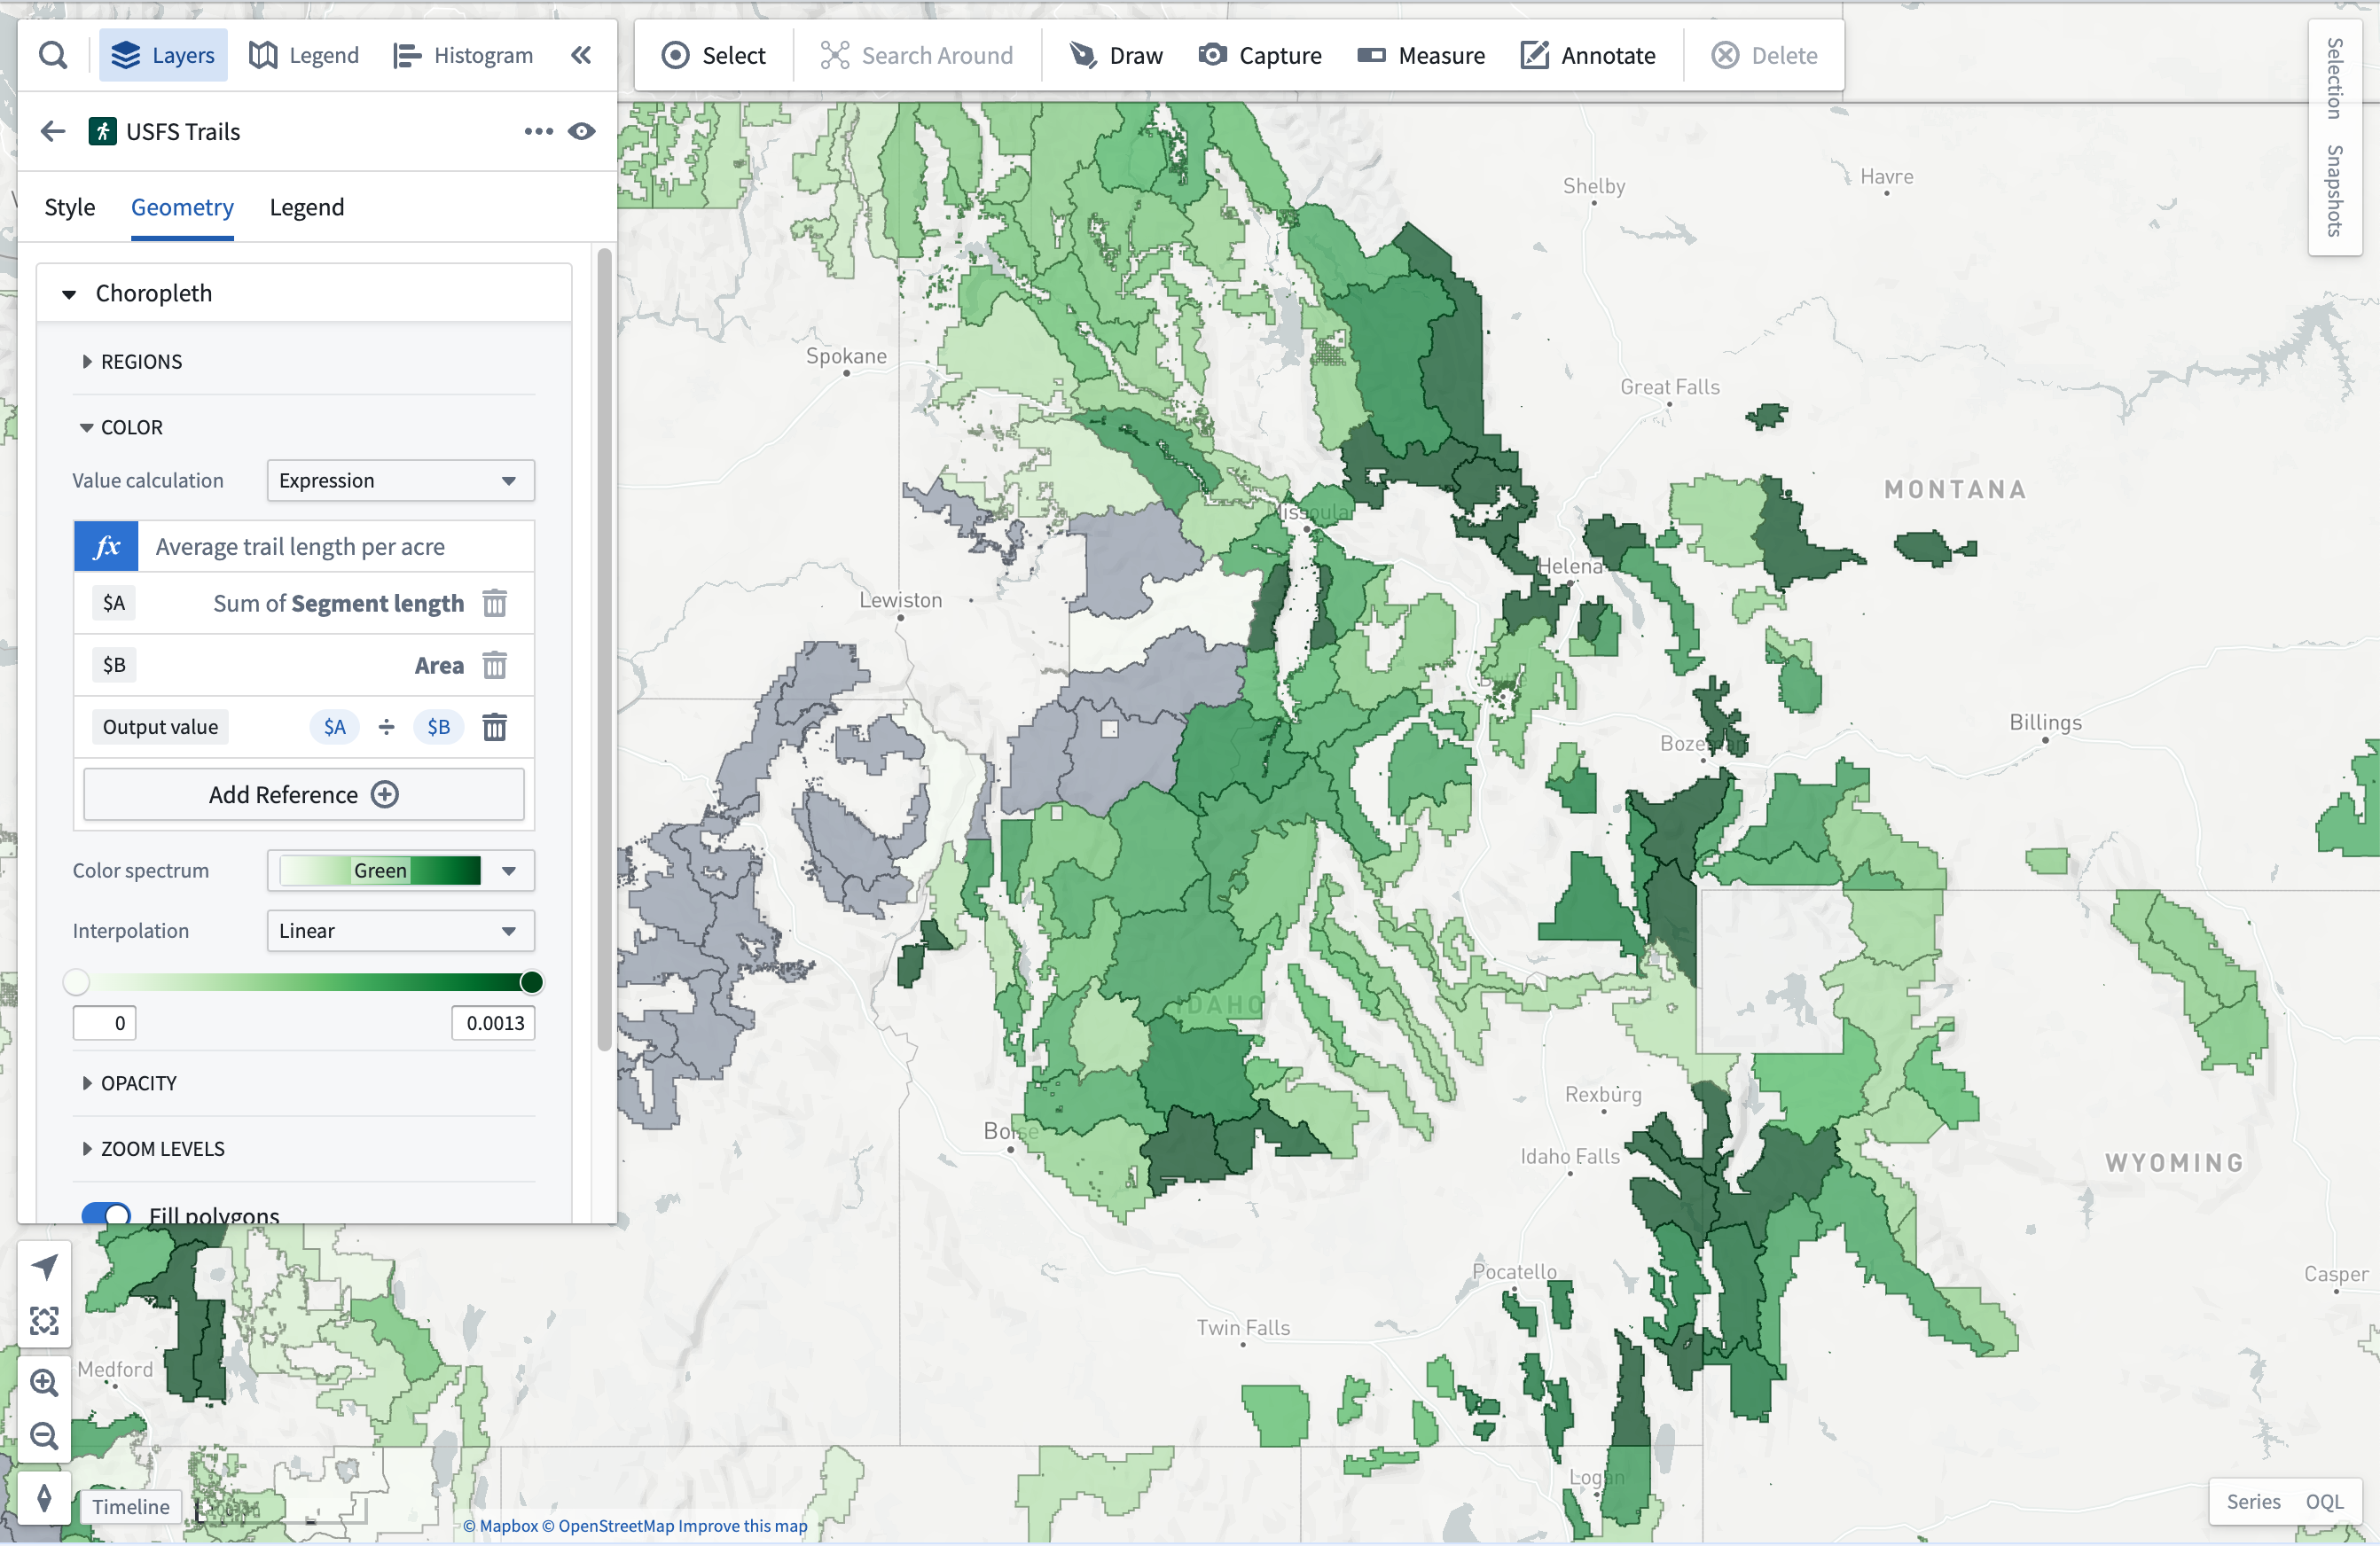
It uses three expressions to compute the trail density:
- The first computes the total length of trails within each US Forest Service Ranger District.
- The second references the total area of the region.
- The third is an operation that computes the average trail length per acre, by dividing the first reference by the second.
中文翻译
等值区域图 (Choropleths)
等值区域图通过颜色展示各区域内所有对象的聚合计算结果。这类地图有助于可视化大型数据集中的空间模式。以下示例地图展示了基于3100万交通事故对象生成的等值区域图,其中每个美国州份按该州内事故的平均严重程度着色。
要配置等值区域图,请将需要计算聚合的对象添加到地图中,然后从样式面板的添加显示菜单中选择等值区域图样式器。
接下来需要指定如何将对象分组到区域,以及每个区域的显示方式。等值区域图的区域样式选项与多边形显示相同,唯一区别在于所有数值均基于各区域内所有对象的聚合计算结果。
将对象分组到区域
等值区域图样式中的区域部分允许您指定如何将对象分组到区域,每个区域在地图上显示为单个多边形。您可以通过以下方式对对象进行分组:使用具有地图应用支持的边界标识符类型的属性,或使用与图层中对象关联的对象类型。
按边界标识符分组
地图应用支持为配置了某些通用标识符类型的对象渲染等值区域图。这些边界类型的多边形几何已内置在地图应用中,如果您的数据已包含这些标识符类型,则可简化数据集成。
地图支持的部分标识符类型示例:
- ISO 3166 国家代码
- 美国州份缩写(CA、TX、OR 等)
- 美国县 FIPS 代码
有关支持的完整标识符列表以及如何配置属性类型以在地图中引用这些标识符的详细信息,请参阅地图的本体对象页面。
要配置边界标识符,请在分组依据下拉菜单中选择属性选项,然后从属性下拉菜单中选择已配置标识符的属性。仅显示在本体 (Ontology) 中配置为边界标识符的属性。
选择边界属性后,所有具有相同属性值的对象将在计算样式聚合时被分组在一起。
按链接对象分组
如果需要为区域提供自定义几何,可以通过选择本体链接 (ontology link) 来对对象进行分组。地图应用会将链接到同一对象的所有对象分组在一起。有关自定义区域几何的更多信息,请了解本体配置。
按聚合设置样式
等值区域图中的基于值样式有所不同,因为每个区域的颜色基于区域内对象的聚合计算结果。定义等值区域图聚合有两种方式:标准和表达式。
标准聚合
标准聚合是一种简单的方式,用于定义区域内对象属性的聚合。要配置标准聚合,请打开属性菜单,选择要使用的属性和聚合函数(总和、平均值、最大值、最小值)。
表达式聚合
表达式聚合允许您为区域内对象定义自定义聚合。通过添加多个表达式引用来构建表达式聚合,列表中的最后一个引用提供用于区域着色的值。每个引用可以是以下之一:
- 对分组到区域内的对象属性的简单聚合
- 区域本身的属性(仅在按链接对象分组时可用)
- 组合两个其他引用的运算
例如,以下地图使用表达式聚合按美国林务局护林区 (Ranger Districts) 显示各区域的小径密度。
该地图使用三个表达式计算小径密度:
- 第一个表达式计算每个美国林务局护林区内的小径总长度。
- 第二个表达式引用区域的总面积。
- 第三个表达式通过将第一个引用除以第二个引用,计算每英亩的平均小径长度。