Clusters(集群(Clusters))
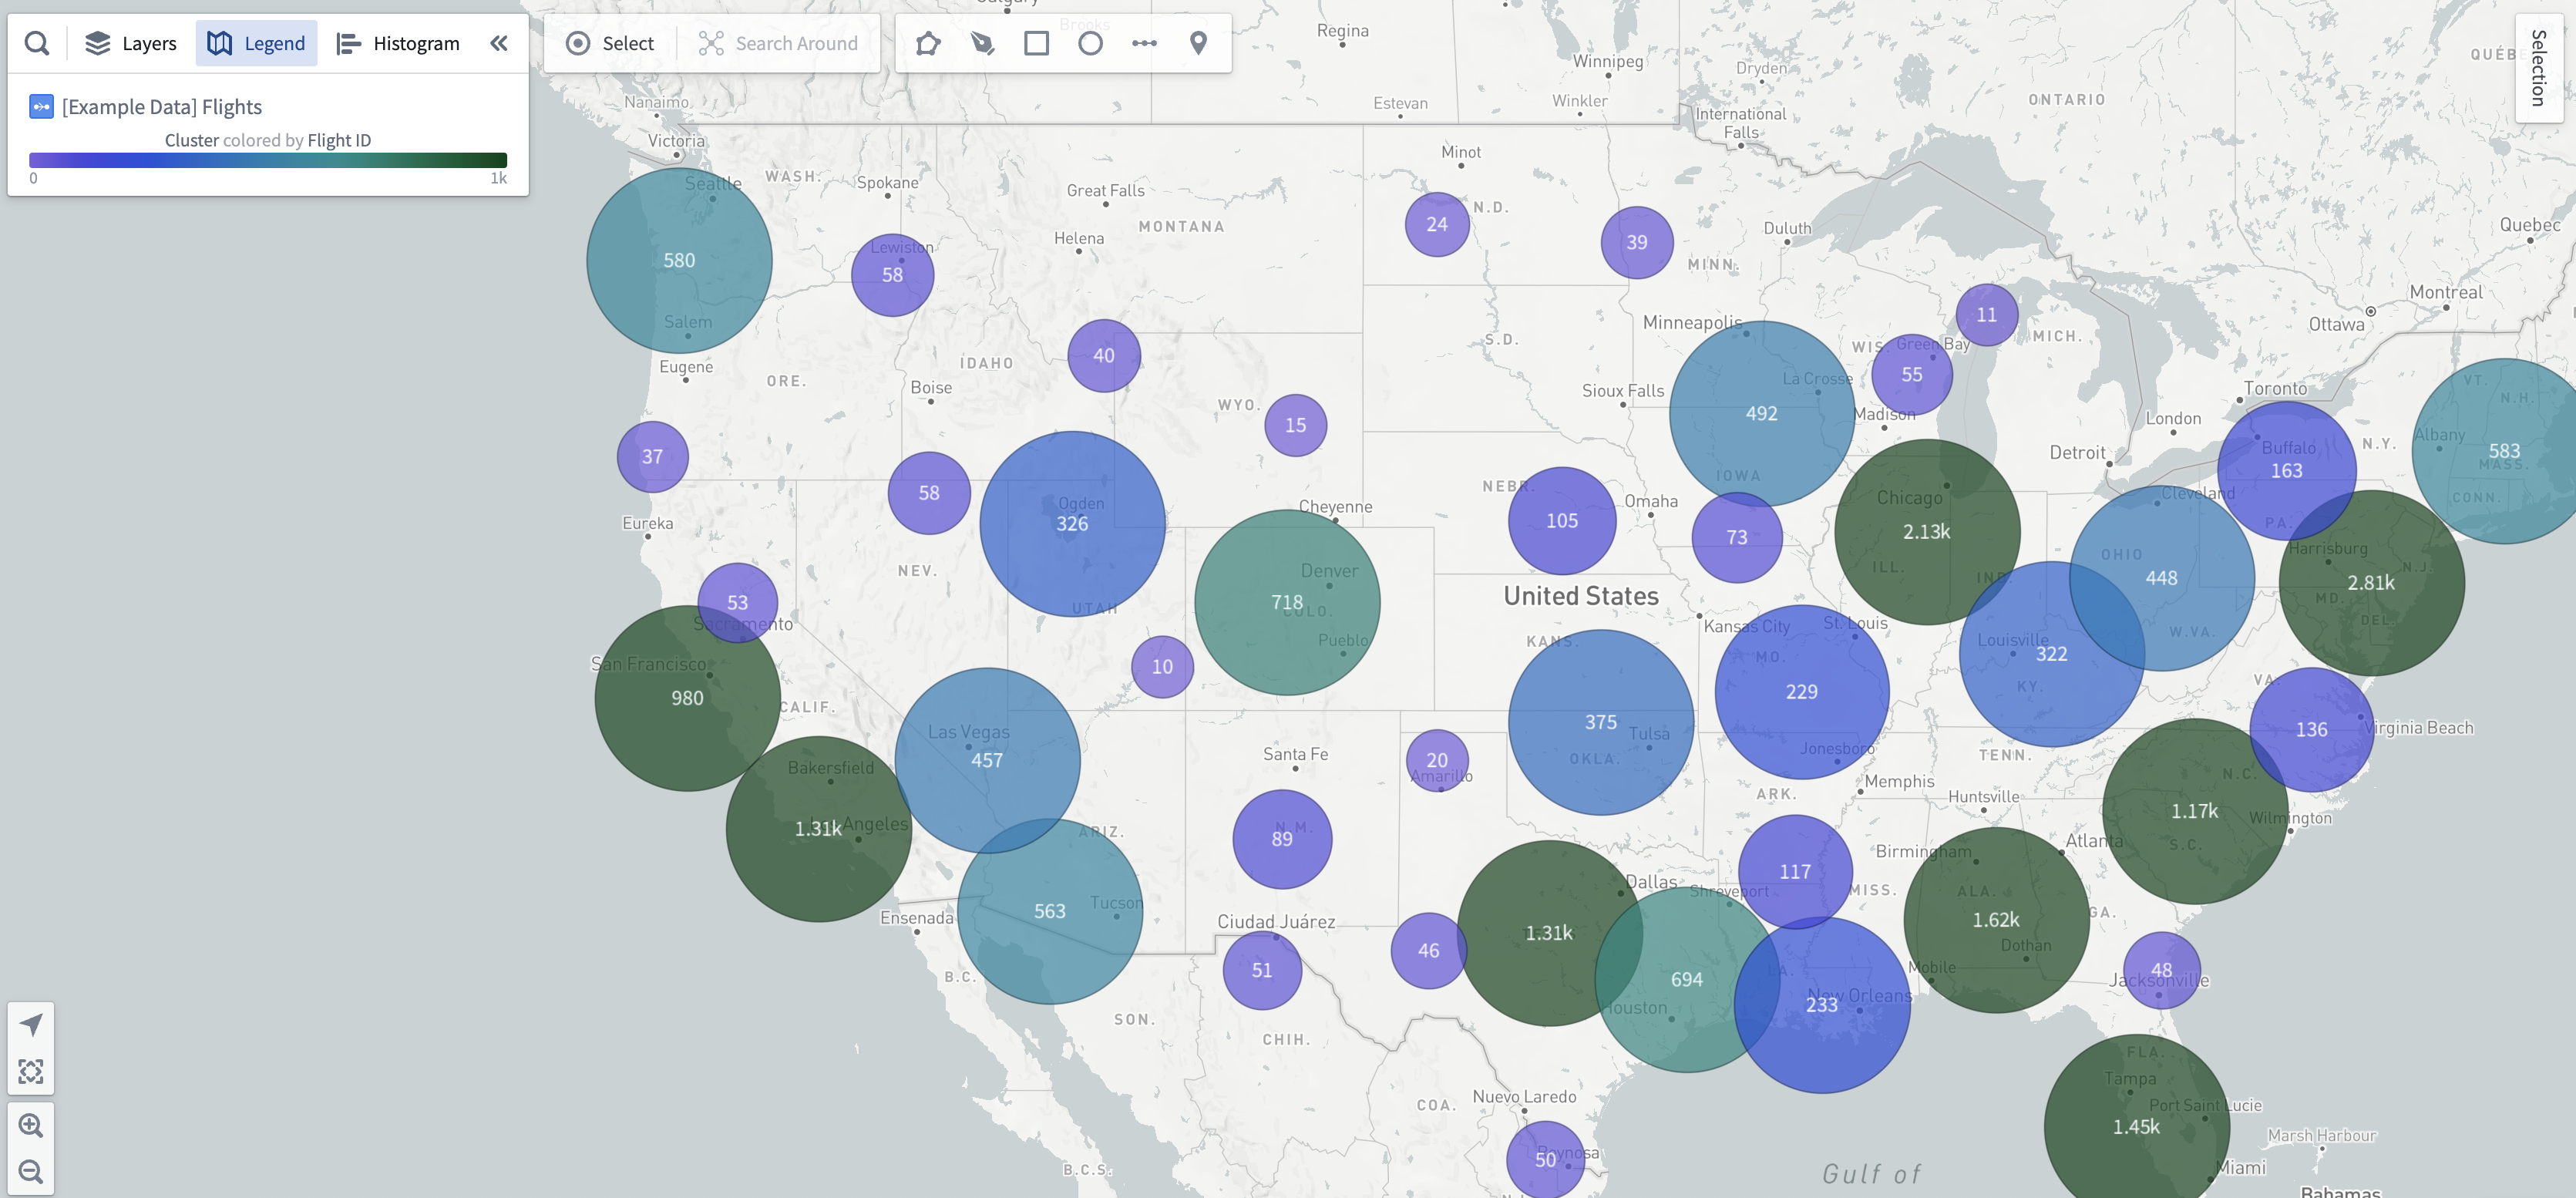
Cluster displays are ideal for larger object sets based on a geopoint location property. Clusters are similar to points, but instead of plotting a single marker per object, the objects being plotted are aggregated based on their geographic proximity to clusters. The size and/or color of the cluster can be configured to represent the number of objects within a given area, or some other aggregation metric such as the sum or average of a property across the objects within a region. The contents of each cluster region will update automatically as the user zooms in, zooms out, or pans to introduce new data.
Cluster displays can be added to object layers using the Add geometry option. The Center configuration of a cluster display accepts only Geopoint properties.
Styling by aggregation
Cluster displays have the roughly the same styling options as circle geometries, but the color and radius configurations are computed as aggregate values over all objects in a singular cluster. To learn more about styling via aggregate values, see the styling by aggregation section for choropleth displays.
Cluster text labels
While cluster displays are in the beta phase of development, the content of the text labels will reflect either the aggregate value used in the color configuration, or the aggregate value used in the radius configuration if the color style is fixed.
中文翻译
集群(Clusters)
集群显示适用于基于地理点位置属性的大规模对象集。集群与点类似,但并非为每个对象单独绘制标记,而是根据地理邻近性将对象聚合为集群。集群的大小和/或颜色可配置为表示给定区域内的对象数量,或基于区域内对象属性的总和、平均值等其他聚合指标。当用户缩放、平移以引入新数据时,每个集群区域的内容将自动更新。
集群显示可通过添加几何图形(Add geometry)选项添加到对象图层中。集群显示的中心(Center)配置仅接受地理点(Geopoint)属性。
按聚合设置样式(Styling by aggregation)
集群显示与圆形几何图形(circle geometries)的样式选项大致相同,但颜色和半径配置将作为单个集群内所有对象的聚合值进行计算。要了解更多关于通过聚合值设置样式的信息,请参阅色阶显示(choropleth displays)的按聚合设置样式部分。
集群文本标签(Cluster text labels)
在集群显示处于测试阶段时,文本标签的内容将反映颜色配置中使用的聚合值,或者当颜色样式固定时,反映半径配置中使用的聚合值。