Point displays(点状显示)
Maps contain two ways to visualize point displays: icons and circles. To display an icon or circle, you need a geometry source that provides a location for each object. The supported geometry sources are geopoint properties and tracks.
When using a track as a point geometry source, the map will extract a location from the track that corresponds to the current selected time. There are configuration options that control how that location is interpolated, which are covered on the tracks page.
Icon configuration
Icons are one of the most common ways to visualize point data. Each icon is placed at the location provided by the geometry source, and can be styled in a variety of ways to generate a visualization that suits your workflow.
Icon
The Icon section allows you to control the icon that will be displayed for each object. The options for specifying the icon that is displayed are:
- Object default: The icon will be the default icon for the object type, as configured in the Ontology Management application.
- Media image: Choose an image media item to display for all objects in the layer.
- Fixed icon: Choose a specific icon to display for all objects in the layer.
- Property: Each object is displayed with an icon that is determined by a property on the object.
The example below uses a rain status time series with both color and icon styling to visualize which weather stations across the Pacific Northwest observed rain on the selected day.
![]()
Image media items
The property option supports media reference type object properties and will display underlying media as icons. Image media references are the only supported media format for icons.
Rotation
You can control the rotation of the icon by any of the value-based styling options. For track geometry sources, there is also an Automatic option which rotates the icon in the direction of the object's movement according to the track.
The example below uses a fixed arrow icon and rotation styling to display the direction of movement for vessel objects.
![]()
Marker shape
There are three styles of markers that you can configure for icons:
| Circle | Pin | None |
|---|---|---|
 |
 |
 |
Circle configuration
Each circle is centered on the location provided and drawn with a radius value that you can configure in the radius section of styling.
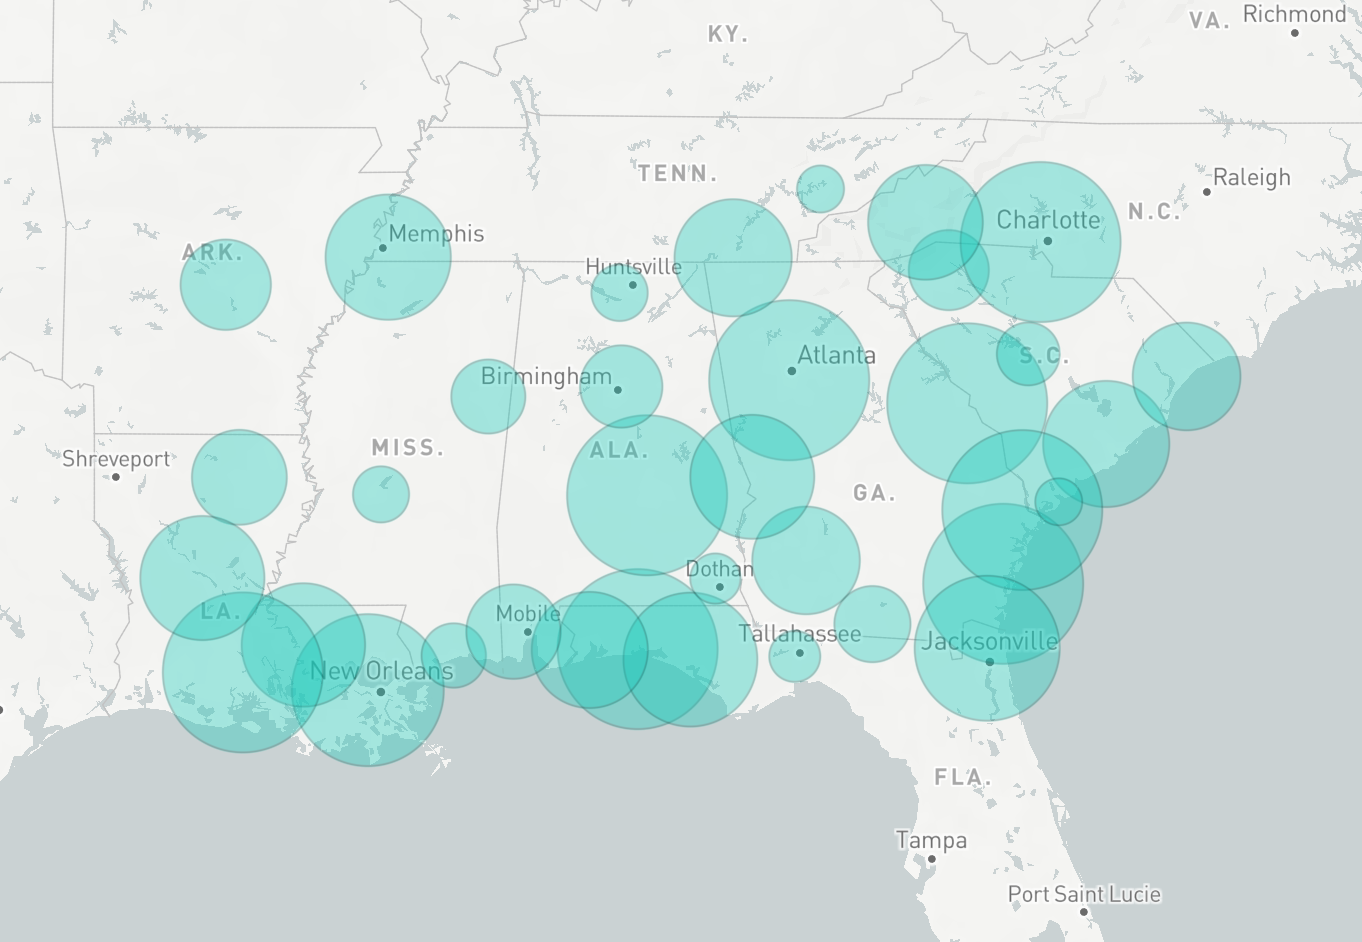
The other circle style options are the same as the options for polygon displays.
Loading methods
When displaying a large number of objects, icon and circle displays can also support tile-based loading methods.
中文翻译
点状显示
地图提供两种点状显示的可视化方式:图标(icon)和圆形(circle)。要显示图标或圆形,需要提供每个对象位置信息的几何数据源(geometry source)。支持的几何数据源包括地理点属性和轨迹。
当使用轨迹作为点状几何数据源时,地图会从轨迹中提取与当前选定时间对应的位置信息。关于如何插值该位置信息的配置选项,详见轨迹页面。
图标配置
图标是可视化点状数据最常用的方式之一。每个图标都放置在几何数据源提供的位置上,并可通过多种样式设置生成适合工作流程的可视化效果。
图标
图标部分允许您控制每个对象显示的图标。指定显示图标的选项包括:
- 对象默认值: 图标将使用对象类型的默认图标(在 Ontology Management 应用程序中配置)。
- 媒体图像: 选择一张媒体图像,为图层中所有对象显示。
- 固定图标: 选择一个特定图标,为图层中所有对象显示。
- 属性: 每个对象显示的图标由其属性决定。
以下示例使用降雨状态时间序列,结合颜色和图标样式,可视化太平洋西北地区哪些气象站在选定日期观测到降雨。
![]()
图像媒体项
属性选项支持媒体引用类型的对象属性,并将底层媒体显示为图标。图像媒体引用是图标唯一支持的媒体格式。
旋转
您可以通过任意基于值的样式选项来控制图标的旋转。对于轨迹几何数据源,还有自动选项,可根据轨迹将图标沿对象移动方向旋转。
以下示例使用固定箭头图标和旋转样式,显示船舶对象的移动方向。
![]()
标记形状
图标可配置三种标记样式:
| 圆形 | 图钉 | 无 |
|---|---|---|
|
|
|
圆形配置
每个圆形以提供的位置为中心绘制,半径值可在样式设置的半径部分配置。
其他圆形样式选项与多边形显示选项相同。
加载方法
当显示大量对象时,图标和圆形显示也支持基于瓦片的加载方法。