Timeline geometries(时间轴几何图形)
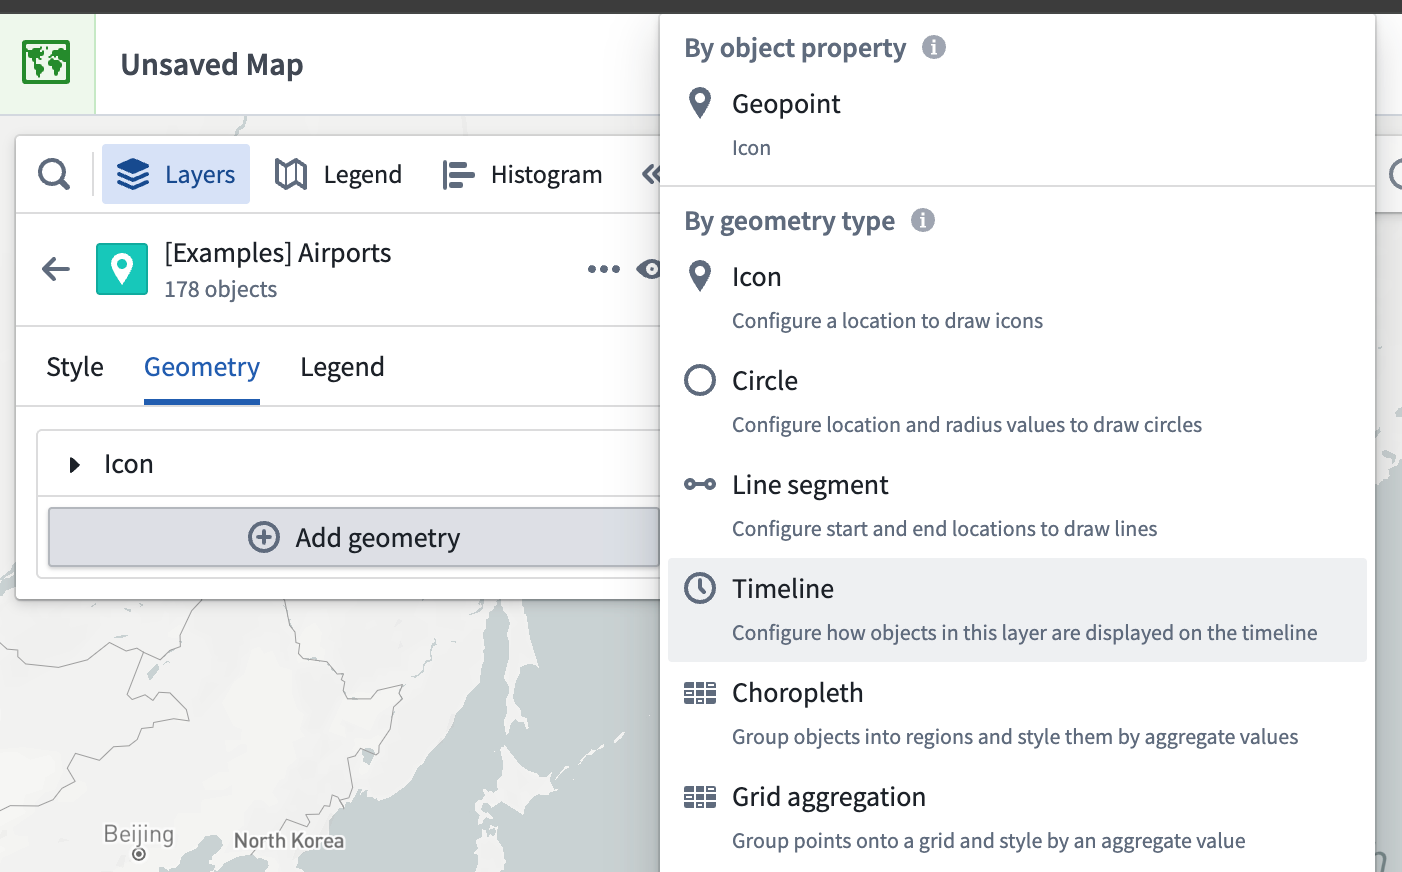
To visualize time-based properties of all objects in a layer on the timeline, you can configure a timeline geometry to appear on the timeline.
![Timeline geometry example where a user can see the time properties of the '[Example] Airports' object on the timeline.](https://palantir.com/docs/resources/foundry/map/styling-timeline-event.png)
Timeline geometries differ from event objects, as you can configure multiple timeline geometries per object layer and apply additional styling options, such as property-based color shading.
Once you add a timeline geometry, you can access its additional configuration actions from the geometry's entry in the timeline legend.
Styling
To make a new timeline event geometry layer appear on the timeline, add a Timeline geometry from the Layers panel.
A Timeline section appears in the style menu once you add the timeline geometry, where you can change the properties used when drawing the selected shape on the timeline. Select the Start property and End property dropdown menus for shapes that use two time properties, or select Time property for shapes that use a single property.
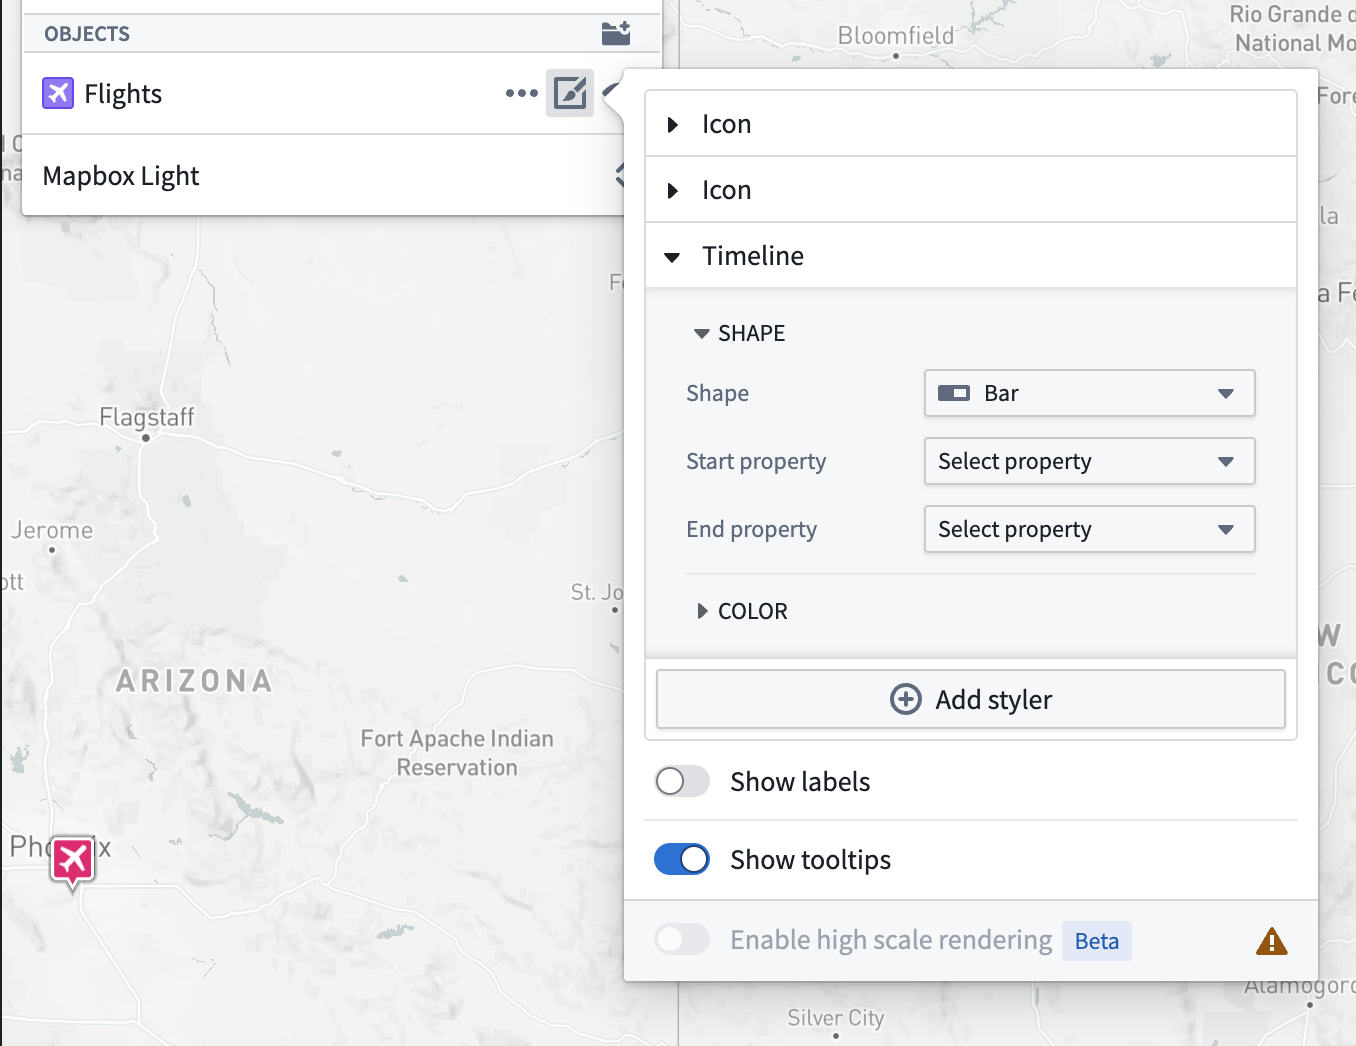
The timeline geometry will not appear in the timeline unless all its properties have been set.
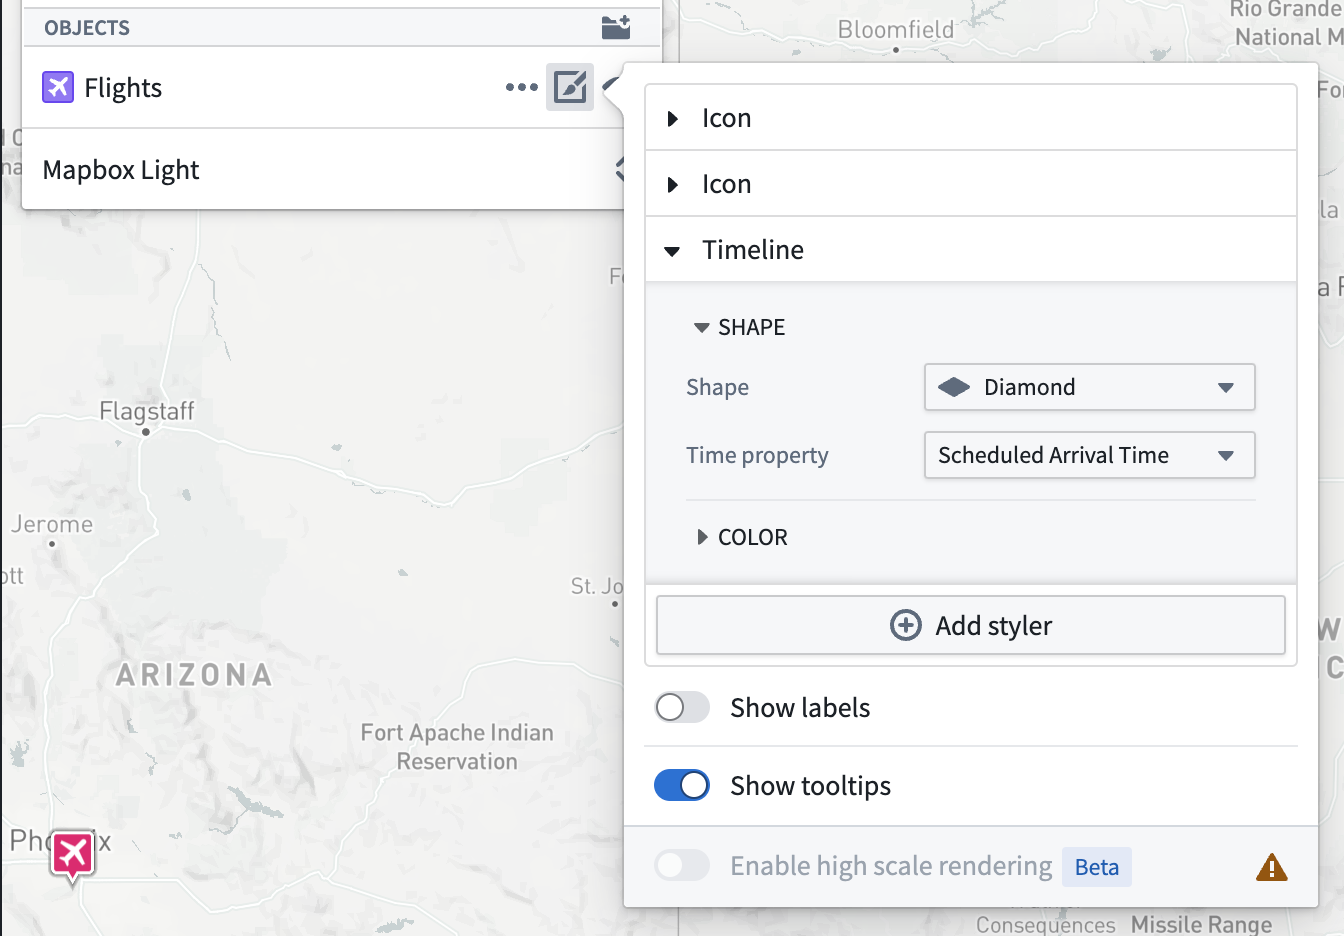
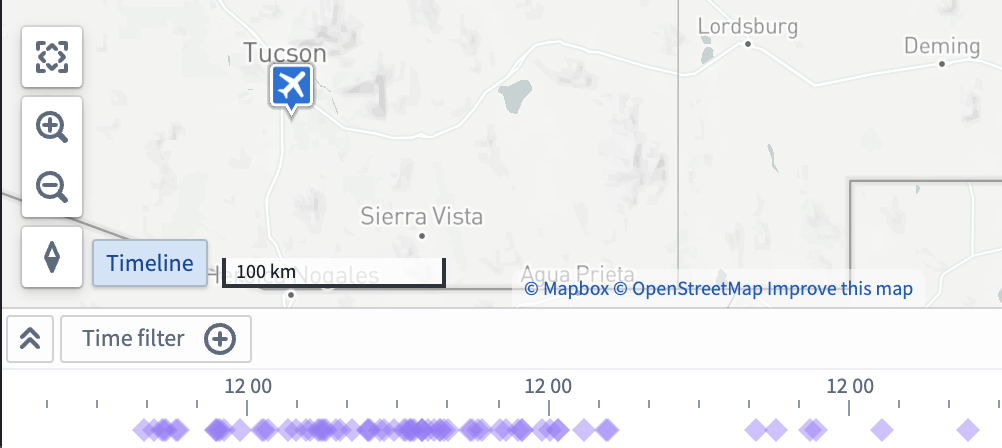
The Shape you choose in the Timeline style configuration section renders for every instance of the object type in the timeline. For example, the image below shows diamond shapes to represent the Flights object type on the timeline.
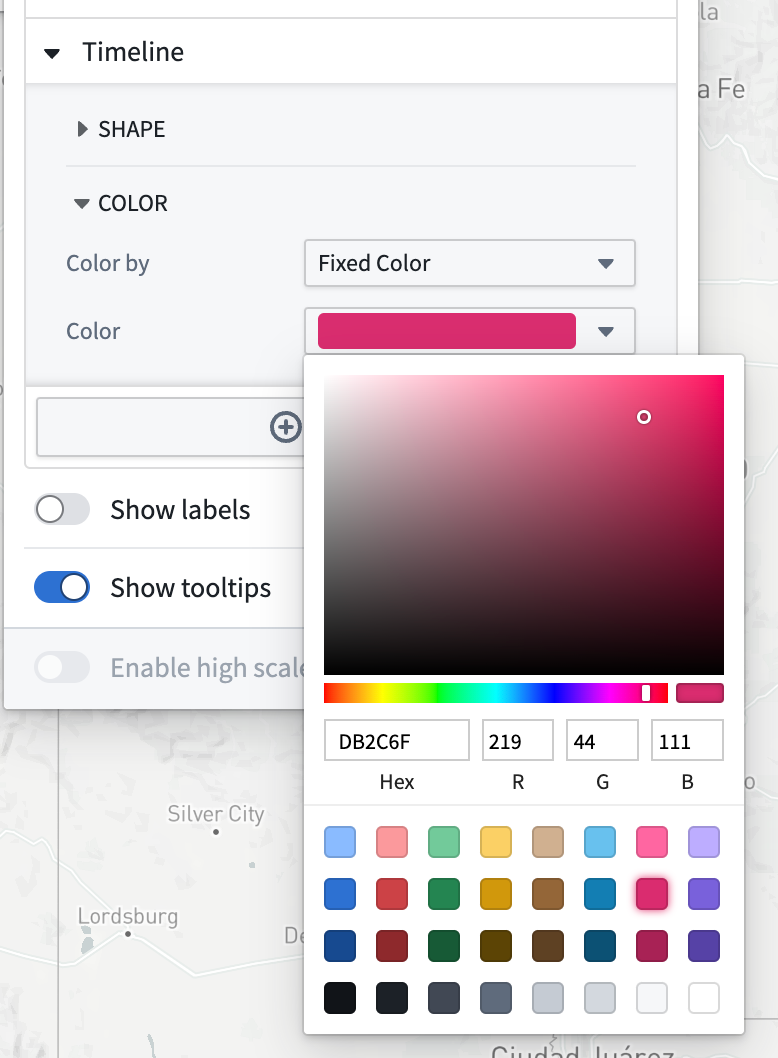
Select the Color menu in the Geometry section to configure how shape colors render on your map's timeline.
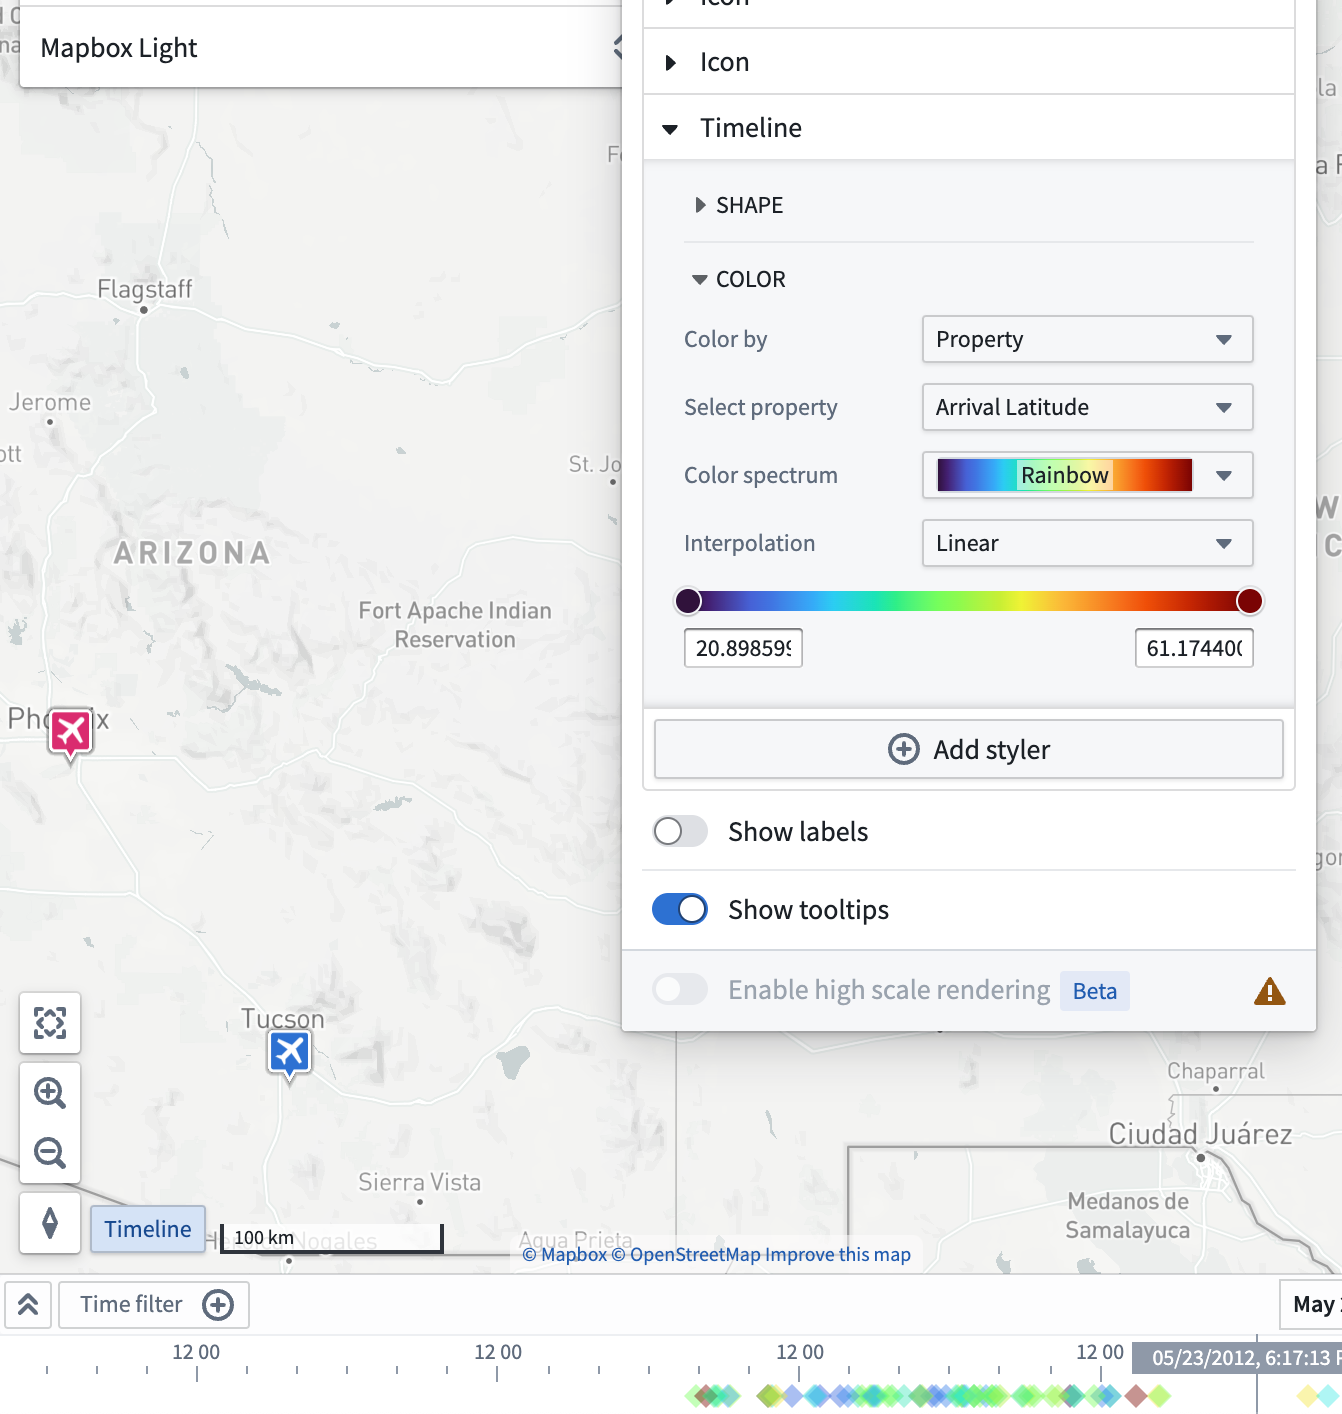
You can also use properties and measures to configure timeline color styling by changing the selected option in the Color by dropdown menu. For example, the image below shows a timeline geometry configured to color by the Arrival Latitude property with a rainbow color spectrum.
中文翻译
时间轴几何图形
要可视化图层中所有对象在时间轴上的时间属性,您可以配置一个时间轴几何图形,使其显示在时间轴上。
时间轴几何图形与事件对象不同,因为您可以为每个对象图层配置多个时间轴几何图形,并应用额外的样式选项,例如基于属性的颜色渐变。
添加时间轴几何图形后,您可以通过时间轴图例中该几何图形的条目访问其附加配置操作。
样式设置
要使新的时间轴事件几何图形图层显示在时间轴上,请从图层面板中添加一个时间轴几何图形。
添加时间轴几何图形后,样式菜单中会出现一个时间轴部分,您可以在其中更改在时间轴上绘制所选形状时使用的属性。对于使用两个时间属性的形状,请选择起始属性和结束属性下拉菜单;对于使用单个属性的形状,请选择时间属性。
除非所有属性均已设置,否则时间轴几何图形不会显示在时间轴上。
您在时间轴样式配置部分中选择的形状会为时间轴中该对象类型的每个实例进行渲染。例如,下图显示了用菱形形状表示时间轴上的航班对象类型。
选择几何图形部分中的颜色菜单,以配置形状颜色在地图时间轴上的渲染方式。
您还可以通过更改颜色依据下拉菜单中的选定选项,使用属性和度量来配置时间轴颜色样式。例如,下图显示了一个时间轴几何图形,配置为根据到达纬度属性使用彩虹色光谱进行着色。