Track displays(轨迹显示)
Maps include displays for rendering objects that move over time. These displays are designed to help you visualize the paths that objects take and the patterns that emerge as objects move across the map.
All track displays have the ability to use time-based opacity styling. In addition to the track displays below, you can also use a track geometry source as the way to position icons and circles. Learn more about configuring tracks in the Ontology.
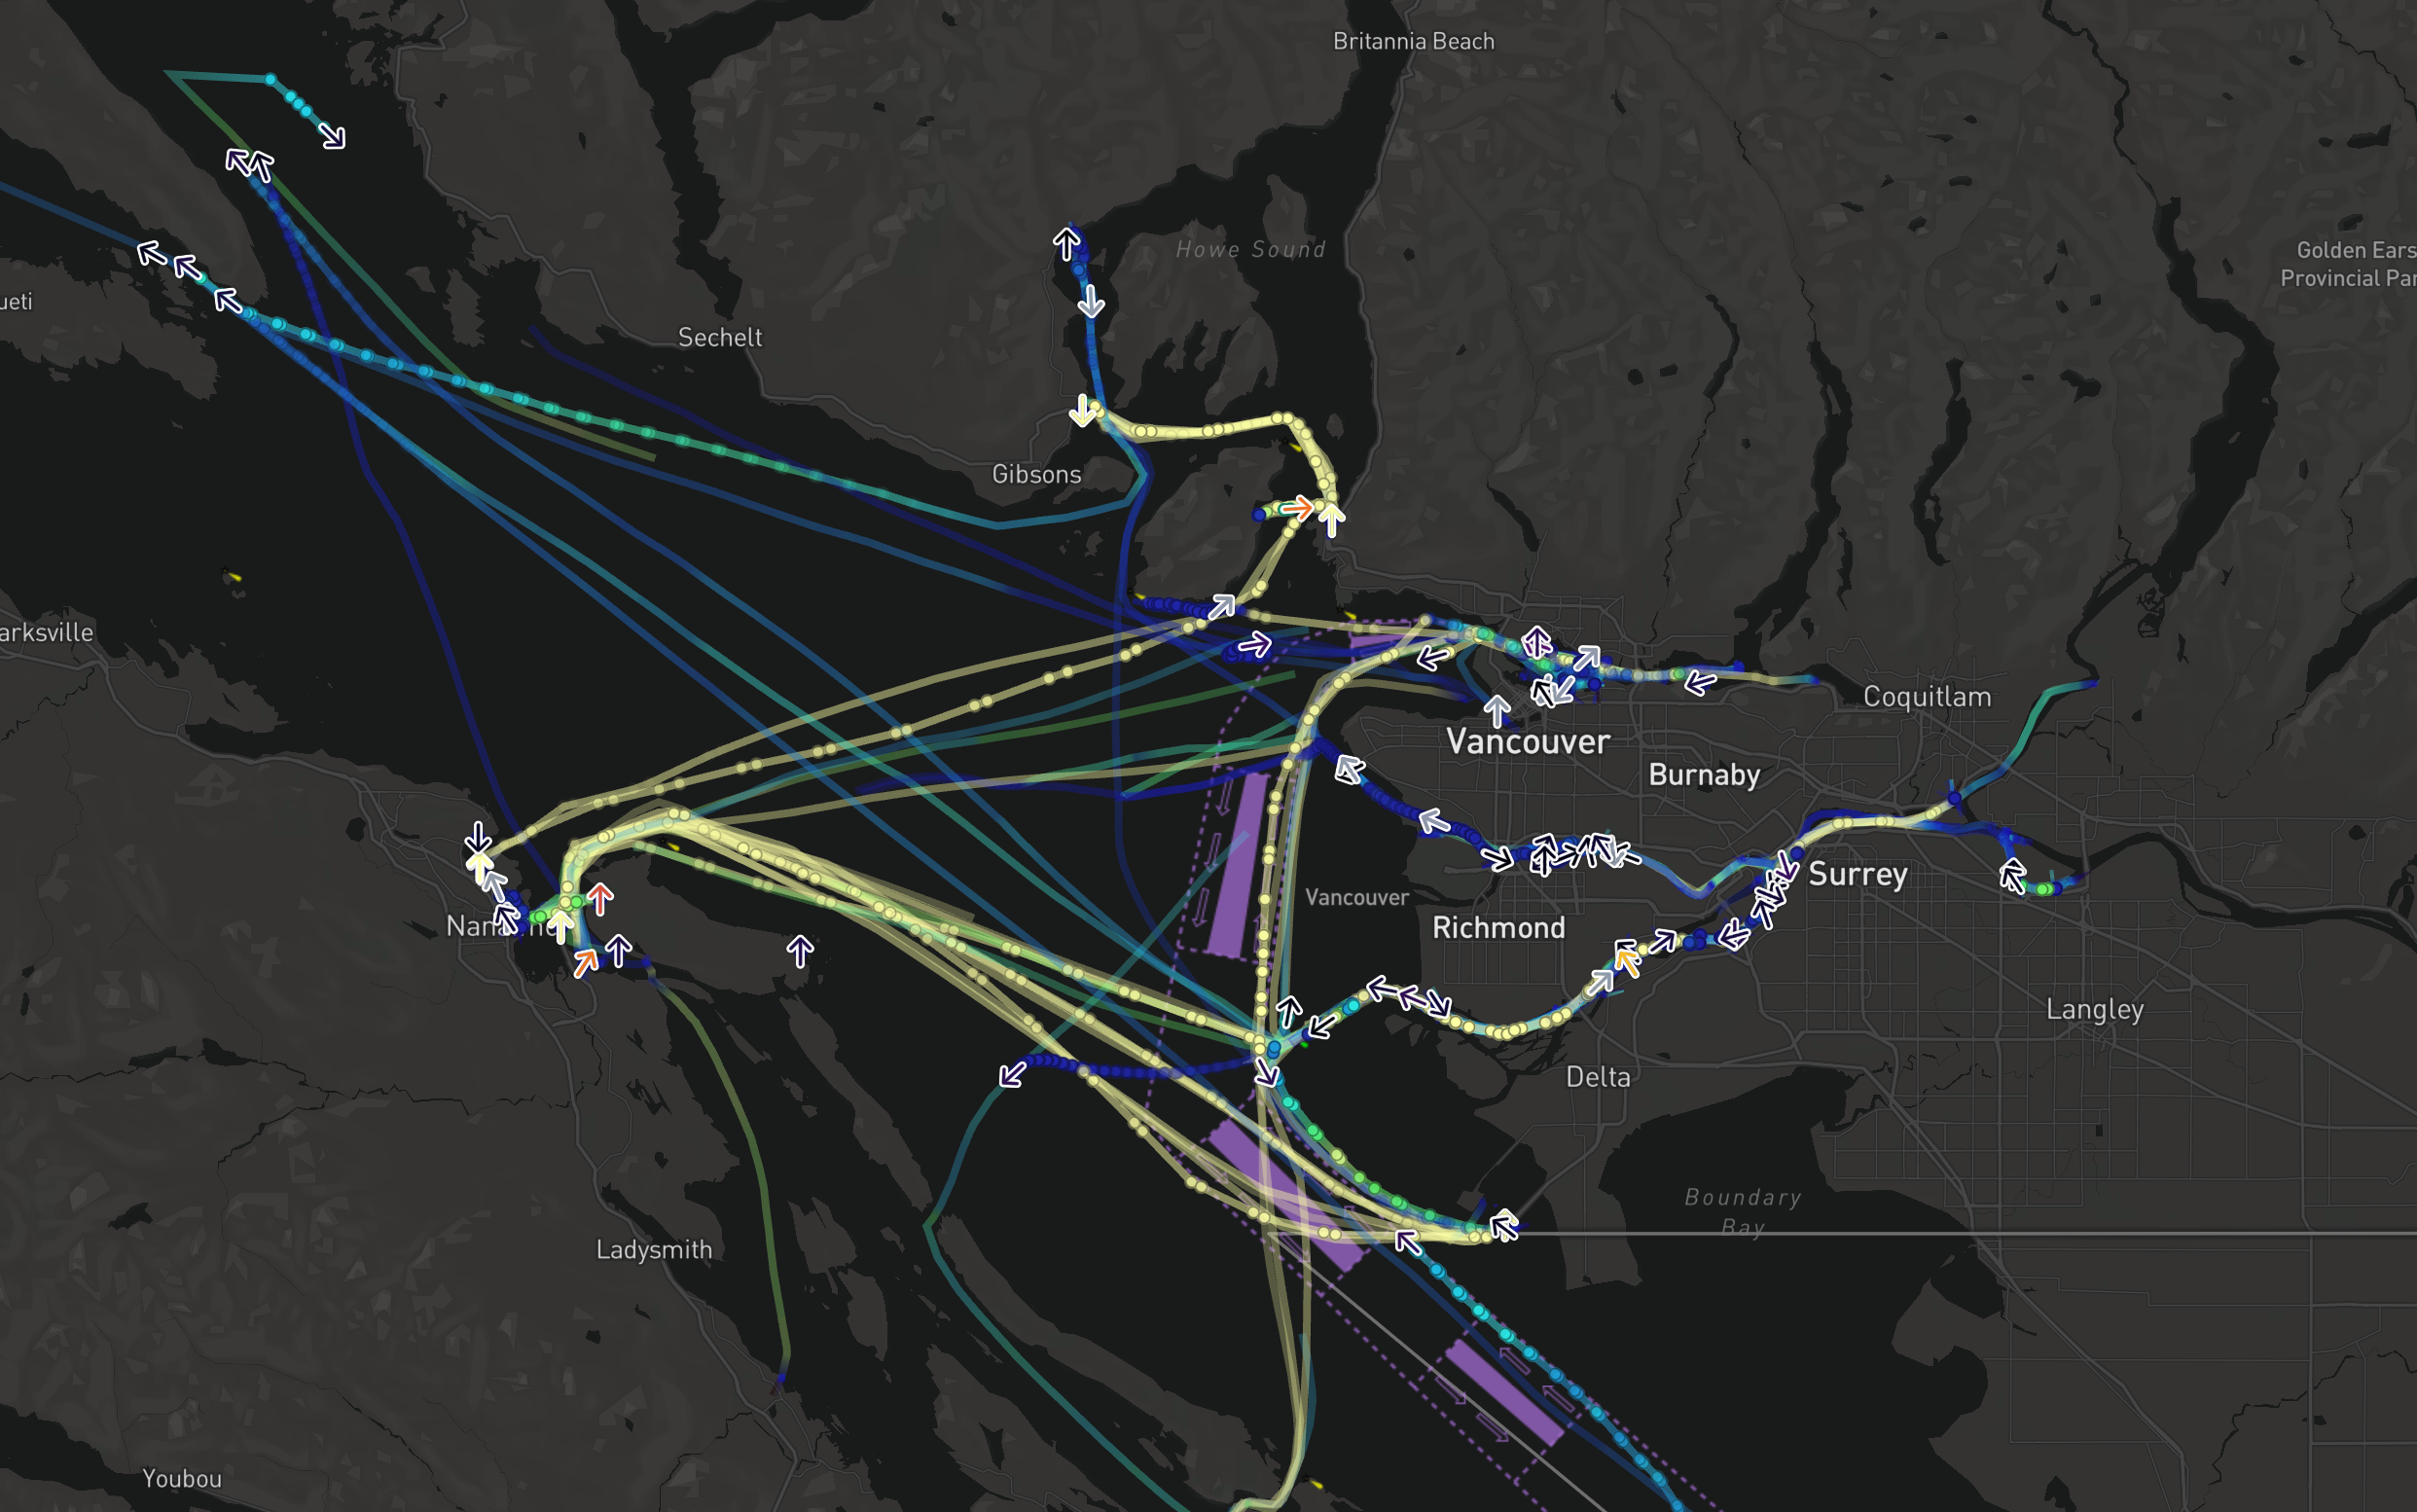
The notional example below uses a track geometry source to display a track line, breadcrumbs, and icon at the current position for vessel objects moving near the City of Vancouver:
You can also configure the number of time series points per track in Control Panel on an organization-level or per-map in the settings menu.
Moving geometry interpolation
When using tracks as a geometry source, there are additional options you can use to configure how the map interprets the point location from the track and the selected time.
- Interpolation mode
- Linear: Smoothly interpolate between known points in the track.
- Last known: Show the object at the last recorded position before the selected time.
- Max time gap: When two consecutive track points have a time difference greater than the value configured, the track is considered as having no data for that time period.
Track lines
Track lines visualize the paths that objects take by connecting adjacent recorded positions with a line. If two points have a time difference greater than the configured Max time gap, the line will not be drawn between those points. Otherwise, track lines have the same styling options as lines.
Track breadcrumbs
Track breadcrumbs are a way to visualize only the exact recorded positions of an object. Each object's track is rendered as a series of small circles, or breadcrumbs, that show the object's location at different times. Otherwise, breadcrumbs have the same styling options as circles.
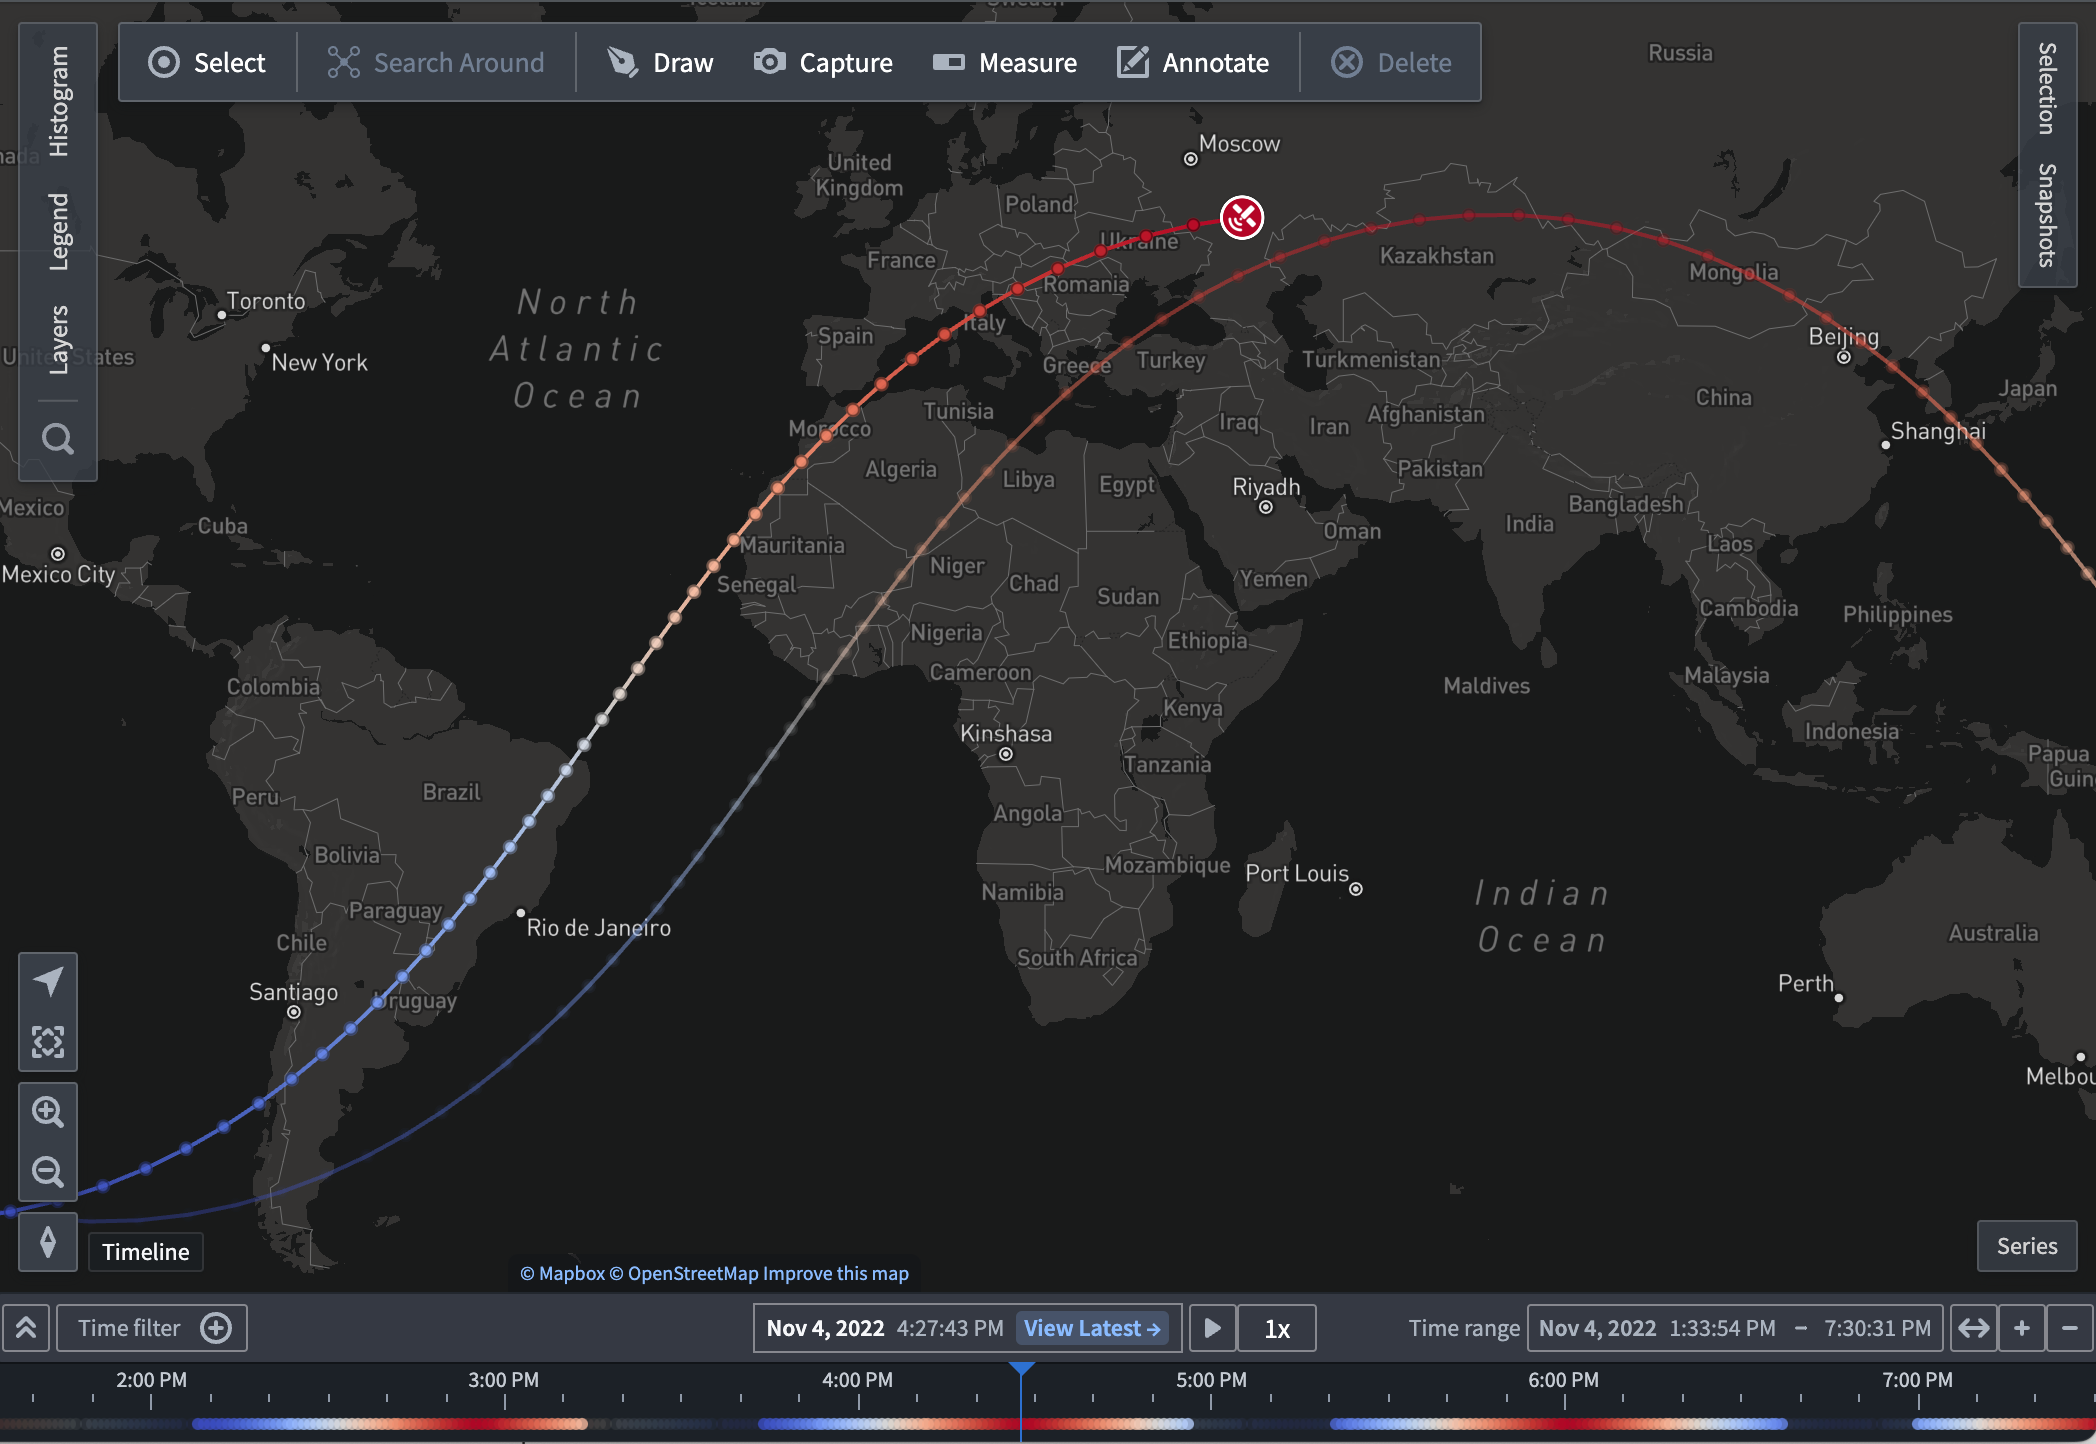
Track breadcrumbs also display in the timeline to allow you to see the exact time at which object positions were recorded. This example visualizes a satellite's ground trace, and colors the line and breadcrumbs by the latitude of the satellite at every point. The breadcrumbs in the timeline also reflect that color style configuration.
Breadcrumbs that are not visible in the map viewport are faded out to help you to understand the object path over time and at what time ranges the object will be visible on the map.
:::callout{theme="neutral"} If there are no breadcrumbs in the current time range, they will not appear on the map or timeline. :::
Once you add track breadcrumbs, you can access the geometry's additional configuration actions from the its entry in the timeline legend.
Styling
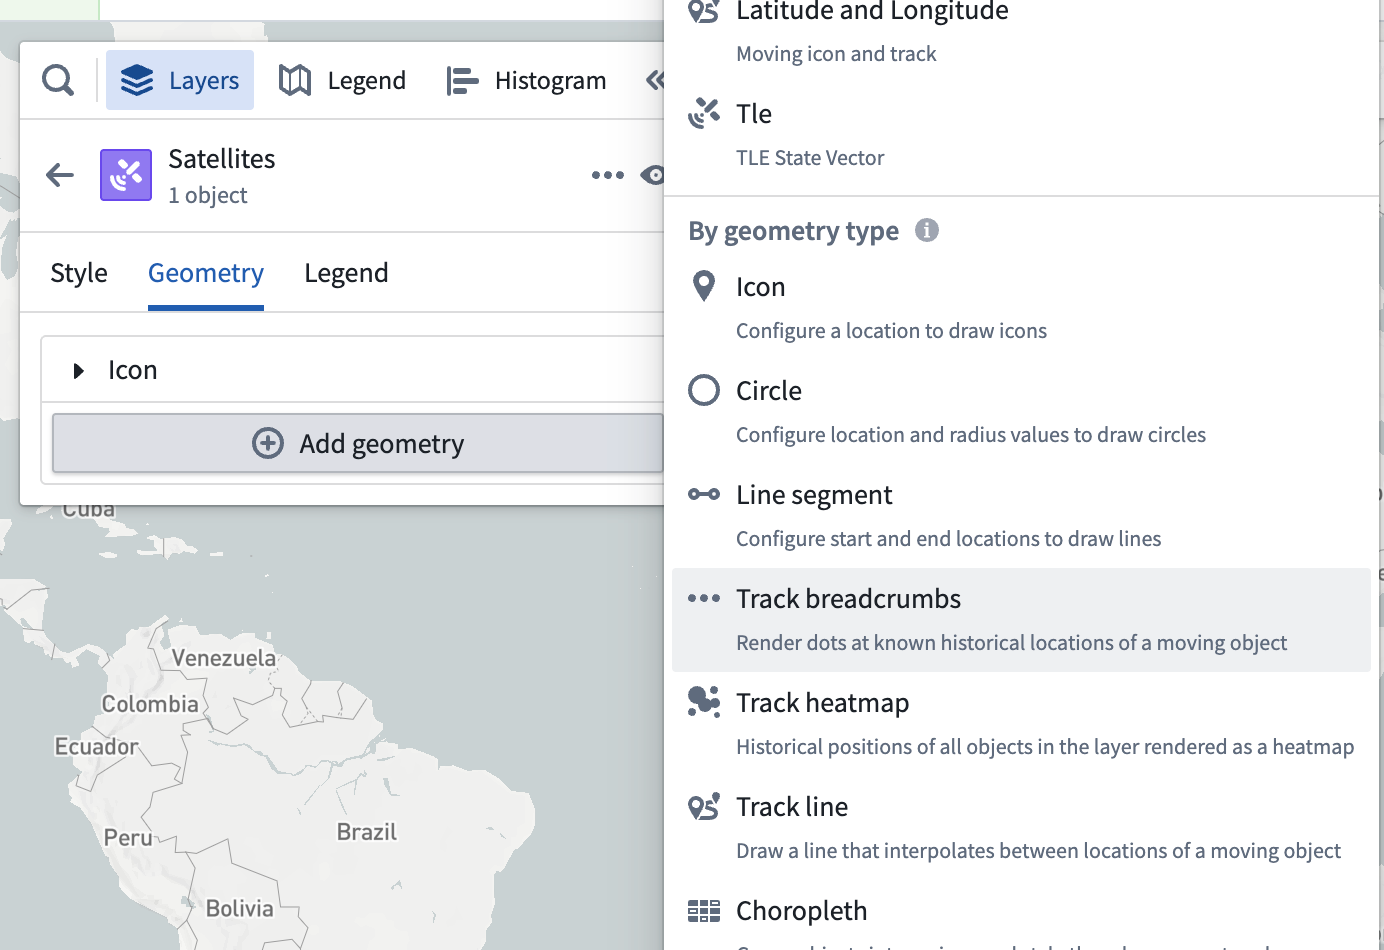
To make a new track breadcrumb geometry layer appear on the timeline, add a breadcrumb geometry from the Layers panel.
Once the track breadcrumbs geometry is added, a Track breadcrumbs section will appear in the style menu. You can change the properties used when drawing the selected path on the map.
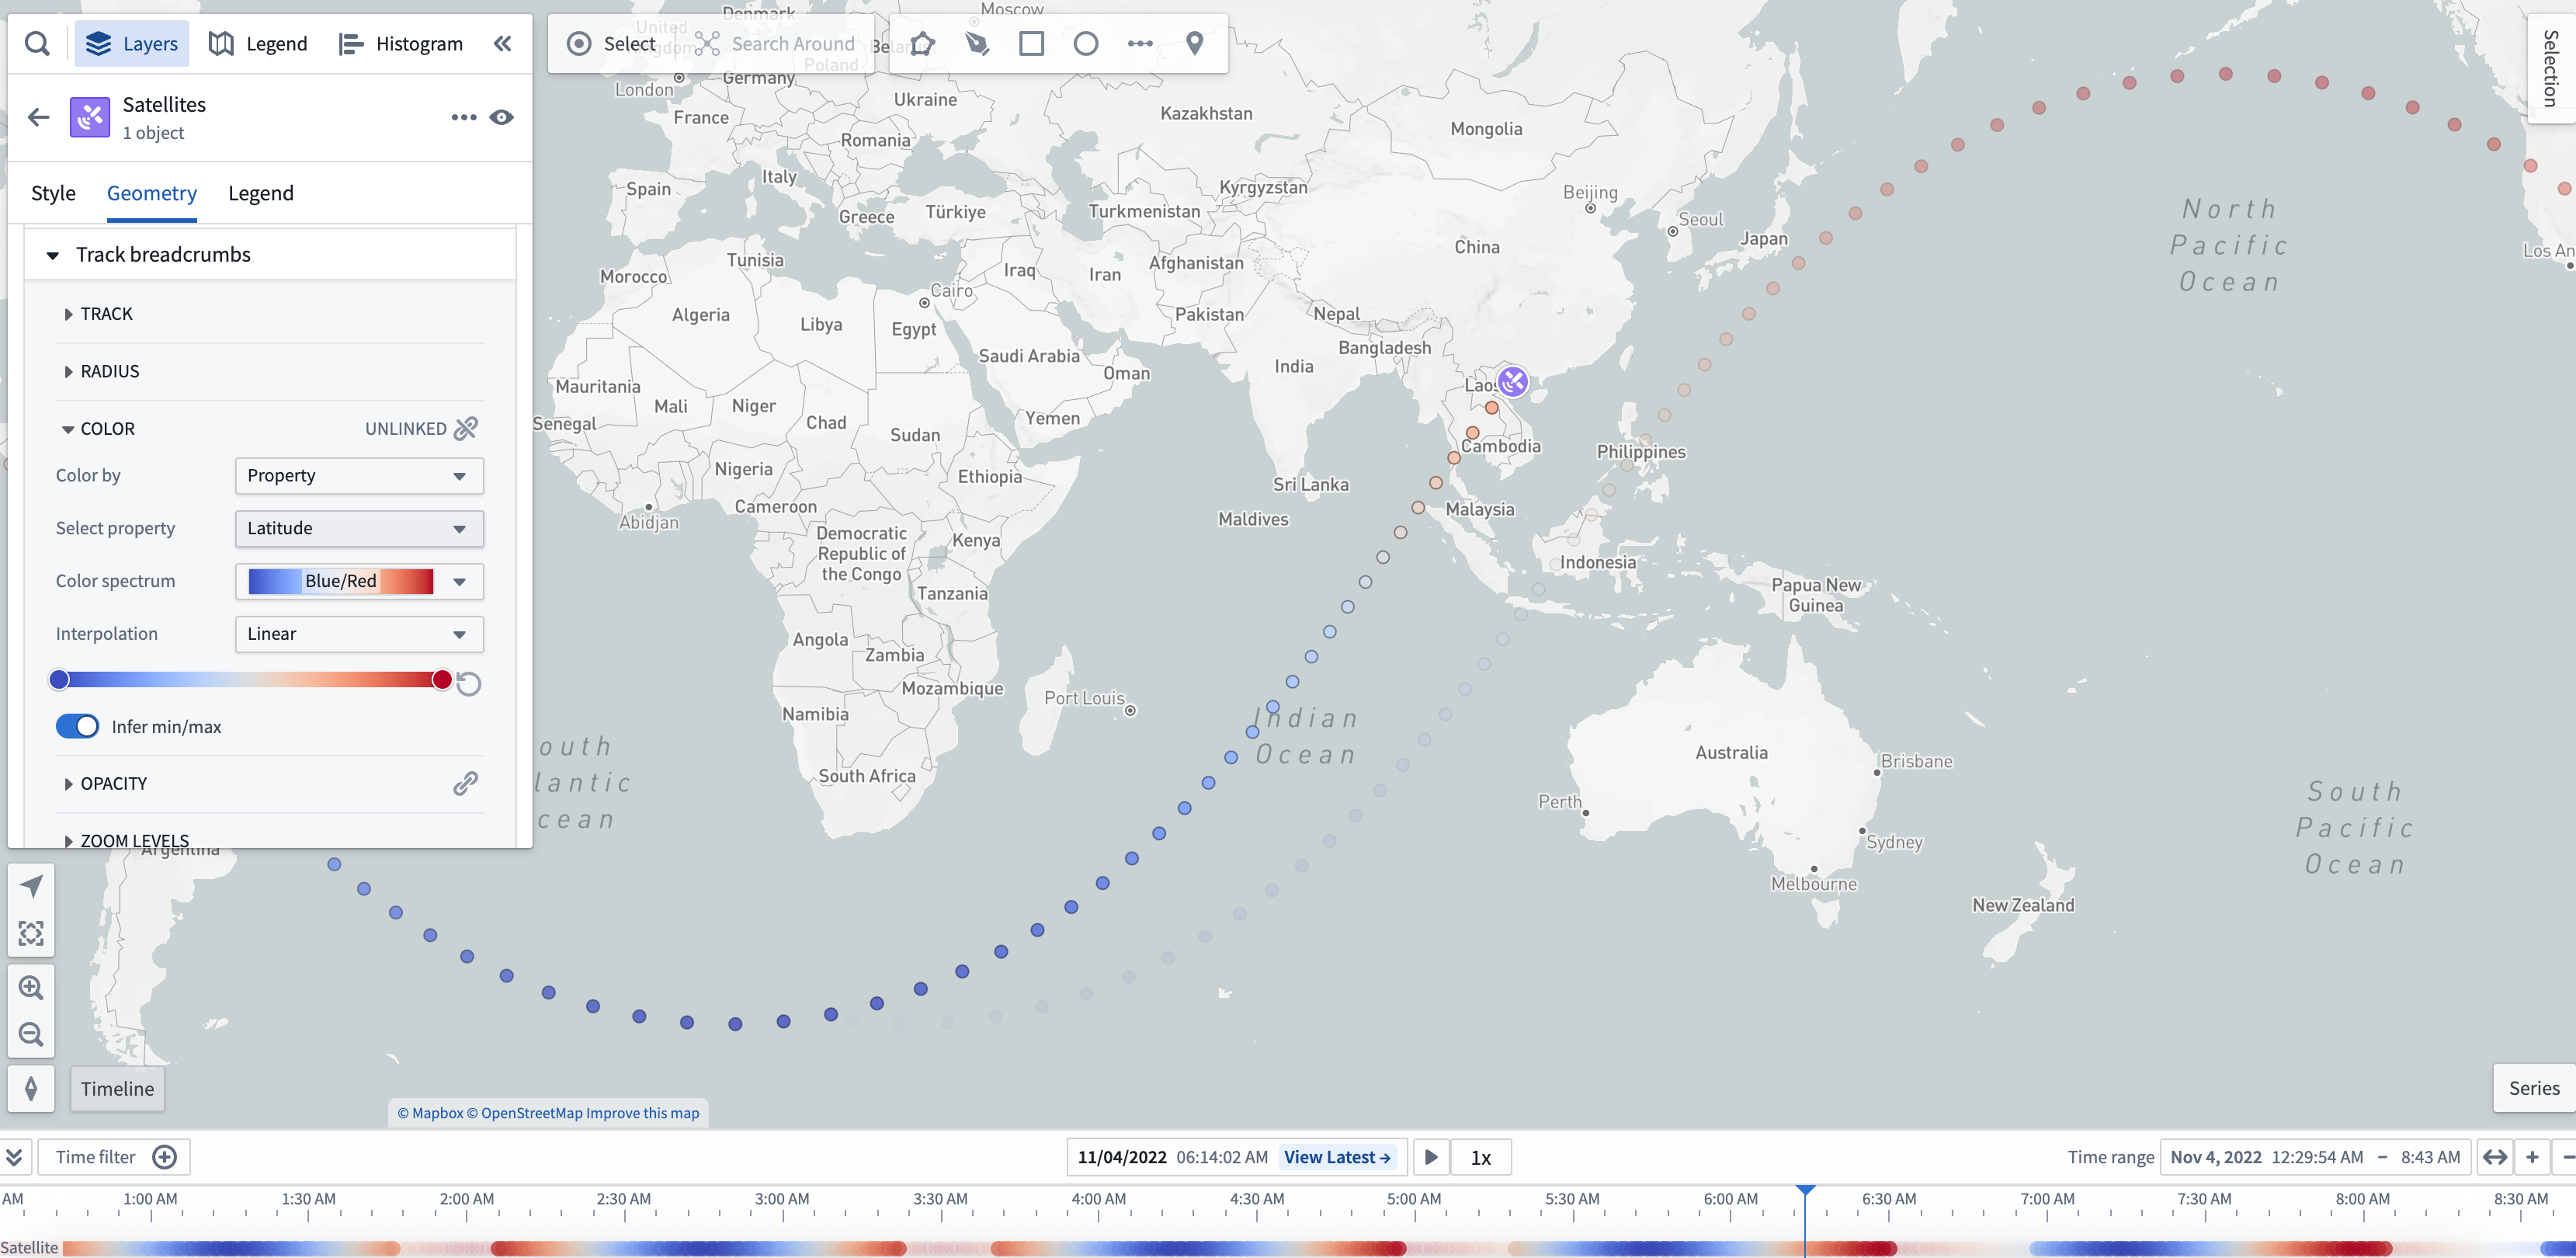
Select the Color menu in the Track breadcrumb geometry to configure how shape colors are represented on your timeline.
You can also use properties and measures to configure track breadcrumbs color styling by changing the selected option in the Color by dropdown menu. For example, the image below is configured to color by the Latitude property with a rainbow color spectrum:
中文翻译
轨迹显示
地图包含用于渲染随时间移动的对象的显示方式。这些显示旨在帮助您可视化对象移动的路径,以及对象在地图上移动时形成的模式。
所有轨迹显示都支持使用基于时间的不透明度样式。除以下轨迹显示外,您还可以使用轨迹几何源(track geometry source)来定位图标和圆形。了解如何在 Ontology 中配置轨迹。
以下示例使用轨迹几何源显示轨迹线、轨迹点(breadcrumbs)以及当前位置的图标,用于展示在温哥华市附近移动的船舶对象:
您还可以在控制面板中配置每条轨迹的时间序列点数量,可在组织级别或每个地图的设置菜单中进行设置。
移动几何插值
当使用轨迹作为几何源时,您可以使用其他选项来配置地图如何从轨迹和选定时间中解读点位置。
- 插值模式(Interpolation mode)
- 线性(Linear): 在轨迹中的已知点之间平滑插值。
- 最后已知(Last known): 在选定时间之前,显示对象在最后记录位置的状态。
- 最大时间间隔(Max time gap): 当两个连续轨迹点的时间差大于配置值时,该时间段内的轨迹将被视为无数据。
轨迹线
轨迹线通过用线条连接相邻的记录位置,可视化对象移动的路径。如果两个点的时间差大于配置的最大时间间隔,则不会在这两点之间绘制线条。除此之外,轨迹线的样式选项与线条相同。
轨迹点
轨迹点是一种仅可视化对象精确记录位置的方式。每个对象的轨迹被渲染为一系列小圆形(即轨迹点),显示对象在不同时间点的位置。除此之外,轨迹点的样式选项与圆形相同。
轨迹点也会显示在时间轴中,让您能够看到对象位置被记录的确切时间。以下示例可视化了一颗卫星的地面轨迹,并根据每个点的卫星纬度对线条和轨迹点进行着色。时间轴中的轨迹点也反映了该颜色样式配置。
在地图视口中不可见的轨迹点会淡出显示,以帮助您理解对象随时间变化的路径,以及对象在地图上可见的时间范围。
:::callout{theme="neutral"} 如果当前时间范围内没有轨迹点,则它们不会出现在地图或时间轴上。 :::
添加轨迹点后,您可以从时间轴图例中的几何条目访问其附加配置操作。
样式设置
要使新的轨迹点几何图层出现在时间轴上,请从图层面板添加一个轨迹点几何。
添加轨迹点几何后,样式菜单中将出现轨迹点部分。您可以更改在地图上绘制选定路径时使用的属性。
选择轨迹点几何中的颜色菜单,以配置形状颜色在时间轴上的表示方式。
您还可以通过更改颜色依据下拉菜单中的选项,使用属性和度量来配置轨迹点的颜色样式。例如,下图配置为根据Latitude属性使用彩虹色谱进行着色: