Charts(图表(Charts))
The Charts tab in your Insight workbook provides an out-of-the-box visualization for each property in the analysis path. Eight properties are shown by default and can be modified using the Edit property card layout panel found by selecting the gear icon in the top right corner.
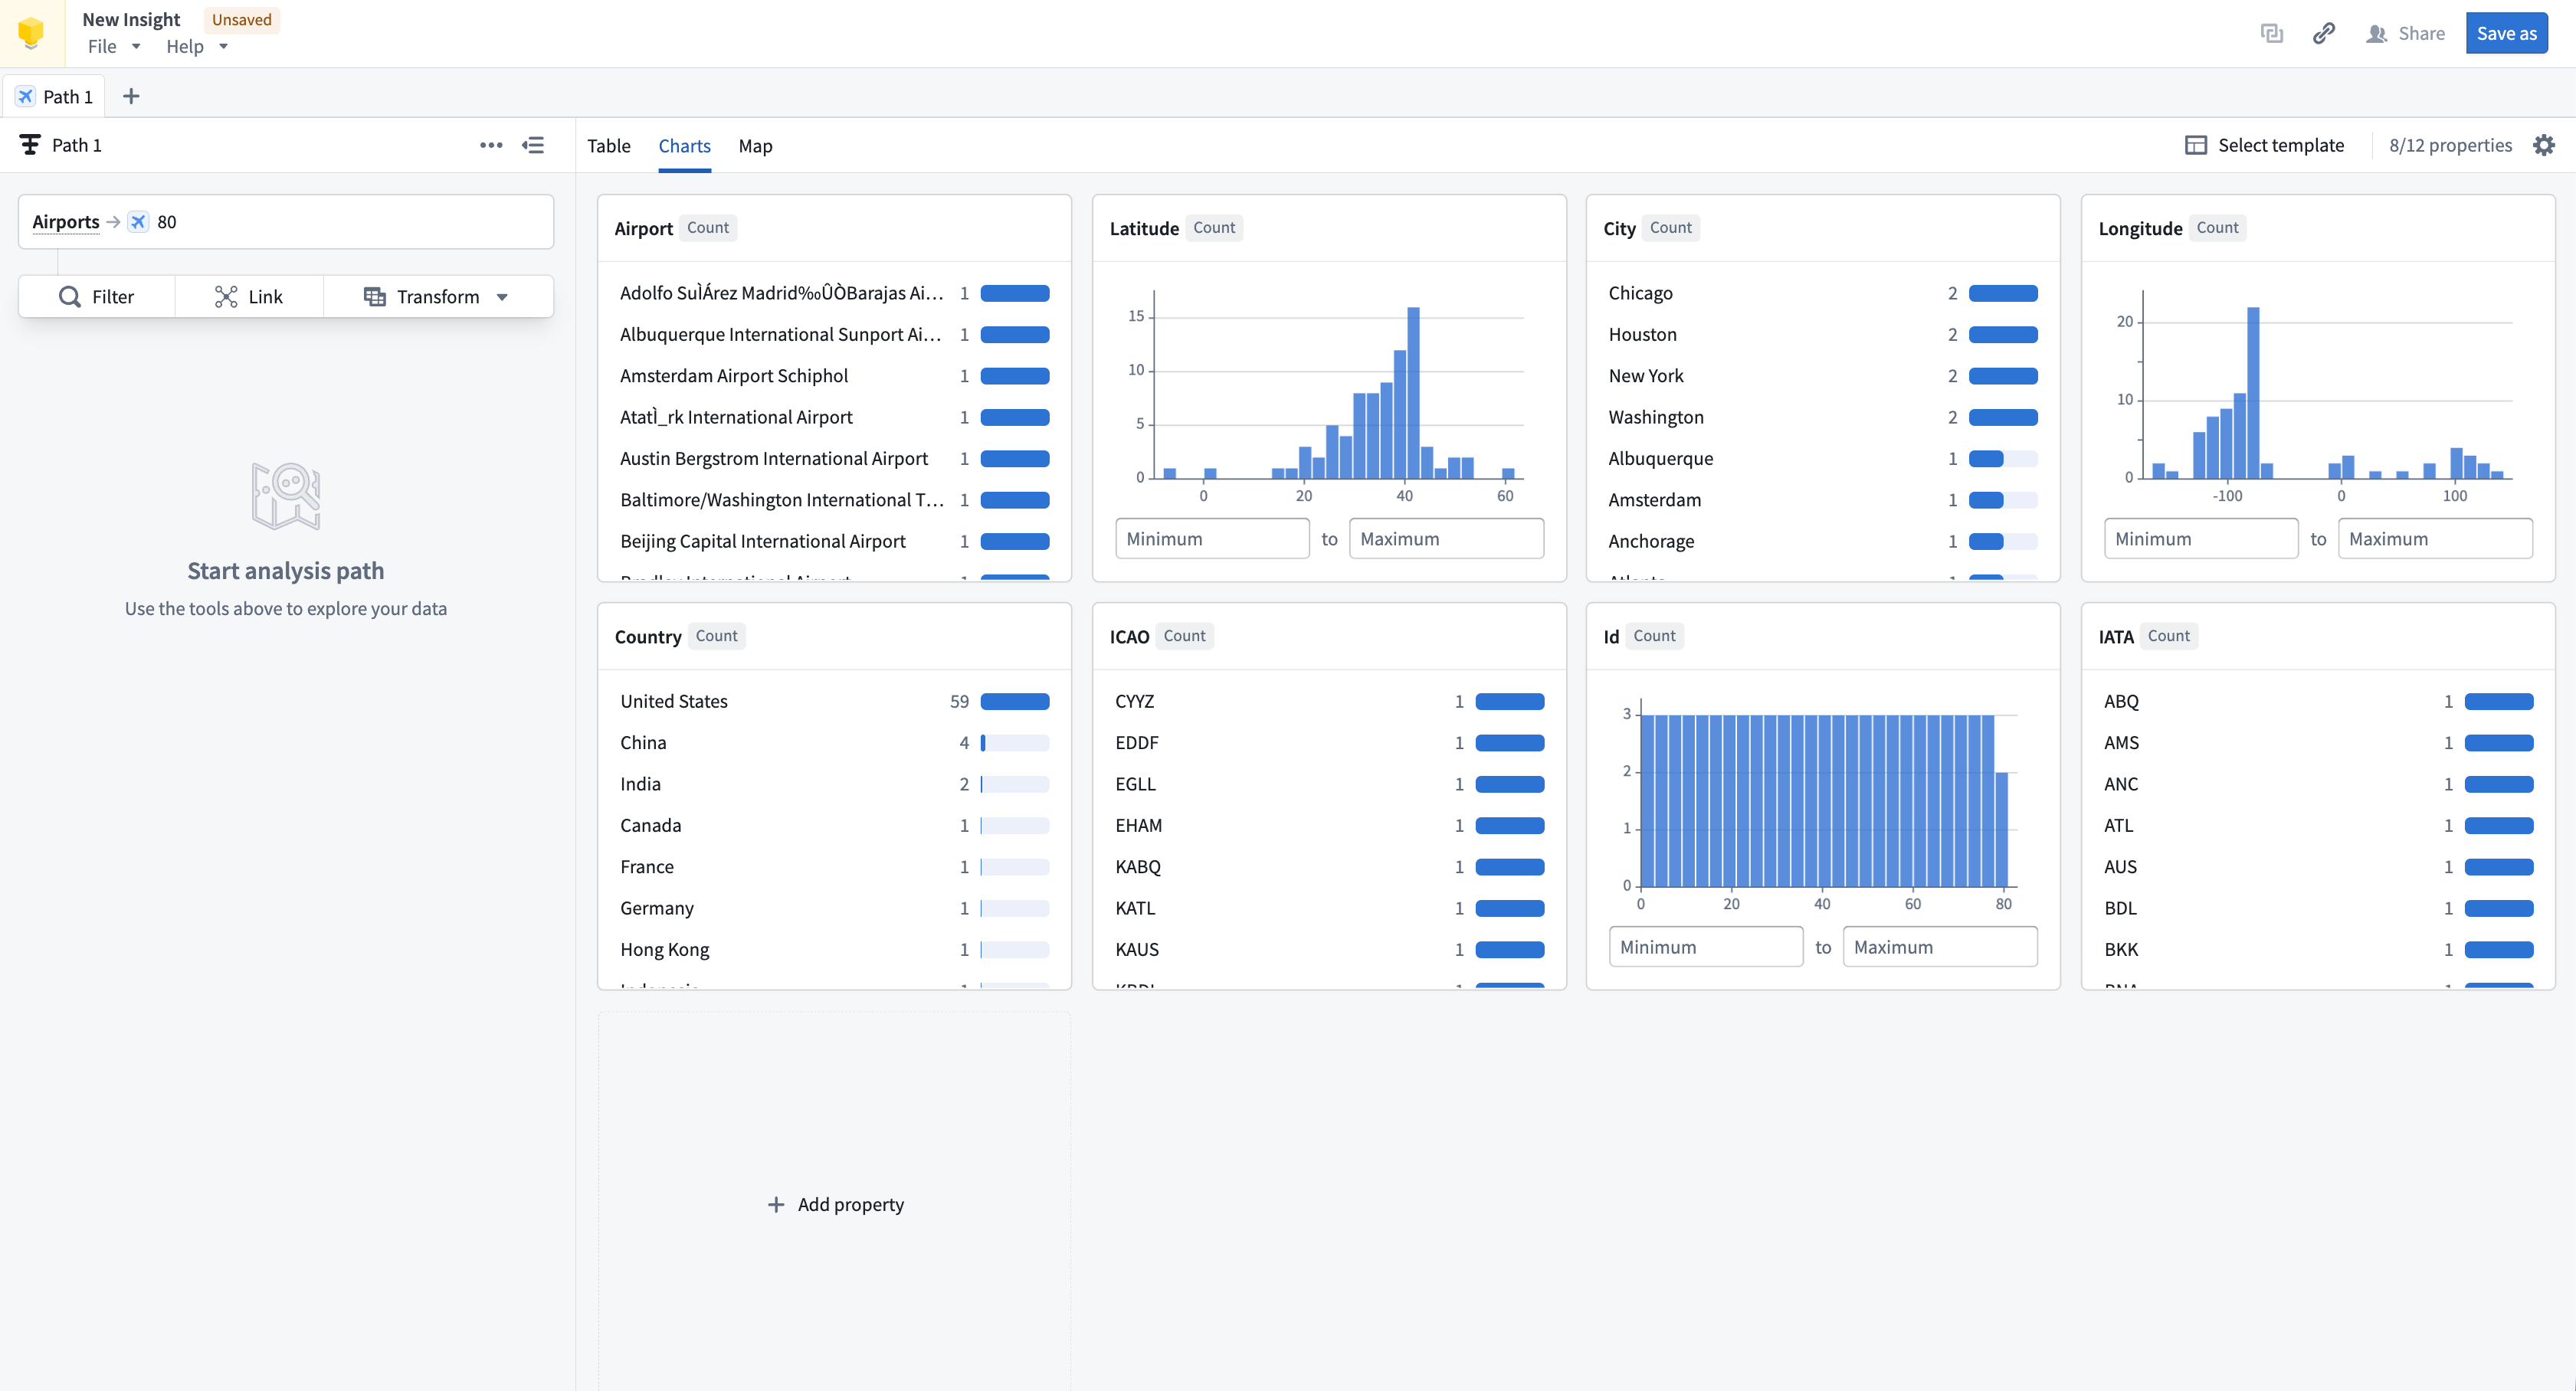
Charts provide a quick visual summary of all properties in the analysis path. When combined with saved layouts, the charts section can be configured as a shareable dashboard view. Charts can also be used to filter data; selecting a chart provides the option to apply it as a filter. Chart cards can be repositioned within the layout, and charts will resize responsively based on browser or screen size.
Manage charts
Charts are uniform in size by default but can be extended to double their width or height. Charts can also be reordered by dragging them to the preferred position.
Types of charts
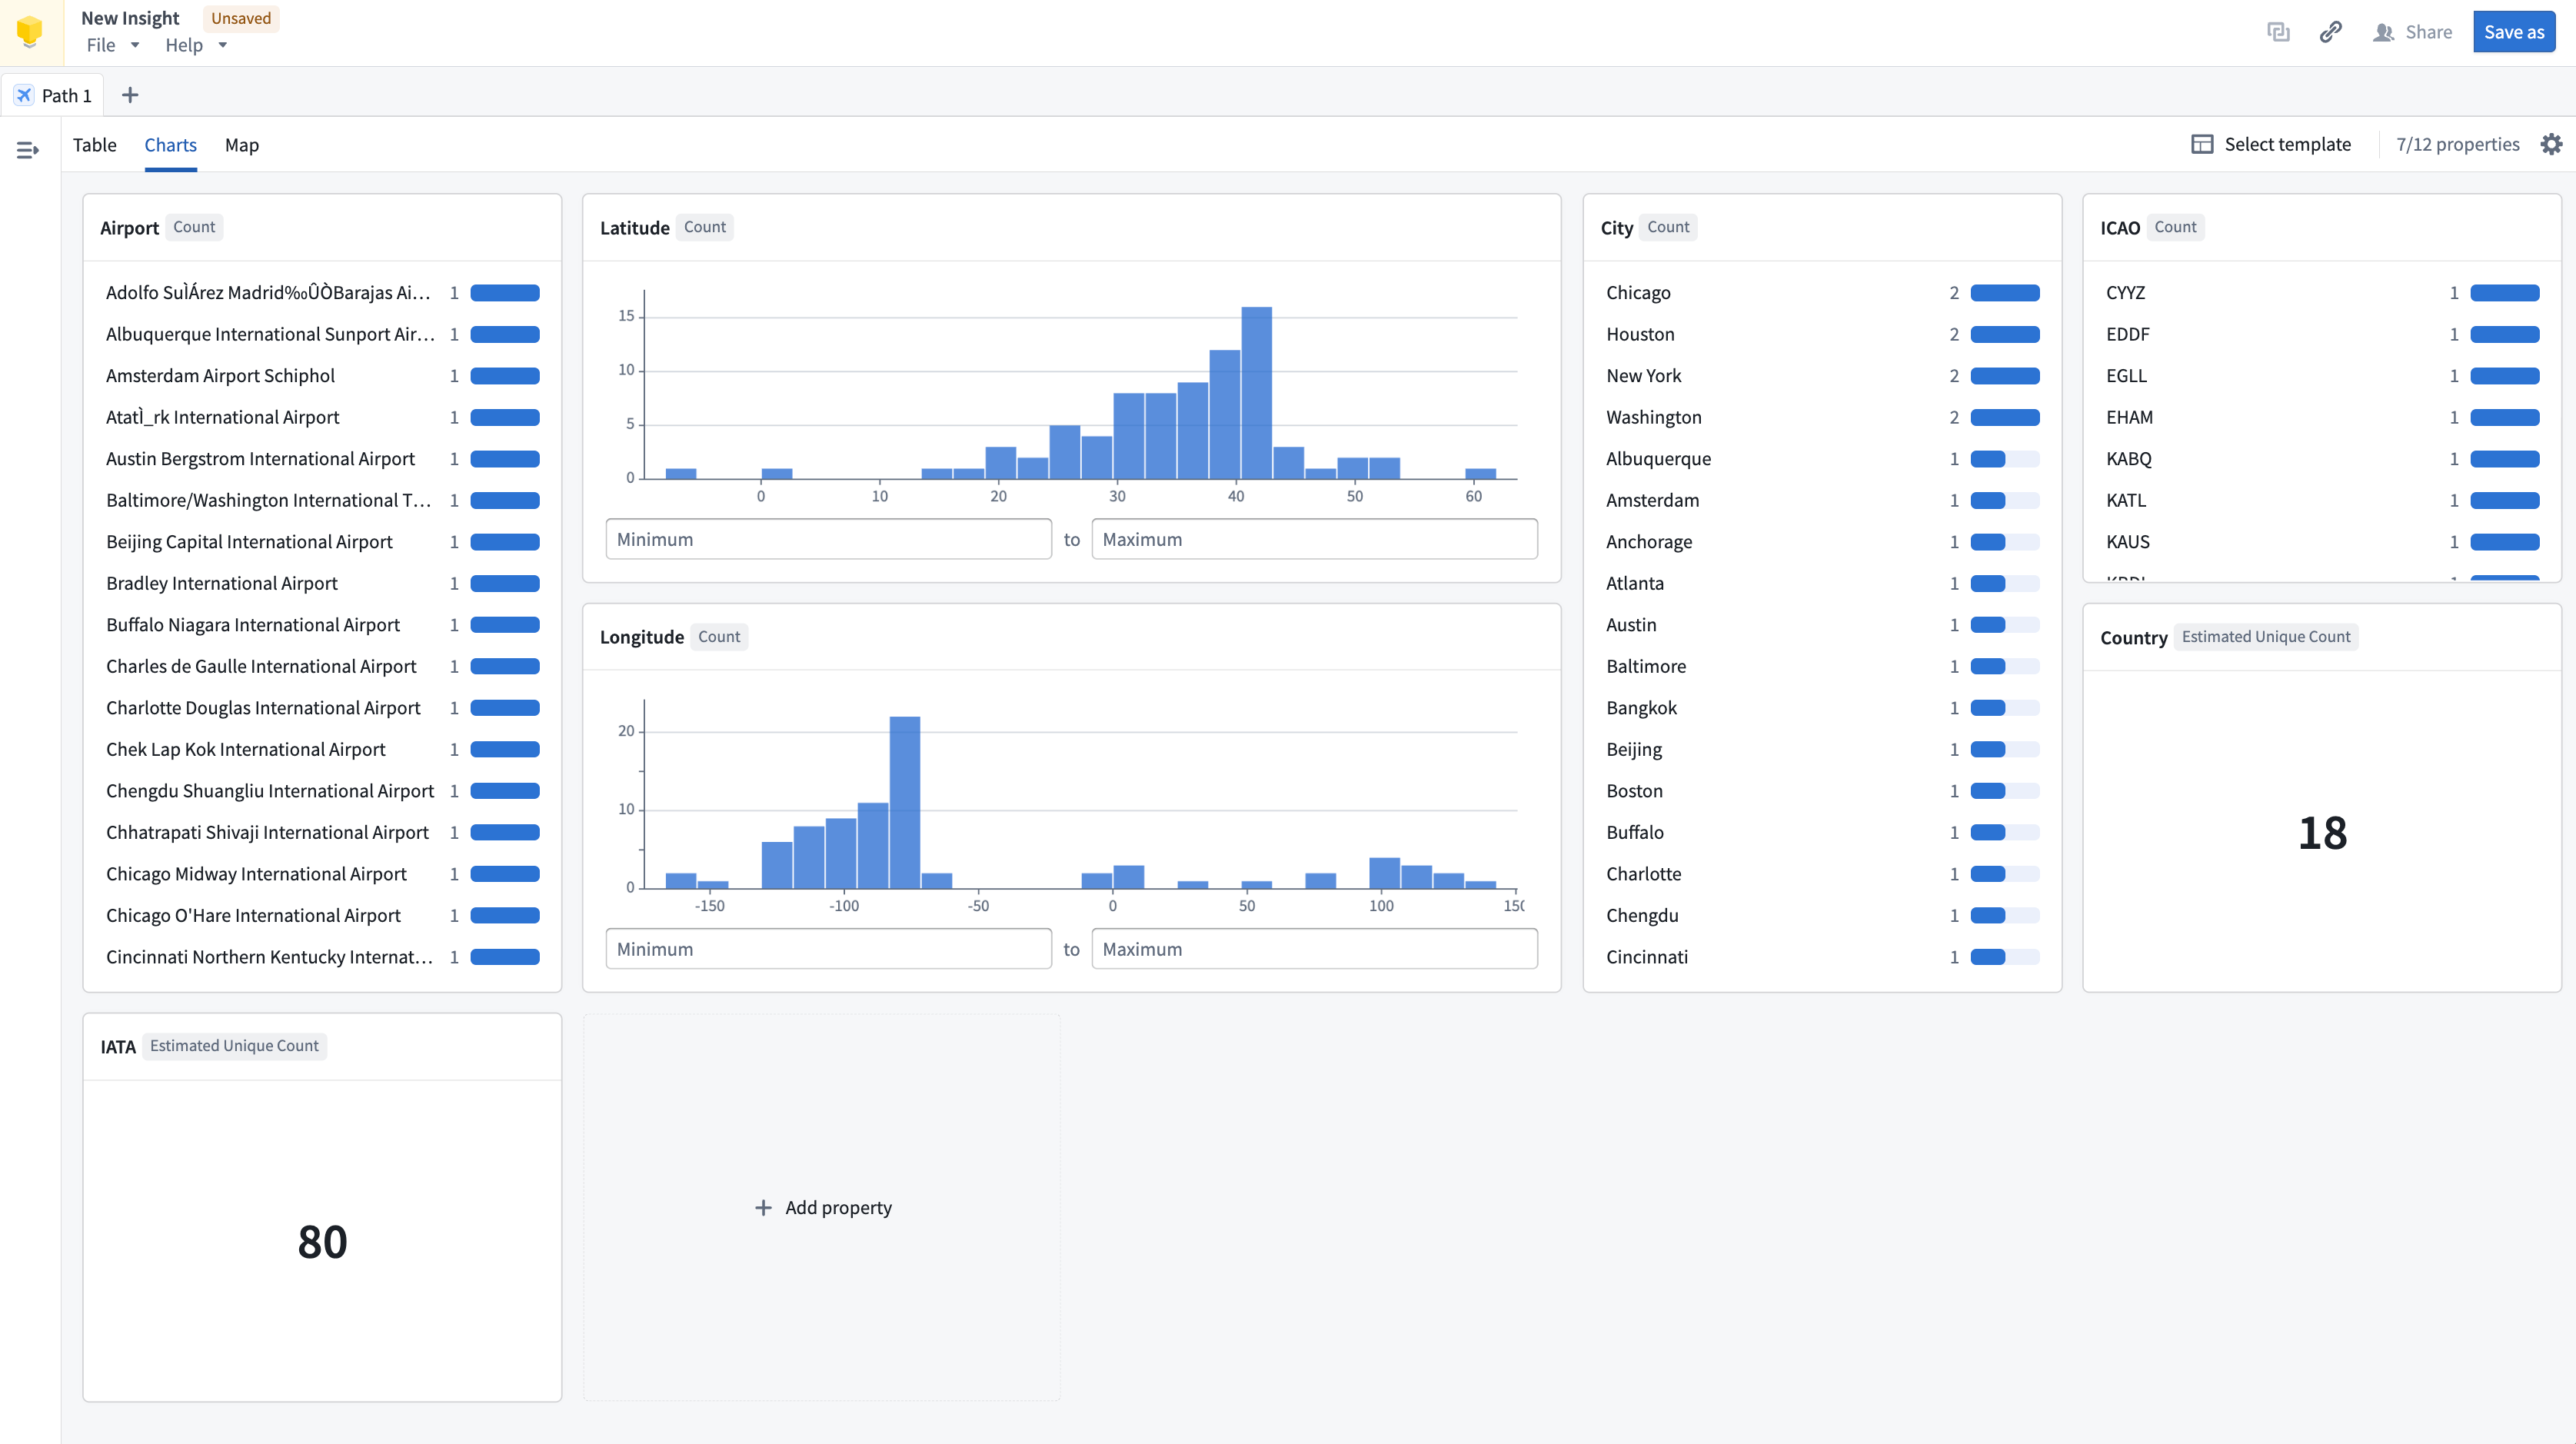
The chart type available depends on the property type:
- String: Histogram and single stat of count
- Numeric: Distribution and single stat with aggregation options
- Timestamp/date: Distribution
- Geographic properties: Not supported in charts. View geographic properties in the Map tab.
- Struct/array of structs: Not supported in charts
- Media reference: Not supported in charts. View media references in the Table tab.
中文翻译
图表(Charts)
在 Insight 工作簿的图表(Charts)选项卡中,系统会为分析路径中的每个属性提供开箱即用的可视化展示。默认显示八个属性,可通过点击右上角的齿轮图标,使用编辑属性卡片布局(Edit property card layout)面板进行修改。
图表可快速提供分析路径中所有属性的视觉摘要。结合已保存的布局,图表部分可配置为可共享的仪表盘视图。图表还可用于筛选数据:选择某个图表后,可将其作为筛选条件应用。图表卡片可在布局中重新调整位置,并且图表会根据浏览器或屏幕尺寸自适应调整大小。
管理图表(Manage charts)
默认情况下图表尺寸统一,但可将其宽度或高度扩展至两倍。图表也可通过拖拽至目标位置来重新排序。
图表类型(Types of charts)
可用的图表类型取决于属性类型:
- 字符串(String): 直方图(Histogram)和计数单值统计(single stat of count)
- 数值(Numeric): 分布图(Distribution)和带聚合选项的单值统计(single stat with aggregation options)
- 时间戳/日期(Timestamp/date): 分布图(Distribution)
- 地理属性(Geographic properties): 图表中不支持。请在地图(Map)选项卡中查看地理属性。
- 结构体/结构体数组(Struct/array of structs): 图表中不支持
- 媒体引用(Media reference): 图表中不支持。请在表格(Table)选项卡中查看媒体引用。