Embed a graph in a Workshop module(在 Workshop 模块中嵌入图)
Graphs, graph templates, and diagrams can be embedded in Workshop modules, allowing users to interact with Vertex visualizations directly within Workshop workflows. This integration enables powerful data exploration and visualization experiences as part of broader Workshop modules.
Graph templates can be passed parameter values directly from Workshop variables, enabling dynamic data-driven visualization experiences that update based on user interactions or workflow state.
There are three main steps to embed a template in a Workshop module:
Add a Vertex graph widget in Workshop
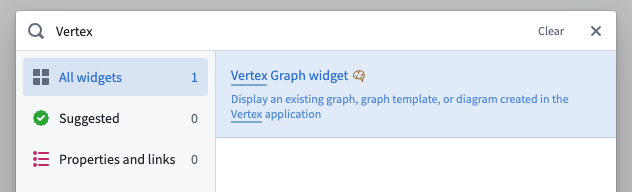
In a section of your choice in the Workshop module, click the + icon or the +Add widget button to open the widget menu, and search for the Vertex Graph widget.
Choose a resource
In the widget editor, choose the graph, graph template or diagram resource you want to embed by clicking Select. Only compatible resources will show in the resource selector.
Configure the widget
For the Vertex graph widget, configuration is organized into several sections. Each section controls different aspects of the widget's behavior and appearance.
Input
The Input section controls the displayed graph or template and how it receives data.
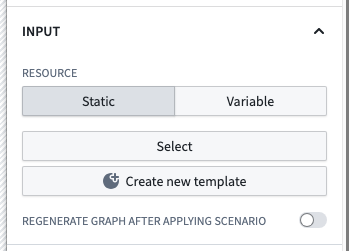
- Resource
- Static: When this resource mode is selected, a single input resource is chosen using a resource picker. This can be a graph, graph template, or diagram.
- Variable: When this resource mode is selected, the input resource is provided by a string variable which should contain a graph, graph pointer or graph template RID.
- Override graph RID: (Optional) If the chosen resource is a graph template, you can provide a graph RID to display instead of generating a graph using the template and its parameters. This allows loading an existing graph from an RID saved in a property on an object. Refer to the saving and sharing graph explorations section for more details.
- Parameters
- When embedding a graph template, you can supply values for template parameters using Workshop variables. Each parameter defined in the template will appear here for configuration.
- For object type parameters, select an object set variable from Workshop.
- For non-object parameters, provide appropriate values based on the parameter type.
- Sub-graph
- When embedding an existing graph or diagram resource with multiple sub-graphs, you can choose which sub-graph to display by selecting an object set variable from Workshop that contains any object from that sub-graph.
- Refresh key
- Whenever this variable's value changes, the widget will perform a complete reload of the graph. This is useful for triggering refreshes based on workflow state changes.
- Append on parameter change
- When enabled, changing the parameters will append new objects to the existing graph instead of regenerating it from scratch.
- Scenario
- Load data from scenario: Enable this toggle to load the given resource using a scenario instead of the base Ontology.
- Regenerate graph after applying scenario: When set, the graph will be refreshed after each scenario modification.
:::callout{theme="neutral"} Previously, template inputs were supplied using a single input object set variable that contained all of the required object types defined in the graph template. This is now discouraged, as it only works for templates without non-object parameters and one object parameter per object type. If you wish to use this feature, select the Use legacy input object set checkbox and supply an object set variable. :::
Interaction
The Interaction section configures how users interact with the graph and how the graph interacts with other Workshop components.
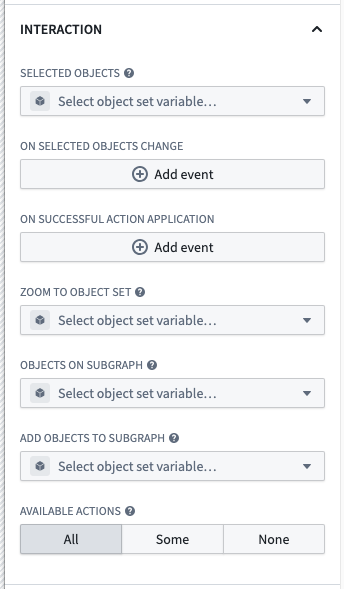
- Selected objects
- This option outputs an object set of the currently selected object(s). This object set can then be used in downstream widgets within the current module.
- When a user selects objects in the graph, this variable will be automatically populated with the selection.
- On selected objects change
- Configure Workshop events to trigger when the selected objects on the graphs change.
- This can be used to open a drawer with a more detailed view of the selected objects, trigger a refresh of another widget, or any other Workshop event action.
- On successful action application
- Configure Workshop events to trigger when a user successfully applies an action in the graph.
- This event fires after the underlying action is executed successfully.
- Zoom to object set
- Sets the viewport to display the objects in the given object set whenever the inputs change.
- This allows you to programmatically focus the graph on specific objects.
- Objects on subgraph
- Outputs an object set containing all the objects on the currently selected subgraph.
- This is useful for capturing all objects visible on the current view for use in other widgets.
- Add objects to subgraph
- Adds the given objects to the currently selected subgraph.
- This allows you to programmatically add objects to the graph from other widgets.
- Available actions
- Controls which actions are available to users directly within the graph interface.
- Options include:
- All: All actions on any object on the graph are available.
- Some: Only the specifically selected actions are available.
- None: No actions are available.
Time Configuration
The Time configuration section controls how time is represented and interacted with in the graph.
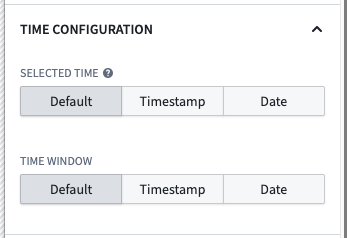
- Selected time
- Controls the selected time on the graph.
- The selected time determines any readouts from temporal data displayed on the graph or in the selection panel.
- Selecting a time is only available when one of the timeline, the time selection panel or the series panel are enabled.
- The selected time defaults to the time the graph is loaded.
- Options:
- Default: Time selection is not synchronized using a variable.
- Timestamp variable: Synchronize graph visuals with a Workshop variable of type
Timestamp. - Date variable: Synchronize graph visuals with a Workshop variable of type
Date.
- Time window
- Controls the time window used on the graph. The time window determines the range of data displayed on any temporal charts.
- Selecting a time window is only available when one of the timeline, the time selection panel or the series panel are enabled.
- The default time window is configured in Control Panel.
- Options:
- Default: The time window is not synchronized with a variable.
- Timestamp: Define a time window using two Workshop variables of type
Timestamp. - Start: The beginning of the time window.
- End: The end of the time window.
- Date: Define a time window using two Workshop variables of type
Date. - Start: The beginning of the time window.
- End: The end of the time window.
Capabilities
The Capabilities section controls the functional features that are available to users of the widget.
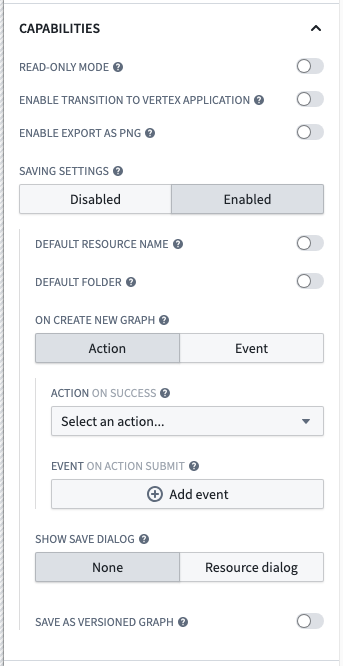
- Read-only mode
- When enabled, this setting removes editing capabilities and hides the editing toolbar.
- This is useful for creating view-only visualizations where users should not be able to modify the graph.
- Enable transition to Vertex application
- When enabled, this displays a button allowing users to open the Vertex application with their current graph state.
- This provides a seamless transition from the embedded graph in Workshop to the full Vertex application for more advanced operations.
- Enable export as PNG
- When enabled, this allows users to export the current graph as a PNG image.
- Users need to have frontend export permissions on the embedded resource to use this feature.
- Saving settings
- Controls whether users can save the current graph state.
- Options:
- Disabled: Users cannot save the graph.
- Enabled: Users can save the graph with additional configuration:
- Default resource name: Specifies the name for newly saved graphs.
- Static: Use a fixed text string as the name.
- Variable: Use a Workshop string variable as the name.
- Default folder: Specifies where newly saved graphs will be stored.
- Folder reference: Select a specific folder.
- Static RID: Use a specific folder RID.
- Variable: Use a Workshop variable containing a folder RID or path.
- On create new graph: Configure what happens when a graph is saved.
- Event: Trigger a Workshop event when a graph is saved.
- Action: Execute a Foundry action when a graph is saved.
- The saved graph RID, saved graph name, and the current user's ID are available as a special inputs to the action.
- All required parameters must have default values configured.
- Show save dialog: Controls whether a resource dialog is shown when saving.
- None: No dialog is shown; save the resource using the default name and location.
- Resource dialog: User is prompted to choose a name and location.
- Save as versioned graph: When enabled, saves the graph as a versioned graph even if it was previously unversioned. Versioned graphs allow autosaving and version history.
Interface
The Interface section controls the UI elements and panels that are visible to users of the widget.
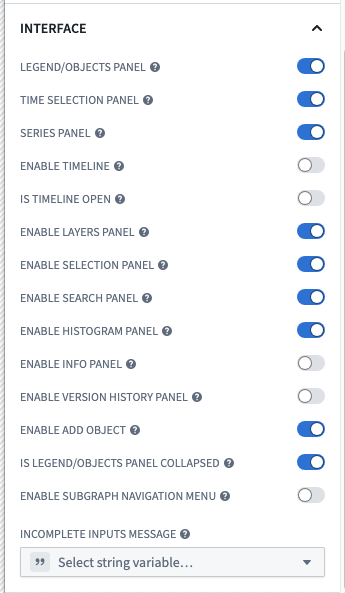
- Legend/objects panel
- When enabled, this toggle will display the left-side panel, containing the layers, selection, search, histogram and info panels when enabled below.
- Series panel
- When enabled, this toggle will display the series panel on the bottom of the widget.
- The series panel shows time series data related to selected objects.
- Time selection panel
- When enabled, this toggle will display the time scrubber on the top-right of the widget.
- This panel allows users to interact with temporal data and select specific time points.
- Enable timeline
- When enabled, this toggle will display the timeline view of the data.
- This provides a chronological view of events and data points.
- Is timeline open
- Controls whether the timeline is open or closed on first load of the module.
- Enable layers panel
- When enabled, this toggle allows the layers panel to be displayed.
- The layers panel provides controls for toggling visibility of different data layers.
- Enable selection panel
- When enabled, this toggle allows the selection panel to be displayed.
- The selection panel shows details about currently selected objects.
- Enable search panel
- When enabled, this toggle allows the search panel to be displayed.
- The search panel provides functionality to find objects in the graph.
- Enable histogram panel
- When enabled, this toggle allows the histogram panel to be displayed.
- The histogram panel shows distributions of property values across objects on the graph.
- Enable info panel
- When enabled, this toggle allows the information panel to be displayed.
- The info panel provides a high-level overview metadata about the graph, including a legend for its layers.
- Enable version history panel
- When enabled, this toggle allows the version history panel to be displayed.
- The version history panel shows previous versions of versioned graphs.
- Enable add object
- When enabled, this toggle allows users to add new objects to the graph.
- Is legend/objects panel collapsed
- Controls whether the legend/objects panel is collapsed or expanded on first load of the module.
- This helps manage the initial visual space allocation in the widget.
- Enable subgraph navigation menu
- When enabled, this toggle allows users to navigate between and create new subgraphs.
- If the graph contains multiple subgraphs, the navigation menu will always appear regardless of this setting.
- Incomplete inputs message
- When a graph template cannot run due to missing required inputs, this message is displayed to the user in a dialog.
- Use this field to customize the message shown to users when required template parameters are not provided.
Patterns
Graph template parameterization
When embedding a graph template, you can parameterize it using Workshop variables. This allows you to create dynamic visualizations that update based on user inputs or other data in the workflow.
Save and share graph explorations
A common pattern is to have a graph template that users can apply to some initial object, and then save their current exploration to continue exploration later. This allows users to start from a templatized workflow, perform some additional investigation, and capture interesting insights or relationships discovered while interacting with the graph. The saved graph can then be added as a reference to an object, allowing it to be easily shared with others or revisited later.
To implement this pattern, use the following steps:
- Add a property to the object type that will hold the saved graph RID.
- This property must be a string with Value Formatting using the Resource RID option.
- This property must have an associated Action for setting the value, which will be used after saving the graph as a resource.
- This object is typically the same object being passed as parameter to the graph template, but it could also be a separate specific object type that is used to hold saved graphs, often linked to the object being explored.
- Create a graph template configured to perform the initial exploration.
- Embed the graph template in a Workshop module using the Vertex graph widget.
- Select the graph template in the Resource section using the Static option.
- Configure any parameters to the template.
- Use the Override graph RID option to specify the object property that holds the saved graph RID.
- This could be the same object as the one passed to the template, or in the case where the graphs are referenced on a linked object, discovered using a Workshop variable from searching links or a separate list of saved graphs.
- Enable saving settings in the widget configuration to allow users to save their current graph state.
- Use the On create new graph option to run the action that sets the property value to the saved graph RID.
- When configuring the action parameters, make sure to pass the special Saved graph RID value to the appropriate parameter.
Following this pattern, when a user selects the save icon, the current graph state will be saved as a resource, and the property on the object will be updated with the RID of the saved graph. When the user revisits the object, the saved graph will be loaded using the Override graph RID option.
中文翻译
在 Workshop 模块中嵌入图
图、图模板和图解可以嵌入到 Workshop 模块中,使用户能够直接在 Workshop 工作流中与 Vertex 可视化进行交互。这种集成使得在更广泛的 Workshop 模块中实现强大的数据探索和可视化体验成为可能。
图模板可以直接从 Workshop 变量接收参数值,从而实现基于用户交互或工作流状态动态更新的数据驱动可视化体验。
在 Workshop 模块中嵌入模板主要分为三个步骤:
在 Workshop 中添加 Vertex 图组件
在 Workshop 模块中任意选择的区块内,点击 + 图标或 +添加组件 按钮打开组件菜单,然后搜索 Vertex Graph 组件。
选择资源
在组件编辑器中,点击 选择 来选择要嵌入的图、图模板或图解资源。资源选择器中只会显示兼容的资源。
配置组件
对于 Vertex graph 组件,配置项分为几个部分。每个部分控制组件行为和外观的不同方面。
输入
输入 部分控制显示的图或模板及其接收数据的方式。
- 资源
- 静态: 选择此资源模式时,使用资源选择器选择一个输入资源。可以是图、图模板或图解。
- 变量: 选择此资源模式时,输入资源由一个字符串变量提供,该变量应包含图、图指针或图模板的 RID。
- 覆盖图 RID:(可选)如果所选资源是图模板,您可以提供一个图 RID 来直接显示,而不是使用模板及其参数生成图。这允许从保存在对象属性中的 RID 加载现有图。更多详情请参阅保存和共享图探索部分。
- 参数
- 嵌入图模板时,您可以使用 Workshop 变量为模板参数提供值。模板中定义的每个参数都会在此处显示以供配置。
- 对于对象类型参数,从 Workshop 中选择一个对象集变量。
- 对于非对象参数,根据参数类型提供相应的值。
- 子图
- 嵌入包含多个子图的现有图或图解资源时,您可以通过从 Workshop 中选择一个包含该子图中任意对象的对象集变量,来选择要显示的子图。
- 刷新键
- 每当此变量的值发生变化时,组件将完全重新加载图。这对于根据工作流状态变化触发刷新非常有用。
- 参数变化时追加
- 启用后,更改参数会将新对象追加到现有图中,而不是从头重新生成。
- 场景
- 从场景加载数据: 启用此开关,使用场景而非基础 Ontology 加载给定资源。
- 应用场景后重新生成图: 启用后,每次场景修改后图都会刷新。
:::callout{theme="neutral"} 以前,模板输入是通过一个包含图模板中定义的所有必需对象类型的单一输入对象集变量提供的。现在不推荐这种做法,因为它仅适用于没有非对象参数且每个对象类型只有一个对象参数的模板。如果您希望使用此功能,请选中 使用旧版输入对象集 复选框,并提供一个对象集变量。 :::
交互
交互 部分配置用户如何与图交互,以及图如何与其他 Workshop 组件交互。
- 选中对象
- 此选项输出当前选中对象的对象集。此对象集随后可在当前模块内的下游组件中使用。
- 当用户在图中选择对象时,此变量将自动填充所选内容。
- 选中对象变化时
- 配置当图中选中对象发生变化时触发的 Workshop 事件。
- 可用于打开抽屉以显示选中对象的更详细视图、触发另一个组件的刷新,或执行任何其他 Workshop 事件操作。
- 成功应用操作时
- 配置当用户在图中成功应用操作时触发的 Workshop 事件。
- 此事件在底层操作成功执行后触发。
- 缩放到对象集
- 每当输入发生变化时,将视口设置为显示给定对象集中的对象。
- 这允许您以编程方式将图聚焦到特定对象上。
- 子图上的对象
- 输出一个包含当前选中子图上所有对象的对象集。
- 这对于捕获当前视图上所有可见对象以便在其他组件中使用非常有用。
- 向子图添加对象
- 将给定对象添加到当前选中的子图中。
- 这允许您以编程方式从其他组件向图中添加对象。
- 可用操作
- 控制用户在图界面中可以直接使用的操作。
- 选项包括:
- 全部: 图中任何对象上的所有操作都可用。
- 部分: 只有特定选中的操作可用。
- 无: 没有可用操作。
时间配置
时间配置 部分控制时间在图中的表示和交互方式。
- 选中时间
- 控制图中选中的时间。
- 选中的时间决定了图上或选择面板中显示的时间数据的读数。
- 仅当启用了时间轴、时间选择面板或序列面板之一时,才能选择时间。
- 选中时间默认为图加载时的时间。
- 选项:
- 默认: 时间选择不使用变量同步。
- 时间戳变量: 使用
Timestamp类型的 Workshop 变量同步图视觉效果。 - 日期变量: 使用
Date类型的 Workshop 变量同步图视觉效果。
- 时间窗口
- 控制图中使用的时间窗口。时间窗口决定了任何时间图表上显示的数据范围。
- 仅当启用了时间轴、时间选择面板或序列面板之一时,才能选择时间窗口。
- 默认时间窗口在控制面板中配置。
- 选项:
- 默认: 时间窗口不与变量同步。
- 时间戳: 使用两个
Timestamp类型的 Workshop 变量定义时间窗口。 - 开始: 时间窗口的开始。
- 结束: 时间窗口的结束。
- 日期: 使用两个
Date类型的 Workshop 变量定义时间窗口。 - 开始: 时间窗口的开始。
- 结束: 时间窗口的结束。
功能
功能 部分控制组件用户可用的功能特性。
- 只读模式
- 启用后,此设置将移除编辑功能并隐藏编辑工具栏。
- 这对于创建仅查看的可视化非常有用,用户不应能够修改图。
- 启用跳转到 Vertex 应用
- 启用后,将显示一个按钮,允许用户使用当前图状态打开 Vertex 应用。
- 这提供了从 Workshop 中嵌入的图到完整 Vertex 应用的无缝过渡,以便进行更高级的操作。
- 启用导出为 PNG
- 启用后,允许用户将当前图导出为 PNG 图像。
- 用户需要对嵌入资源拥有前端导出权限才能使用此功能。
- 保存设置
- 控制用户是否可以保存当前图状态。
- 选项:
- 禁用: 用户无法保存图。
- 启用: 用户可以保存图,并带有额外配置:
- 默认资源名称: 指定新保存图的名称。
- 静态: 使用固定文本字符串作为名称。
- 变量: 使用 Workshop 字符串变量作为名称。
- 默认文件夹: 指定新保存图的存储位置。
- 文件夹引用: 选择一个特定文件夹。
- 静态 RID: 使用特定的文件夹 RID。
- 变量: 使用包含文件夹 RID 或路径的 Workshop 变量。
- 创建新图时: 配置保存图时发生的事件。
- 事件: 保存图时触发一个 Workshop 事件。
- 操作: 保存图时执行一个 Foundry 操作。
- 保存的图 RID、保存的图名称和当前用户 ID 可作为特殊输入提供给该操作。
- 所有必需参数必须配置默认值。
- 显示保存对话框: 控制保存时是否显示资源对话框。
- 无: 不显示对话框;使用默认名称和位置保存资源。
- 资源对话框: 提示用户选择名称和位置。
- 保存为版本化图: 启用后,即使之前未版本化,也将图保存为版本化图。版本化图支持自动保存和版本历史。
界面
界面 部分控制组件用户可见的 UI 元素和面板。
- 图例/对象面板
- 启用后,此开关将显示左侧面板,其中包含图层、选择、搜索、直方图和信息面板(如果下方已启用)。
- 序列面板
- 启用后,此开关将在组件底部显示序列面板。
- 序列面板显示与选中对象相关的时间序列数据。
- 时间选择面板
- 启用后,此开关将在组件右上角显示时间滑块。
- 此面板允许用户与时间数据交互并选择特定时间点。
- 启用时间轴
- 启用后,此开关将显示数据的时间轴视图。
- 这提供了事件和数据点的时间顺序视图。
- 时间轴是否打开
- 控制模块首次加载时时间轴是打开还是关闭。
- 启用图层面板
- 启用后,此开关允许显示图层面板。
- 图层面板提供切换不同数据图层可见性的控件。
- 启用选择面板
- 启用后,此开关允许显示选择面板。
- 选择面板显示当前选中对象的详细信息。
- 启用搜索面板
- 启用后,此开关允许显示搜索面板。
- 搜索面板提供在图中查找对象的功能。
- 启用直方图面板
- 启用后,此开关允许显示直方图面板。
- 直方图面板显示图中对象属性值的分布情况。
- 启用信息面板
- 启用后,此开关允许显示信息面板。
- 信息面板提供关于图的高级概览元数据,包括其图层的图例。
- 启用版本历史面板
- 启用后,此开关允许显示版本历史面板。
- 版本历史面板显示版本化图的先前版本。
- 启用添加对象
- 启用后,此开关允许用户向图中添加新对象。
- 图例/对象面板是否折叠
- 控制模块首次加载时图例/对象面板是折叠还是展开。
- 这有助于管理组件中的初始视觉空间分配。
- 启用子图导航菜单
- 启用后,此开关允许用户在子图之间导航并创建新的子图。
- 如果图包含多个子图,无论此设置如何,导航菜单都会始终显示。
- 输入不完整消息
- 当图模板因缺少必需输入而无法运行时,此消息将通过对话框显示给用户。
- 使用此字段自定义在未提供必需模板参数时向用户显示的消息。
模式
图模板参数化
嵌入图模板时,您可以使用 Workshop 变量对其进行参数化。这允许您创建基于用户输入或工作流中其他数据动态更新的可视化。
保存和共享图探索
一种常见模式是使用图模板,用户可以将其应用于某个初始对象,然后保存当前探索以便稍后继续探索。 这允许用户从模板化工作流开始,进行一些额外的调查,并捕获在与图交互时发现的有趣见解或关系。 保存的图随后可以作为引用添加到对象中,从而轻松与他人共享或稍后重新访问。
要实现此模式,请使用以下步骤:
- 向对象类型添加一个属性,用于保存保存的图 RID。
- 此属性必须是字符串,并使用 资源 RID 选项进行 值格式化。
- 此属性必须有一个关联的 操作 用于设置值,该操作将在将图保存为资源后使用。
- 此对象通常是与作为参数传递给图模板的同一个对象,但也可能是一个单独的特定对象类型,用于保存图,通常与正在探索的对象相关联。
- 创建一个图模板,配置为执行初始探索。
- 使用 Vertex 图组件将图模板嵌入 Workshop 模块。
- 在 资源 部分使用 静态 选项选择图模板。
- 配置模板的任何参数。
- 使用 覆盖图 RID 选项指定保存图 RID 的对象属性。
- 这可以是传递给模板的同一个对象,或者如果图在链接对象上被引用,则可以通过搜索链接或单独的保存图列表使用 Workshop 变量发现。
- 在组件配置中启用保存设置,以允许用户保存当前图状态。
- 使用 创建新图时 选项运行设置属性值为保存图 RID 的操作。
- 配置操作参数时,确保将特殊的 保存的图 RID 值传递给相应的参数。
遵循此模式,当用户点击保存图标时,当前图状态将保存为资源,并且对象上的属性将更新为保存图的 RID。当用户重新访问该对象时,将使用 覆盖图 RID 选项加载保存的图。