Example use cases(示例用例)
This page describes several examples of how Vertex can be used in an organization.
Point-and-click process flow diagramming [Beta]
:::callout{theme="neutral" title="Beta"} Diagramming in Vertex is in the beta phase of development and may not be available on your enrollment. Functionality may change during active development. To enable this feature, contact your platform administrator to modify Vertex settings in Control Panel. :::
- Create a dynamic, integrated digital twin of your operations that allows you to test conditions that maximize organizational outcomes.
- Rapidly configure object-backed system graphs or production diagrams for any type of workflow, from material processing and equipment tuning to production and supply chain management.
- Leverage pre-defined relationships between your modeled objects and processes to visualize material flow and events across your system.
- Configure and style your object graph or diagram based on key properties, metrics, or measures in order to tailor your system visualizations.
Production diagrams:
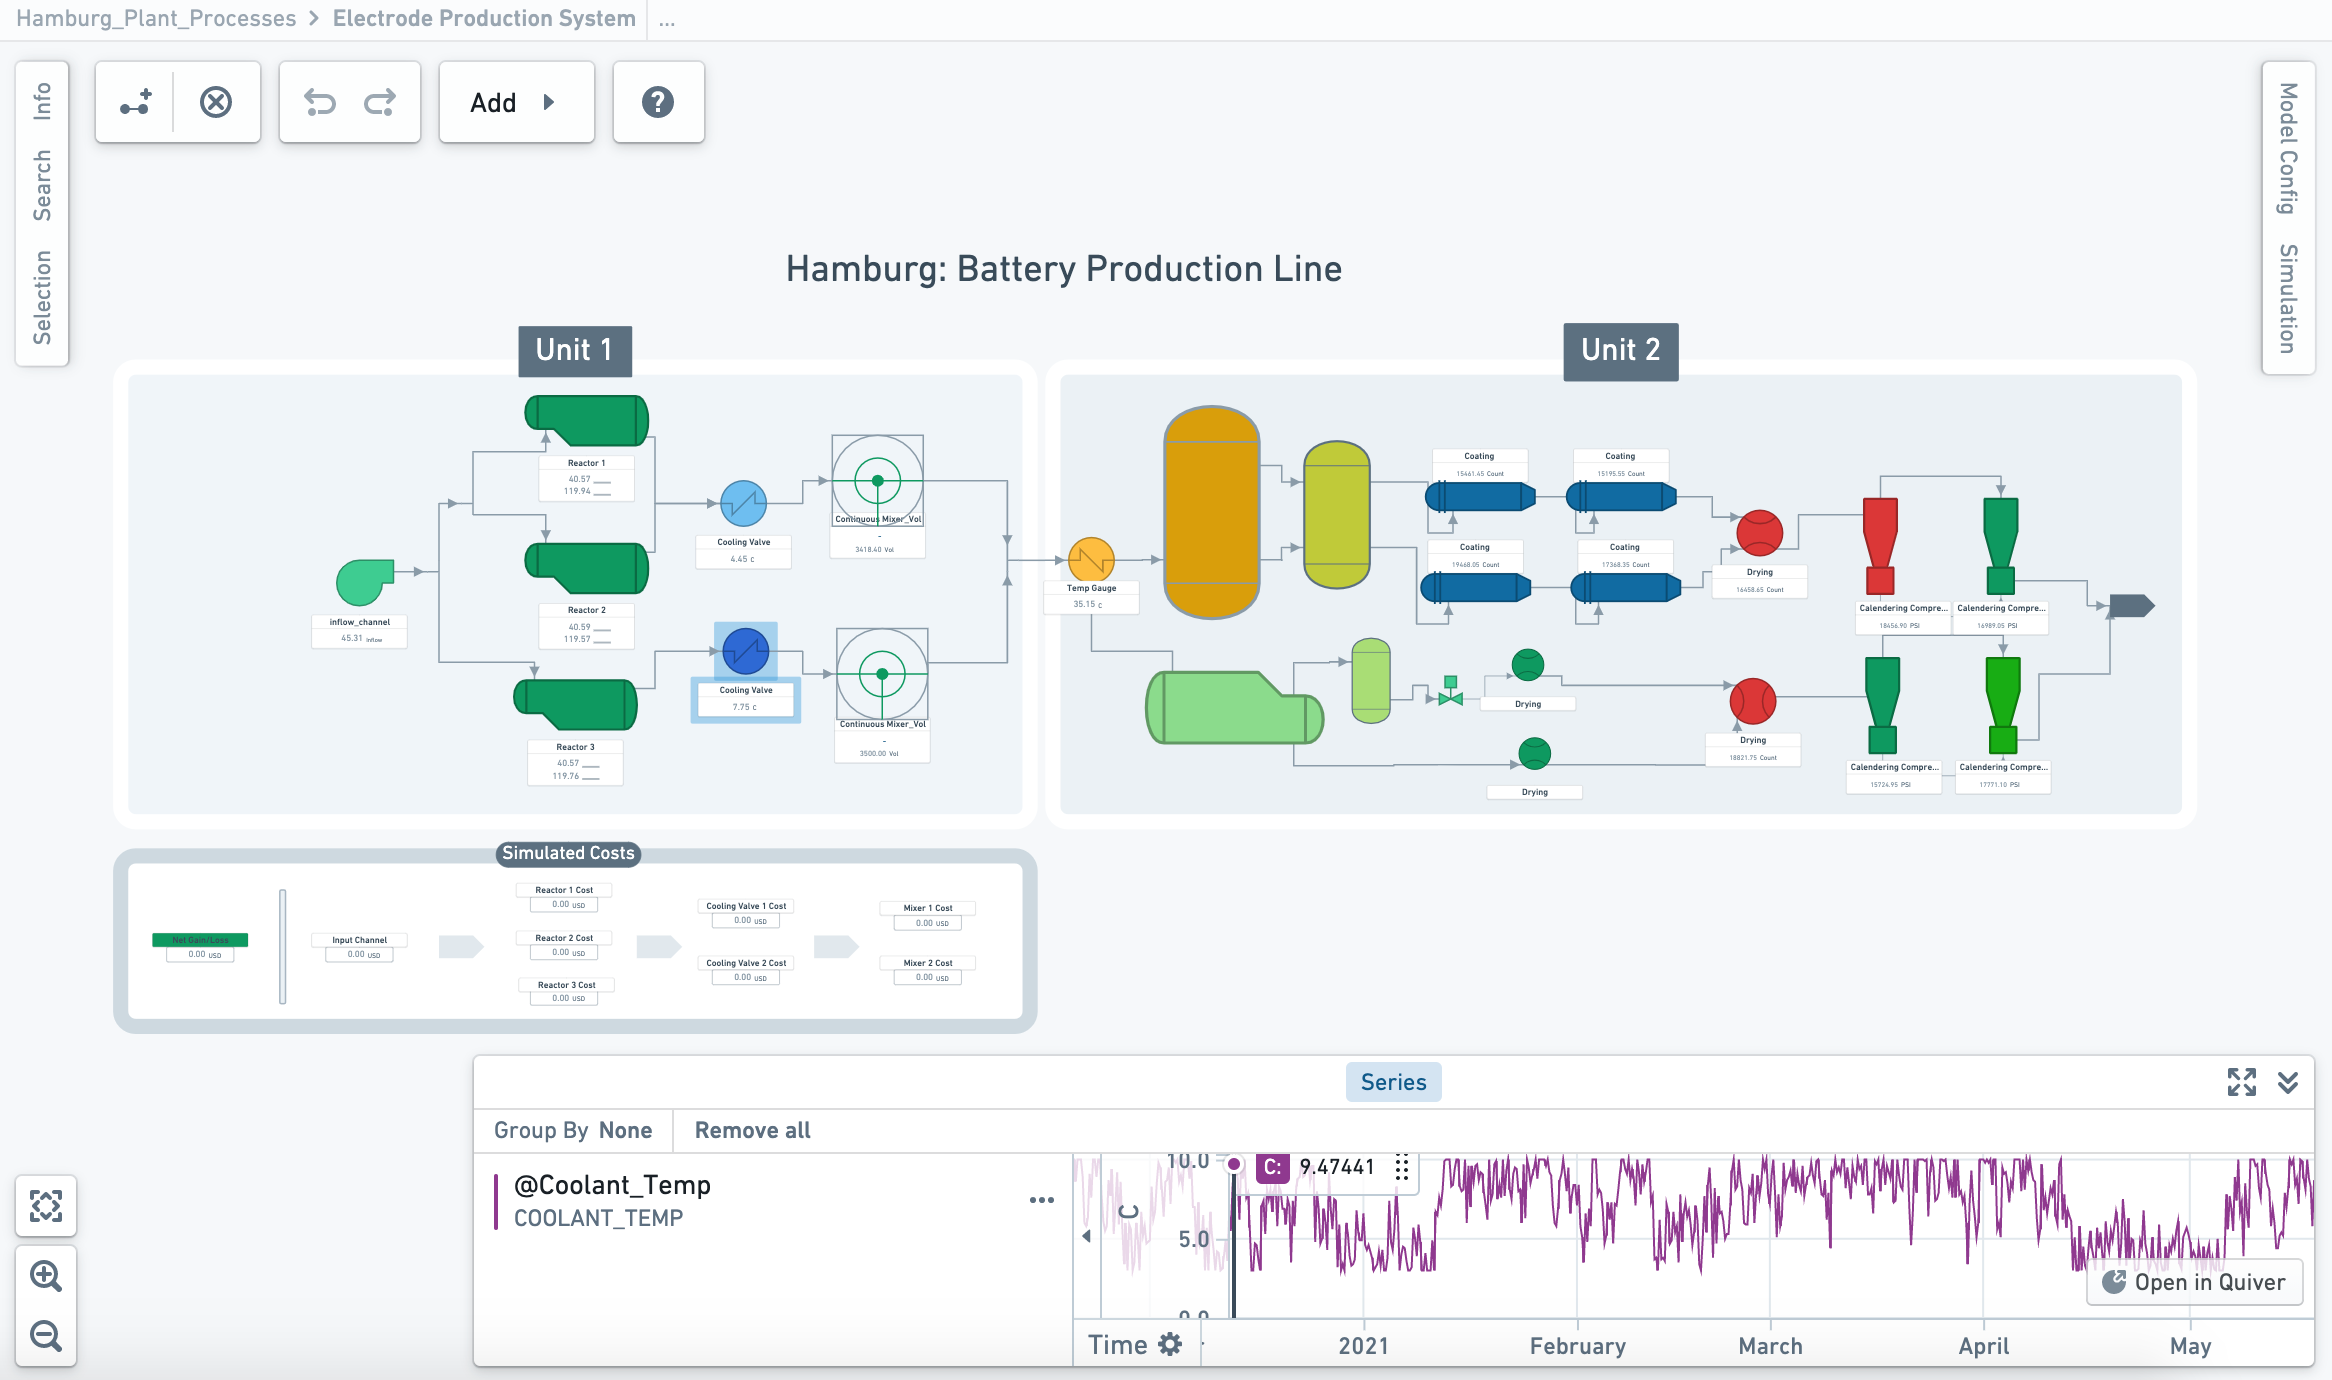
This screenshot uses notional data.
System graph:
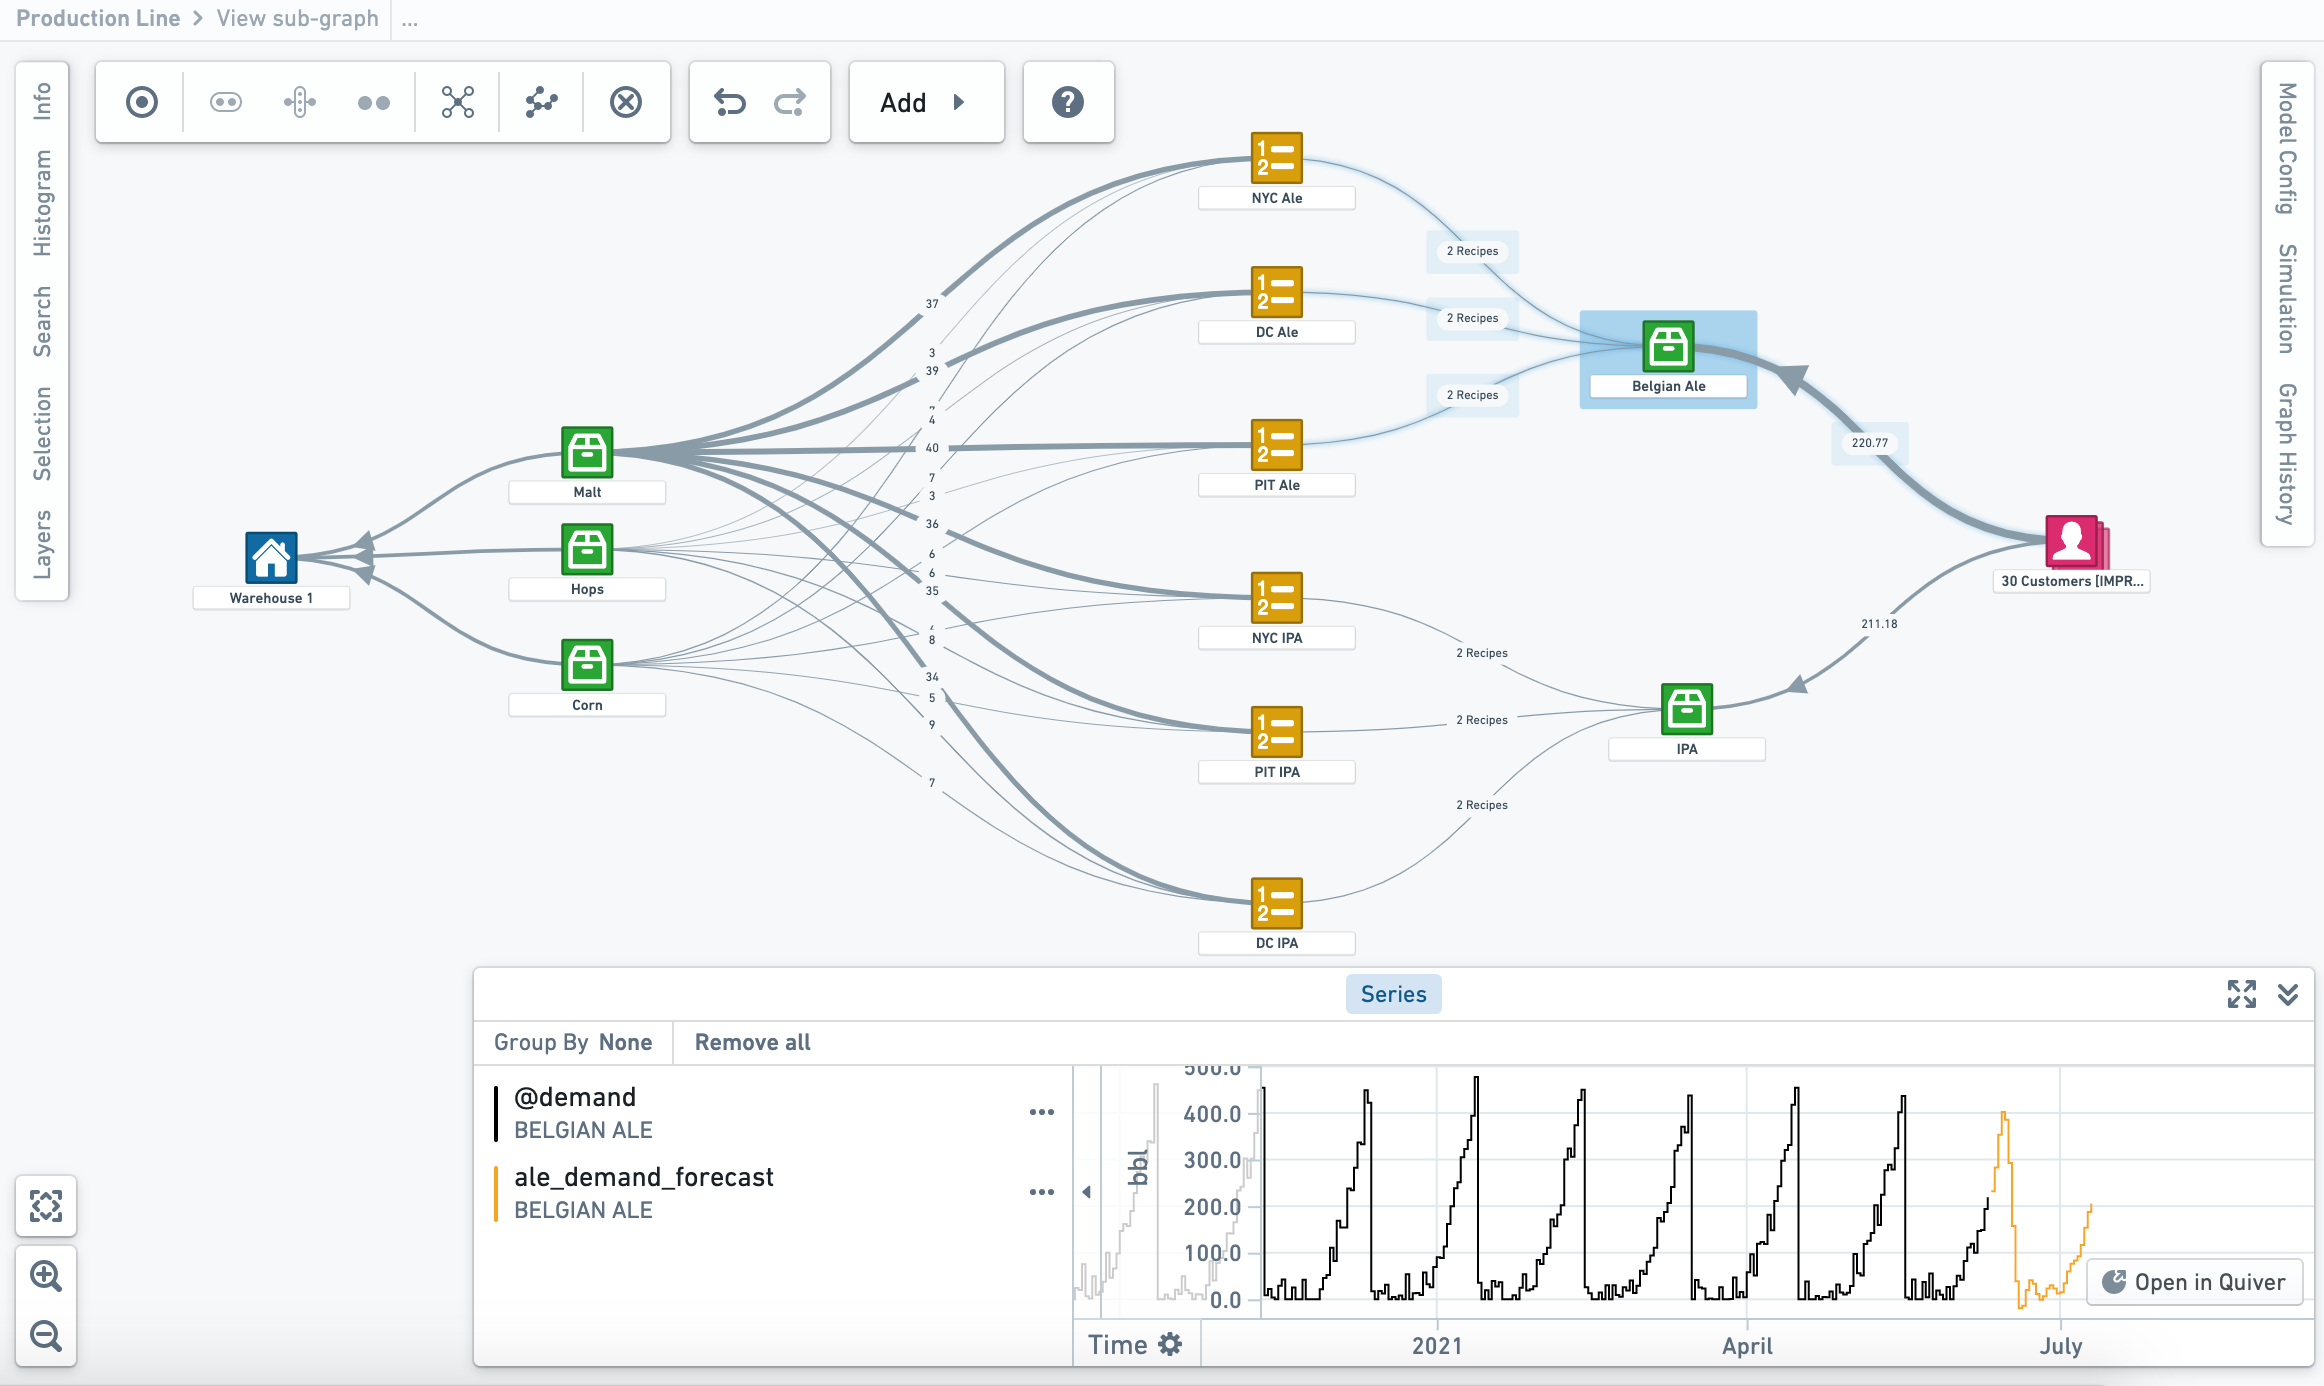
This screenshot uses notional data.
Simulation, dynamic analysis, and decision optimization
Vertex allows you to interact and interrogate your digital twin through integration with any model, forecast, or business logic published in Foundry.
- Run “what-if” analyses and simulations across your entire network to understand and compare the implications of decisions, events, or potential changes impacting your systems.
- Configure and run simulations to apply the real-world context necessary to accurately quantify the impact of proposed changes to your modelled universe.
- Connect processes and systems across your digital twin to break through operational and data silos and drive new multi-disciplinary innovation across your organization.
中文翻译
示例用例
本文介绍了 Vertex 在组织中应用的几个示例。
点击式流程图绘制 [Beta]
:::callout{theme="neutral" title="Beta"} Vertex 中的流程图绘制功能处于开发阶段的 beta 阶段,您的当前环境可能尚未启用。该功能在活跃开发期间可能发生变化。如需启用此功能,请联系您的平台管理员,在控制面板中修改 Vertex 设置。 :::
- 创建动态、集成的运营数字孪生(digital twin),使您能够测试各种条件,从而最大化组织成果。
- 快速配置基于对象的系统图或生产图,适用于任何类型的工作流,从物料处理、设备调优到生产与供应链管理。
- 利用建模对象与流程之间的预定义关系,可视化整个系统中的物料流动与事件。
- 根据关键属性、指标或度量值,配置并设计您的对象图或流程图,以定制系统可视化效果。
生产图:
此截图使用模拟数据。
系统图:
此截图使用模拟数据。
仿真、动态分析与决策优化
Vertex 允许您通过与 Foundry 中发布的任何模型、预测或业务逻辑集成,与数字孪生进行交互和查询。
- 在整个网络中运行“假设分析”(what-if)与仿真,以理解并比较影响系统的决策、事件或潜在变化所带来的后果。
- 配置并运行仿真,应用必要的真实世界背景,以准确量化对建模宇宙提出的变更所产生的影响。
- 连接数字孪生中的各个流程与系统,打破运营与数据孤岛,推动组织内跨学科的新一轮创新。