Explore related time series(探索相关时间序列)
Vertex graphs allow you to interact with time series to visualize changes across your system and deepen your analysis to show the impact of past decisions, current state, and future potential.
:::callout Not all customer installations include time series. If you would like to learn more about these capabilities, contact your Palantir representative. :::
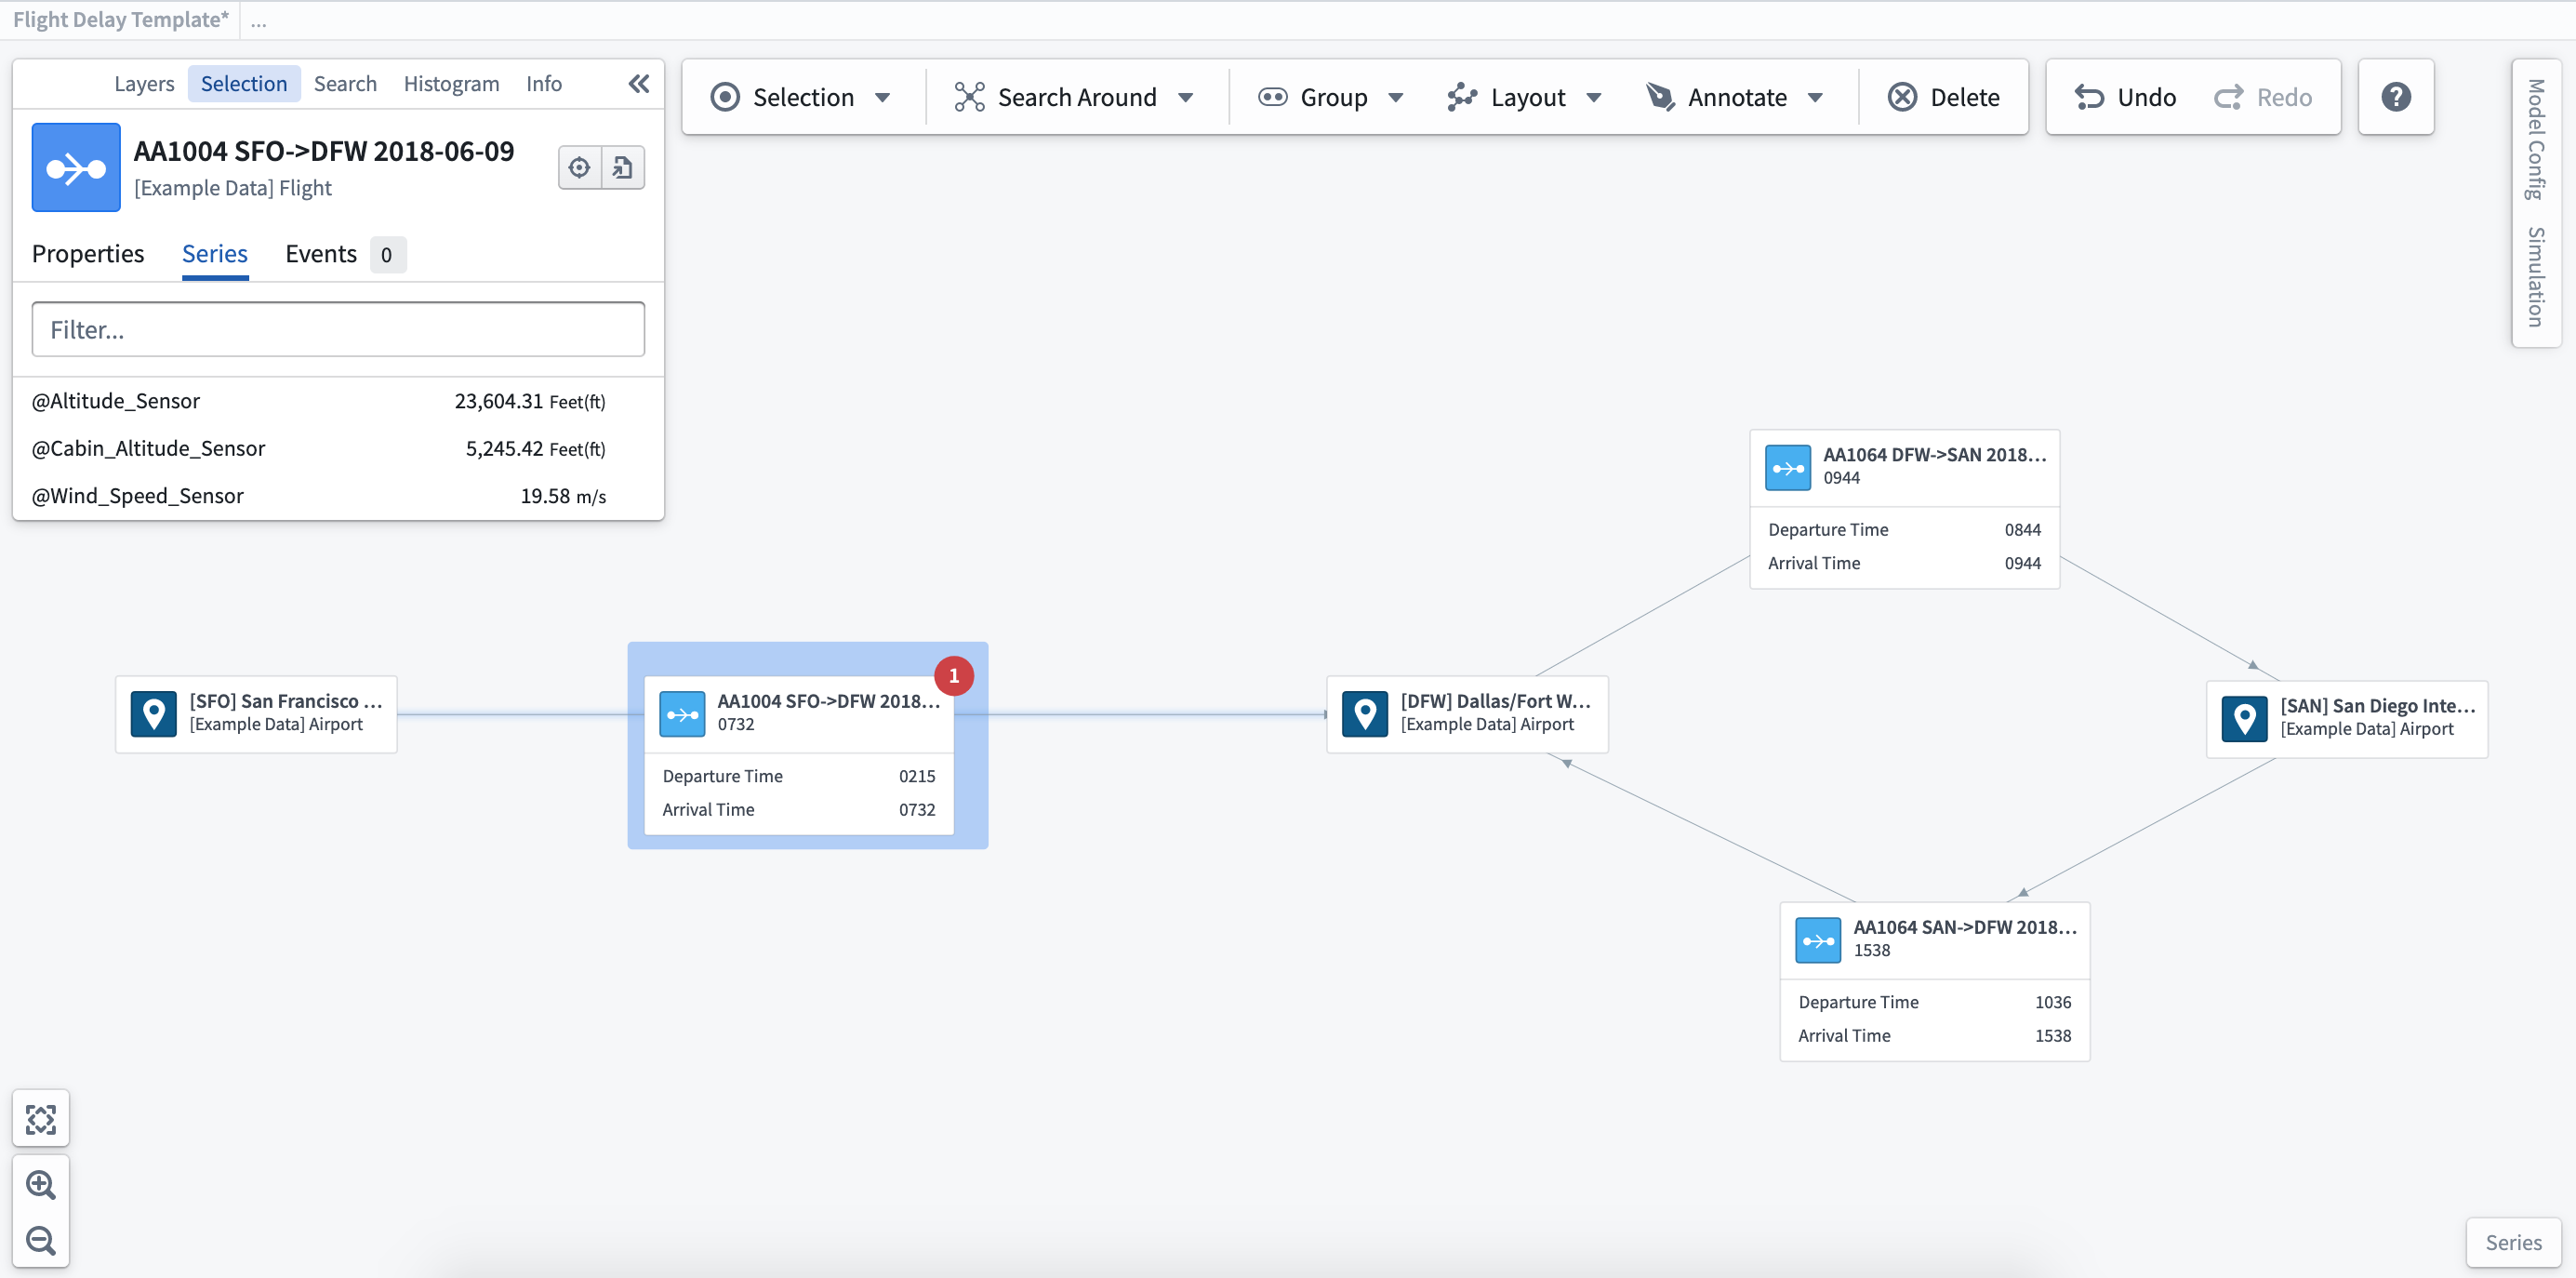
View related time series: Once you select an object, you will see any related time series on the Series tab of the selection sidebar. After selecting the ... next to the individual time series shown for your object, you will see a number of options appear in the menu.
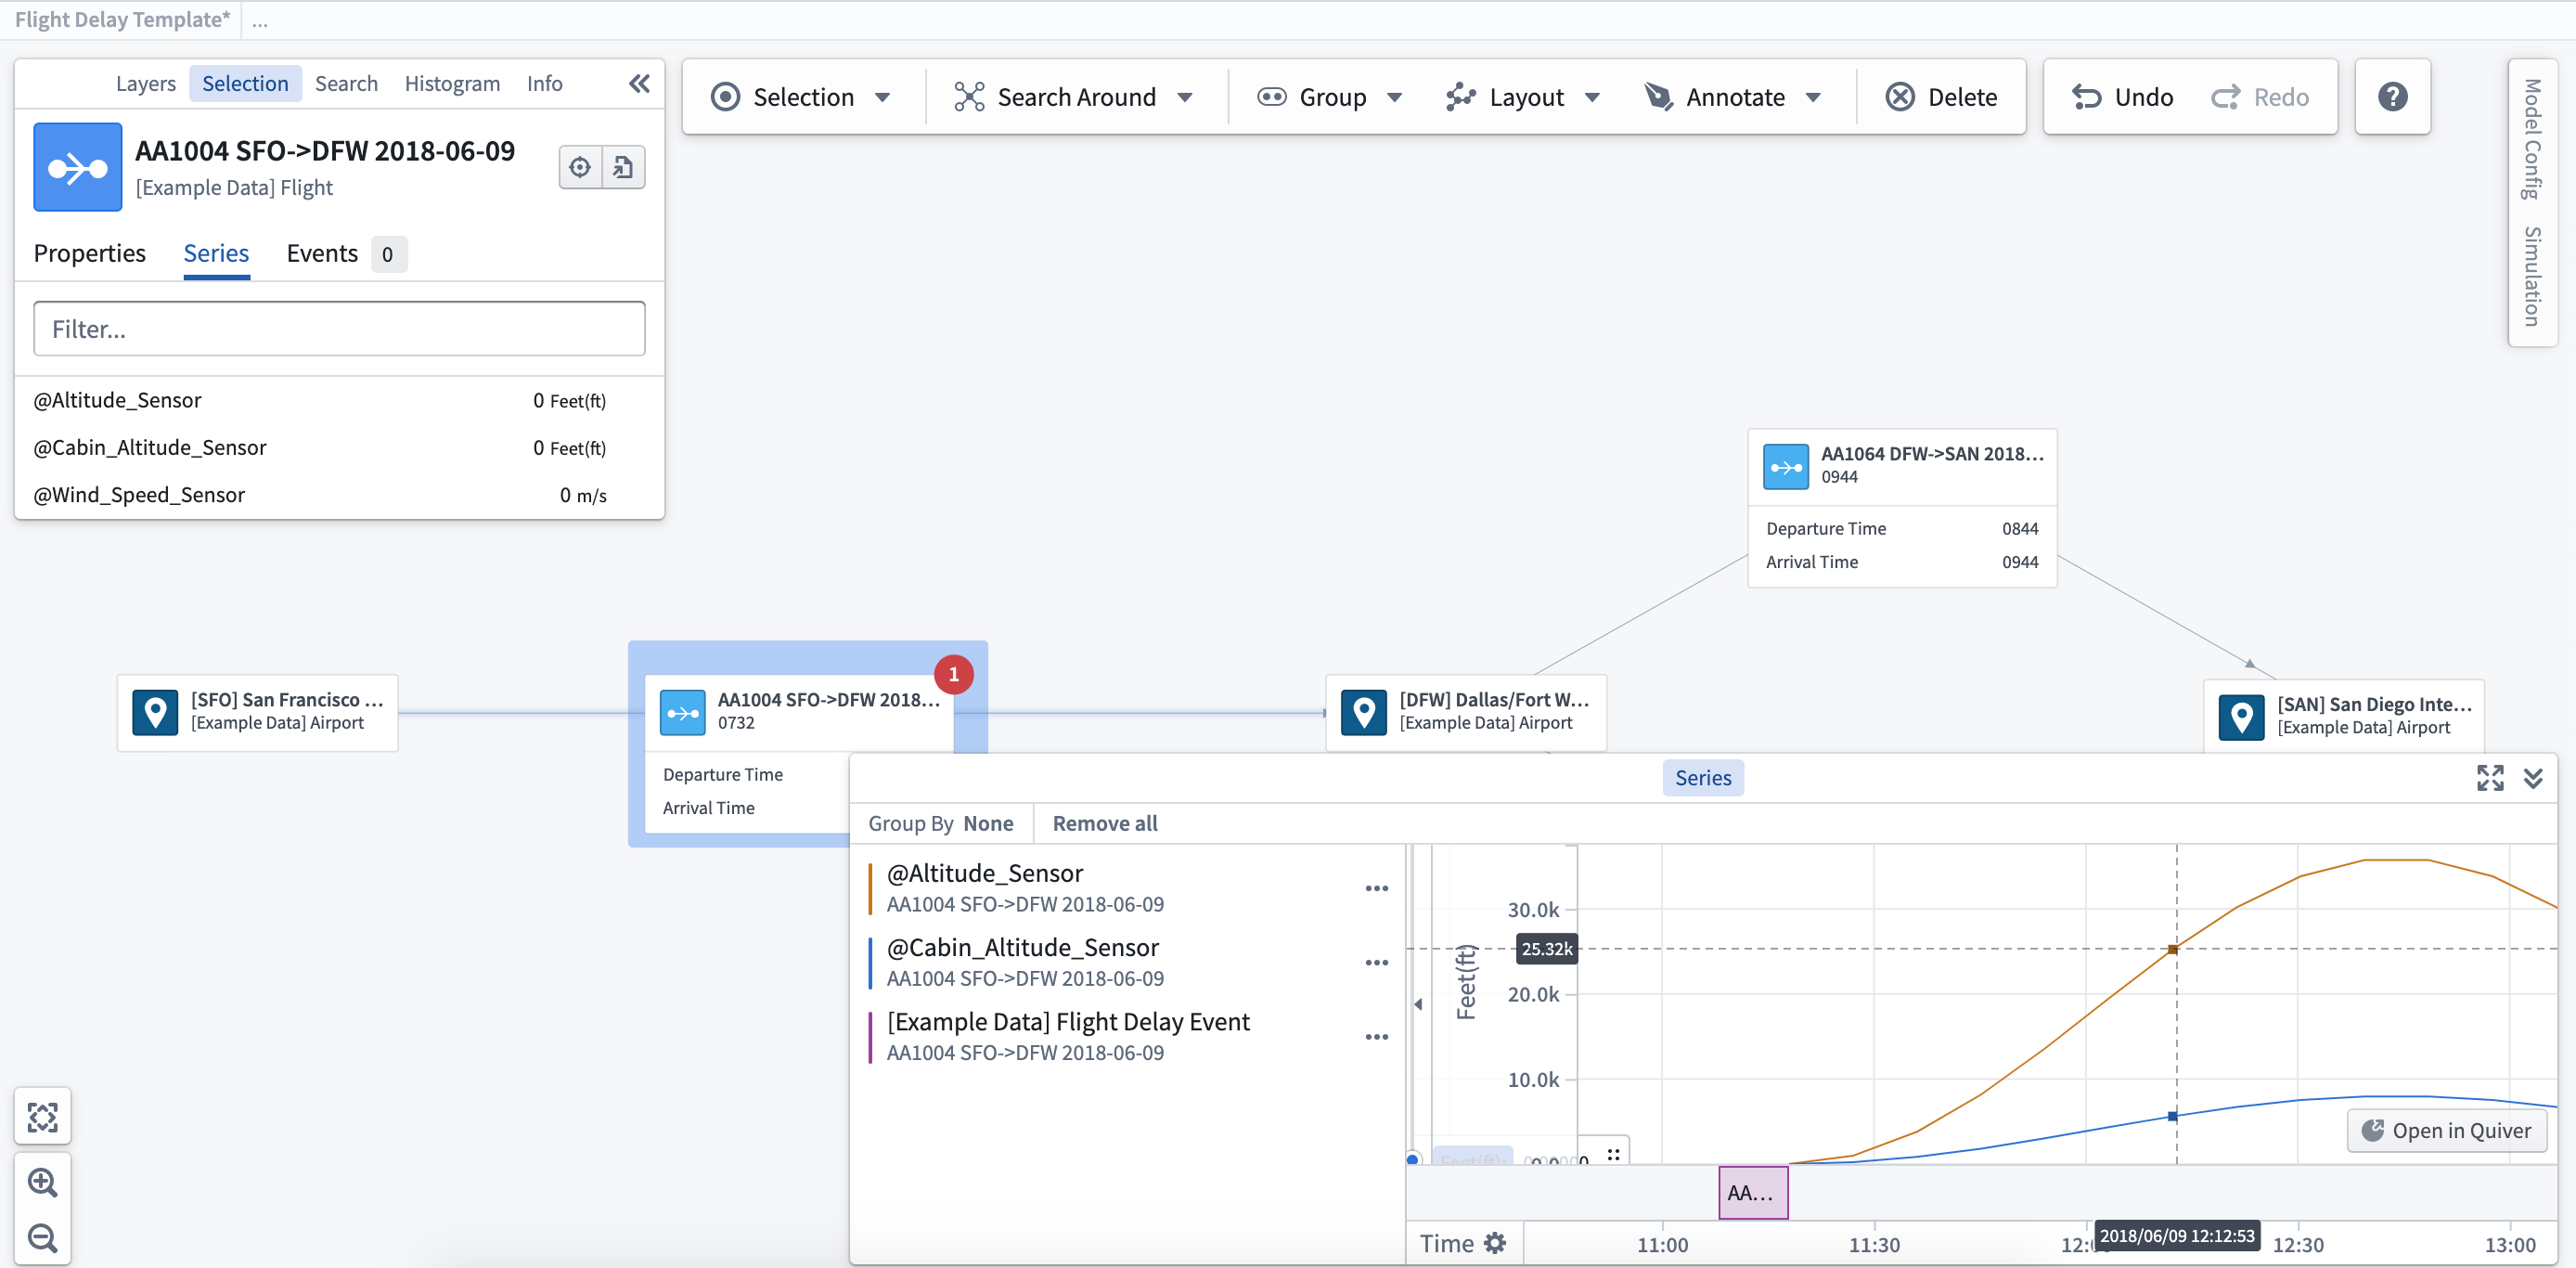
Open in series view: When you add a time series to the series view, the timeline visualization will display at the bottom of the graph. You can use the series view to move through time by clicking on the point in time you wish to view, or scrolling using the timeline at the bottom of the series panel.
Open in Quiver / Object Explorer: Selecting the option to Open in Quiver or Open in Object Explorer will open a new window to allow you to view the time series in more detail.
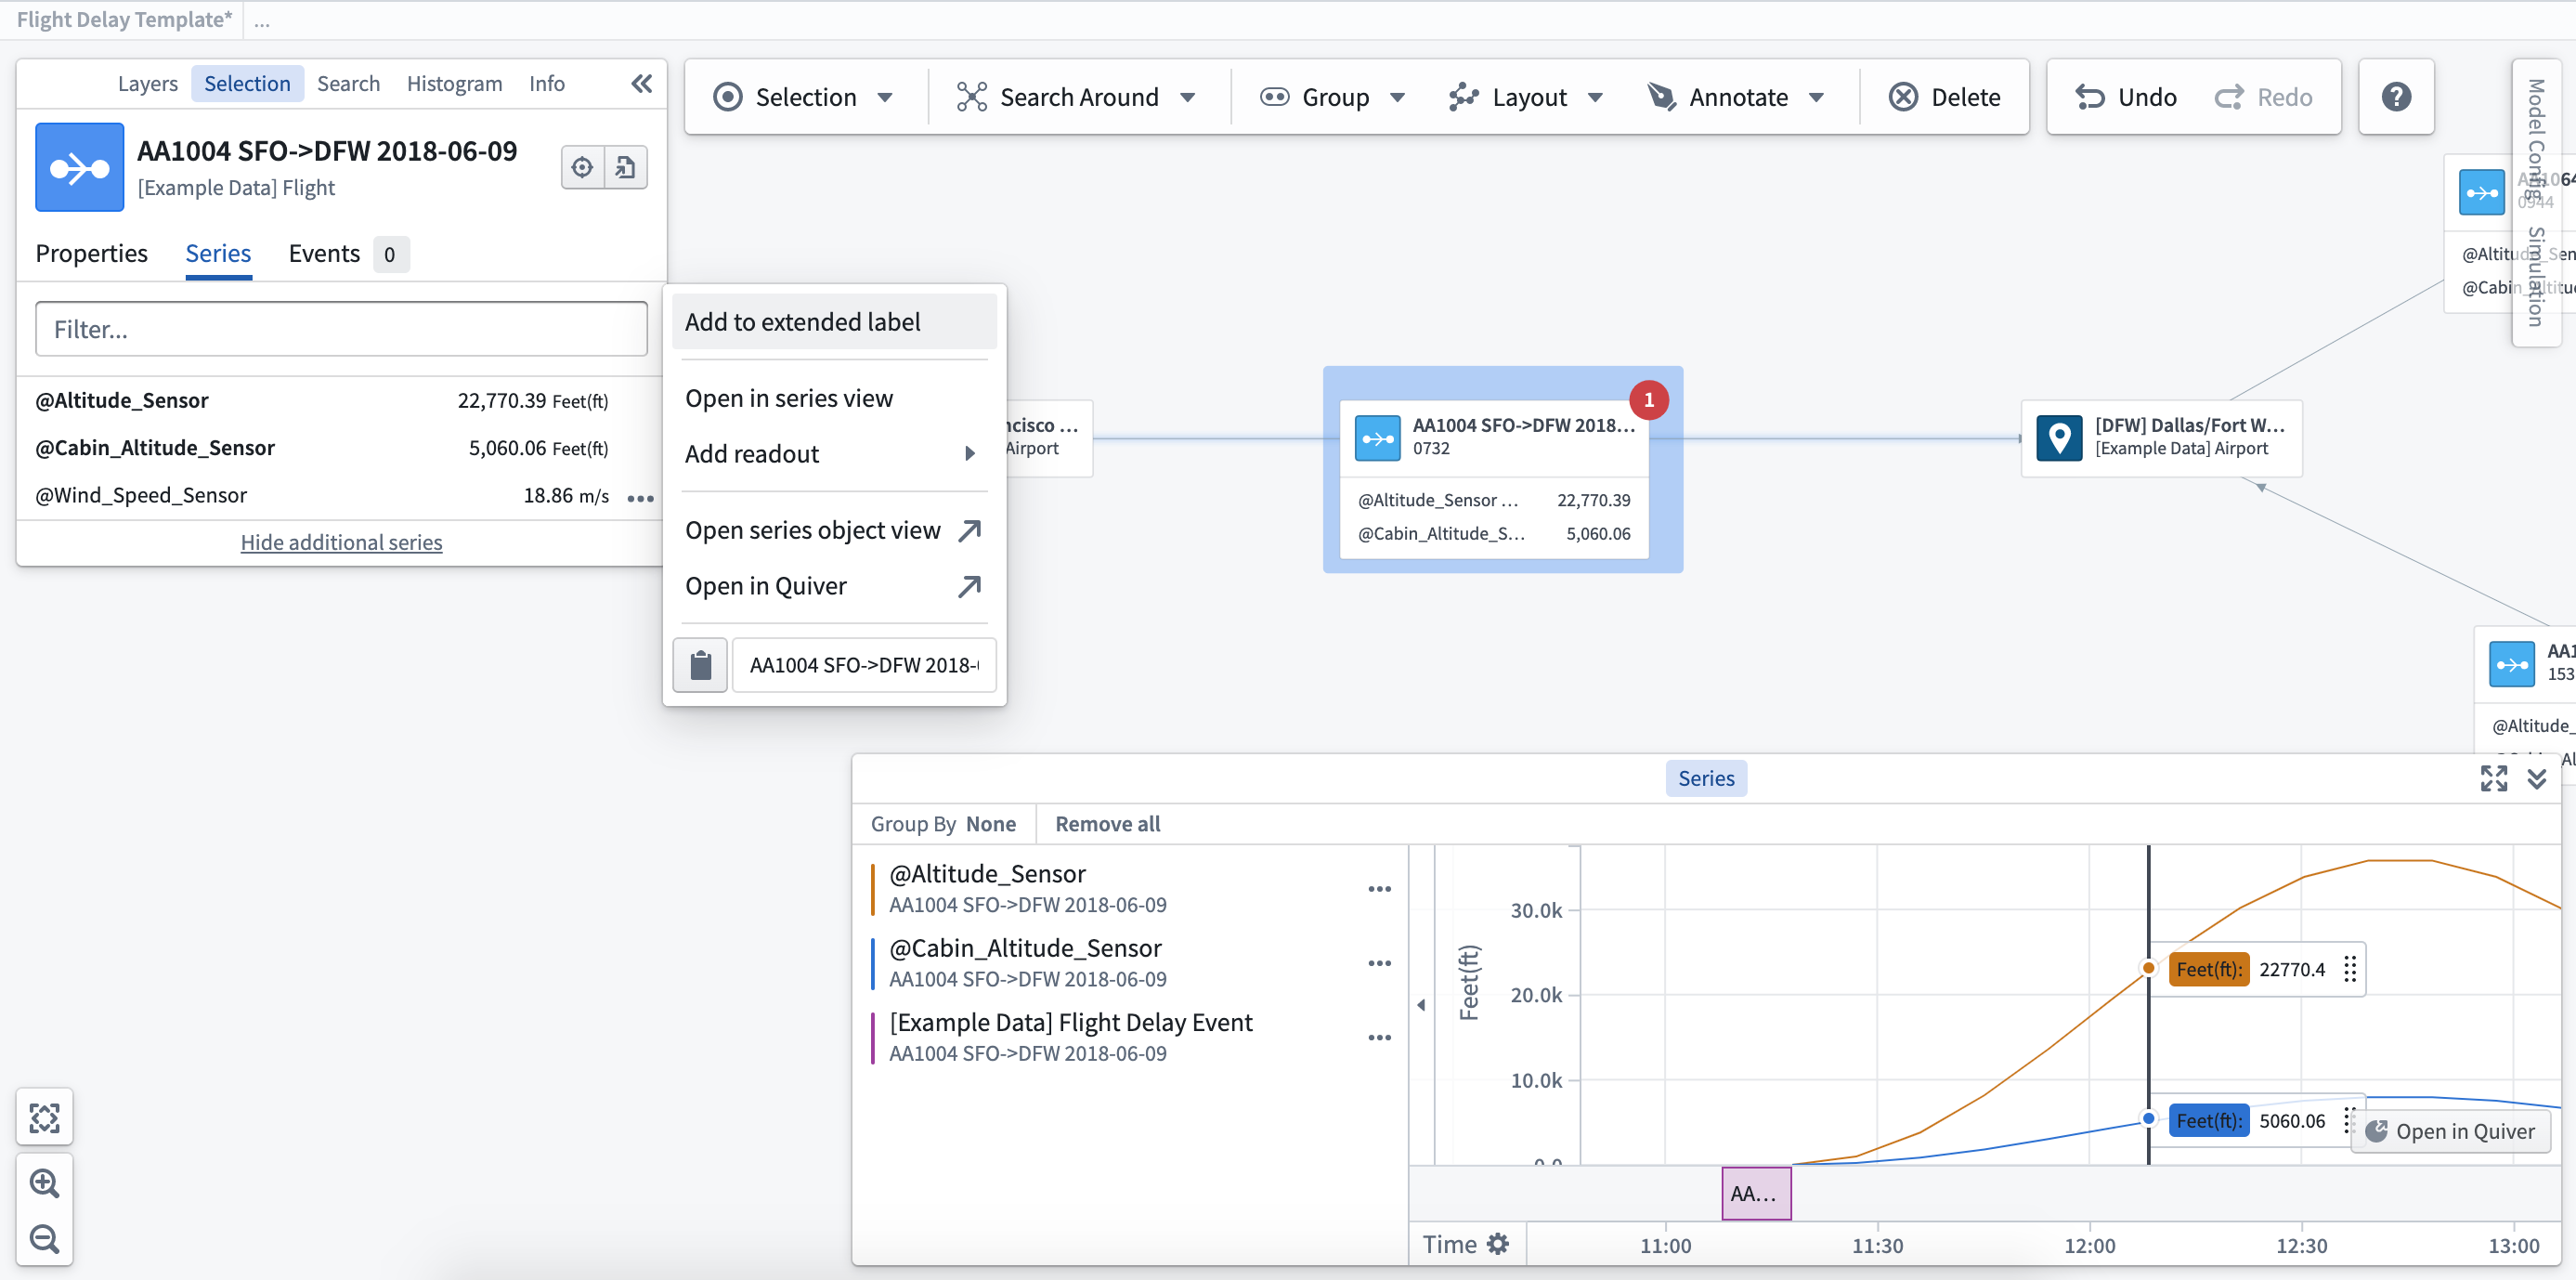
Add to extended label/readout: This will display the time series value on the label for the object selected. Selecting Add to readout allows you to add the time series value to the graph without attaching to the object label, so that you can place these values where they are most relevant within the system or process.
中文翻译
探索相关时间序列
Vertex 图支持您与时间序列进行交互,以可视化系统中的变化,并深化分析,展示过去决策的影响、当前状态及未来潜力。
:::callout 并非所有客户安装都包含时间序列功能。如需了解更多相关信息,请联系您的 Palantir 代表。 :::
查看相关时间序列: 选中某个对象后,您可以在选择侧边栏的序列选项卡中查看所有相关的时间序列。点击对象对应时间序列旁的 ...,菜单中将显示多个选项。
在序列视图中打开: 将时间序列添加到序列视图后,时间轴可视化图表将显示在图表的底部。您可以通过点击想要查看的时间点,或滚动序列面板底部的时间轴,在序列视图中按时间推移浏览。
在 Quiver / Object Explorer 中打开: 选择在 Quiver 中打开或在 Object Explorer 中打开选项,将打开一个新窗口,以便您更详细地查看时间序列。
添加到扩展标签/读数: 此选项将在所选对象的标签上显示时间序列值。选择添加到读数,则可将时间序列值添加到图表中,而无需附着在对象标签上,从而可以将这些值放置在系统或流程中最相关的位置。