Object and edge display options(对象与边显示选项)
Vertex allows you to configure dynamic styling for the objects and edges on your graph. After setting styling and configuring key property readouts, you can see how these key properties change over time by using the time selection windows.
Graph layout
Automatic layout options
You will find a number of predefined layout options in the toolbar at the top of the workspace. Once selected, objects and edges will automatically move, allowing you to order the graph as you explore relations. Many of these layouts contain advanced parameters for modifying their behavior. These parameters can be accessed by selecting the gear icon next to the respective layout.
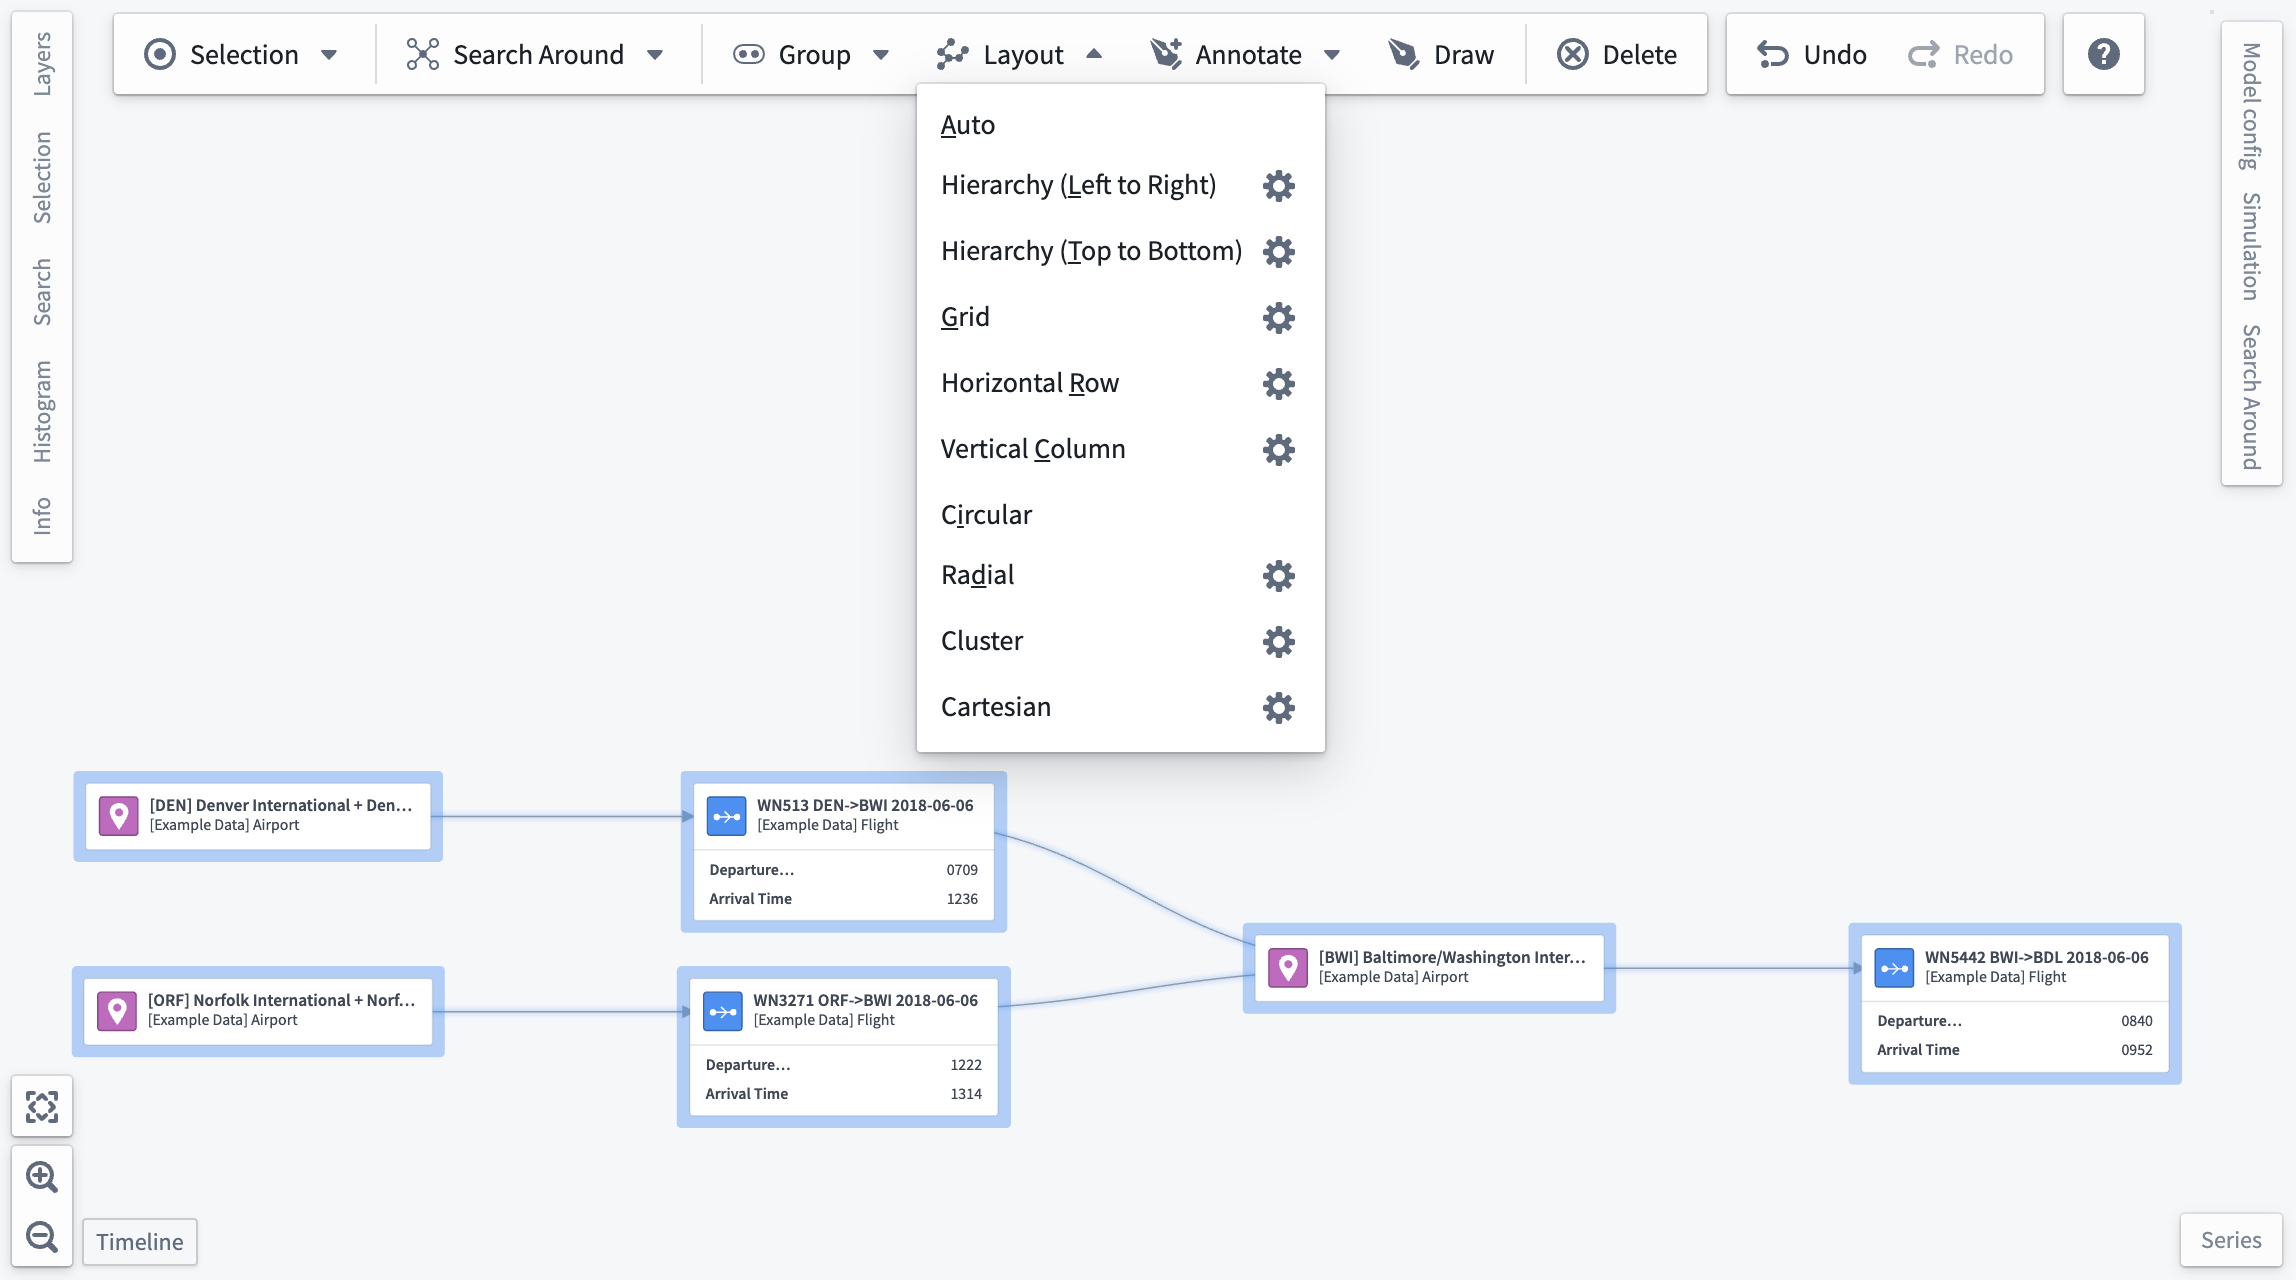
Below are the advanced parameters for each layout. Note that Auto and Circular layouts do not have advanced parameters.
Hierarchy (Left to Right/Top to Bottom)
- Reverse: Inverts the order of the hierarchy; left-right becomes right-left and top-bottom becomes bottom-top.
- Root nodes: Choose a node to occupy the root of the hierarchy. If
Automaticis selected, a root node will be selected for you based on edge directions.
Grid
- Staggered: Provides the option to offset odd rows of elements.
- Grid dimensions: Specify a constraint on the number of rows or columns in the grid.
Automaticmode will attempt to use an equal number of rows and columns.
Horizontal Row/Vertical Column
- Order by: An object property by which to sort nodes.
- Uses ascending order by default.
- If no
Order byproperty is selected, the layout will maintain the pre-existing horizontal node order for rows, or vertical node order for columns. - Grouped nodes and any nodes backed by objects that do not contain the specified property will be placed at the beginning when ascending and at the end when descending.
- Only numeric properties will appear in this select list.
- Matching property names on different objects will be sorted together.
- Reverse: Toggle the sort order between ascending and descending. This option will only appear if an
Order byproperty is selected.
Radial
- Central node: Specify the node that should appear at the center of the layout.
- Density: A value between one and five (inclusive) that determines spacing between nodes.
Cluster
- Cluster by: Specify a property by which nodes should be clustered.
- If no property is selected, this layout will cluster by object type.
- Grouped nodes and any nodes backed by objects that do not have the selected property will be clustered together.
- Only properties that have the render hints
SelectableorLow Cardinalitywill appear in this dropdown. - Matching property names of different objects will be clustered together.
Cartesian
- X/Y property: Properties to use as the x and y coordinates of the nodes in the layout.
- Coordinates will be normalized so that nodes fit within the viewport when the layout is executed.
- The cartesian layout will not be executed unless an x property, y property, or both are selected.
- Grouped nodes and any nodes backed by objects that do not have the selected property will remain in their pre-layout locations.
- Only properties that have the render hints
SelectableorLow Cardinalitywill appear in this dropdown. - Matching property names on different objects will be sorted together.
- X/Y reverse: Invert x and y coordinates. The reverse toggle will only appear after a property selection is made.
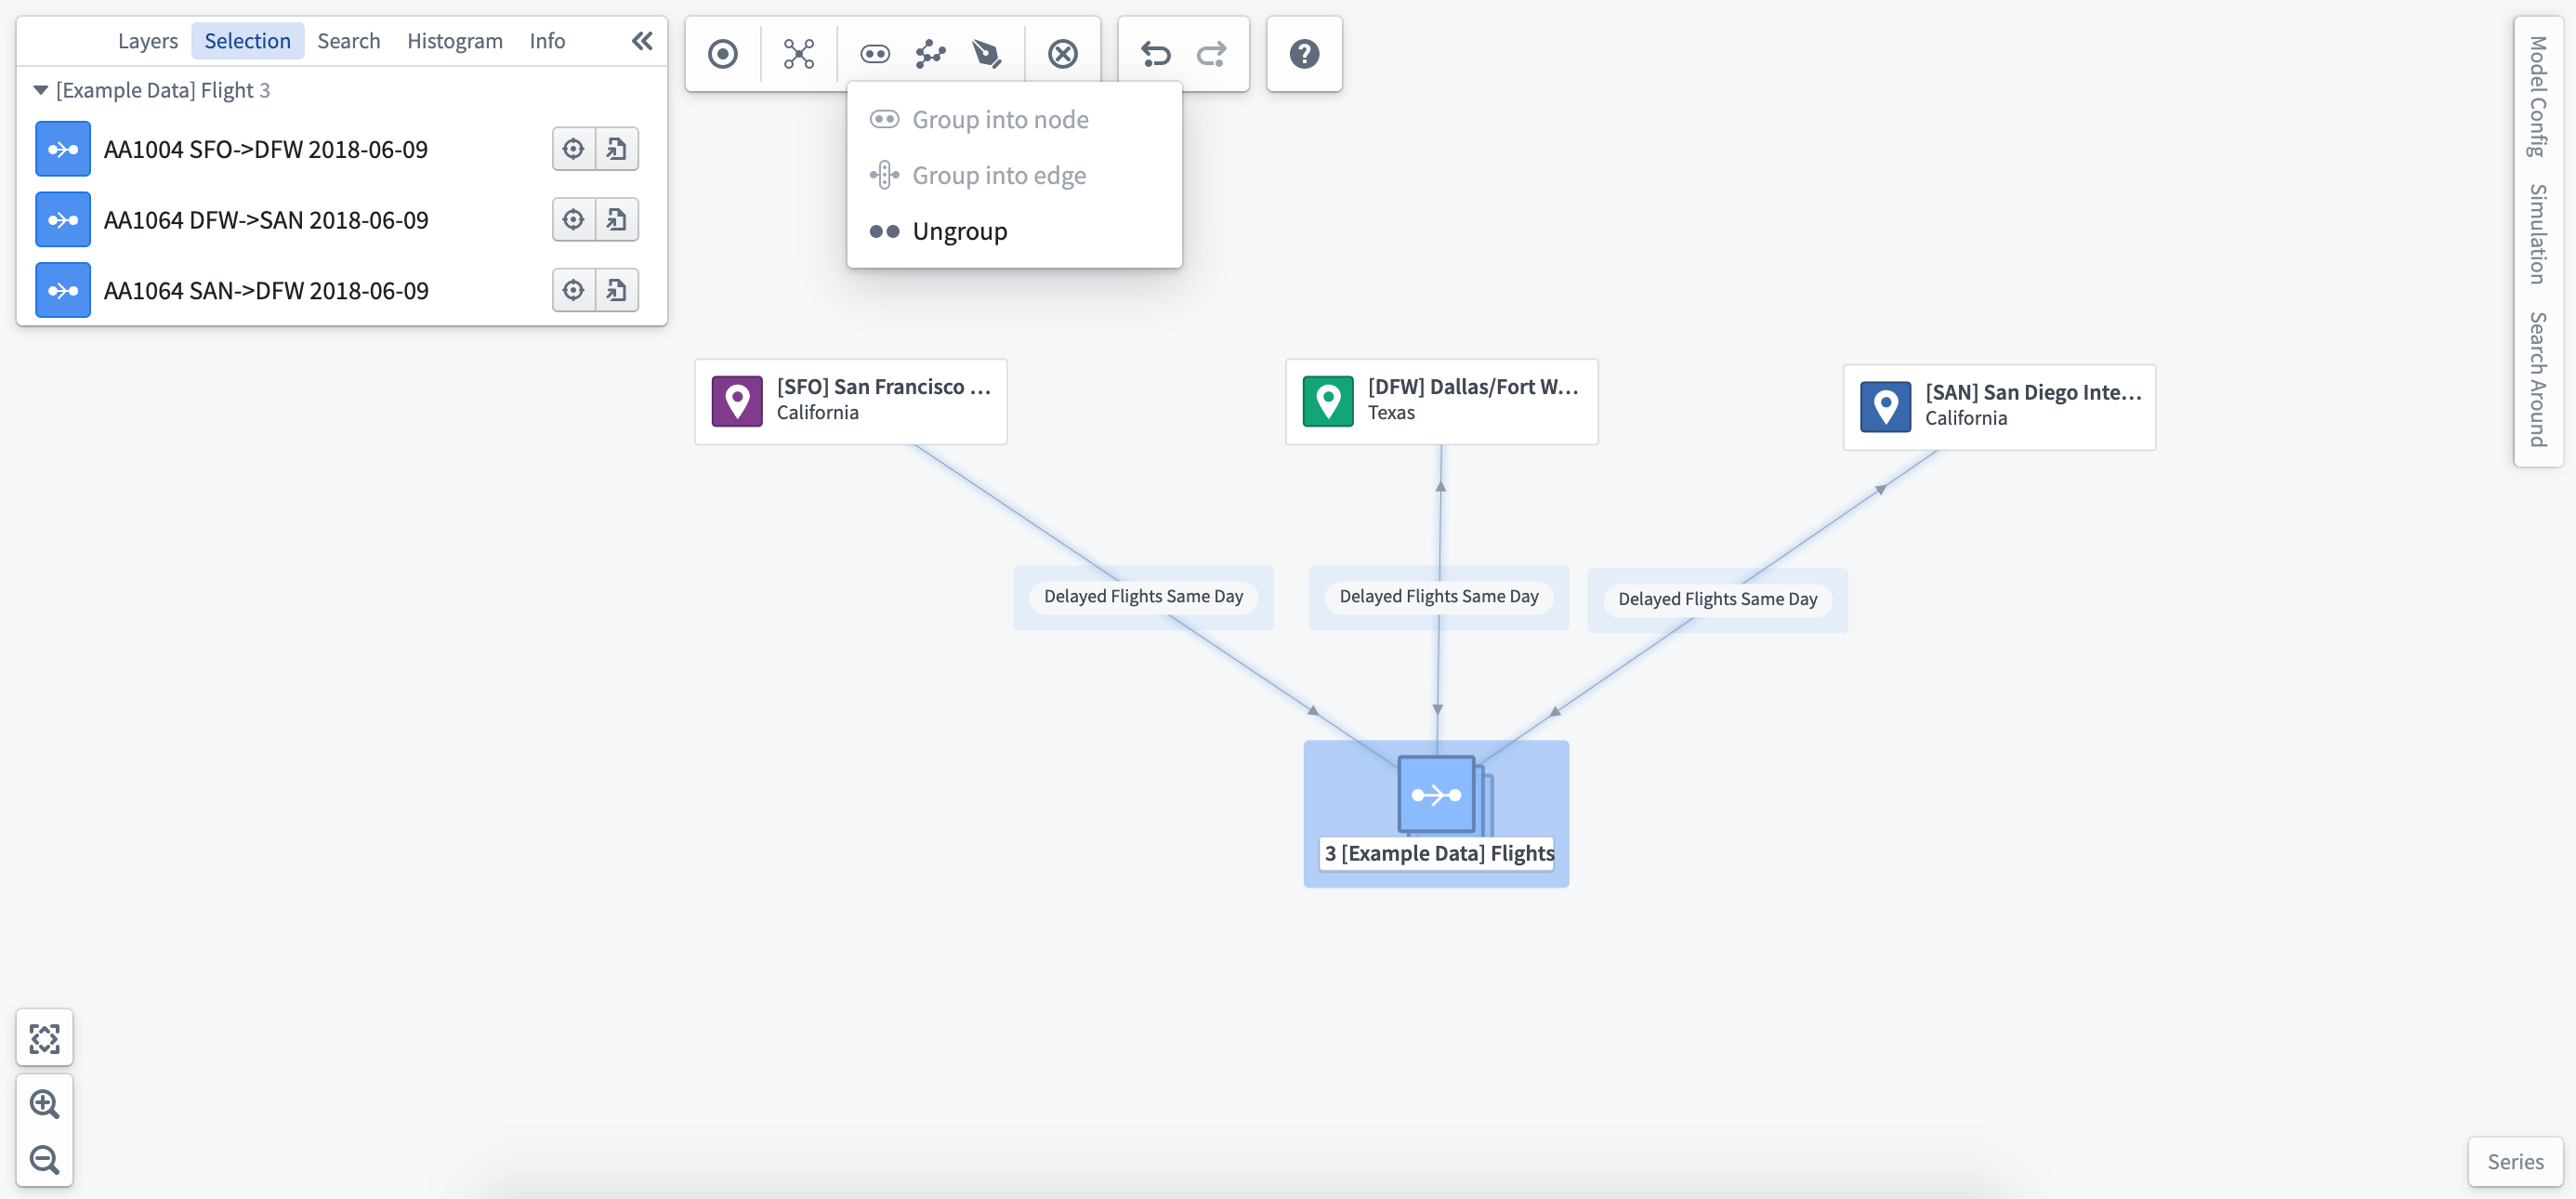
Group nodes by object type
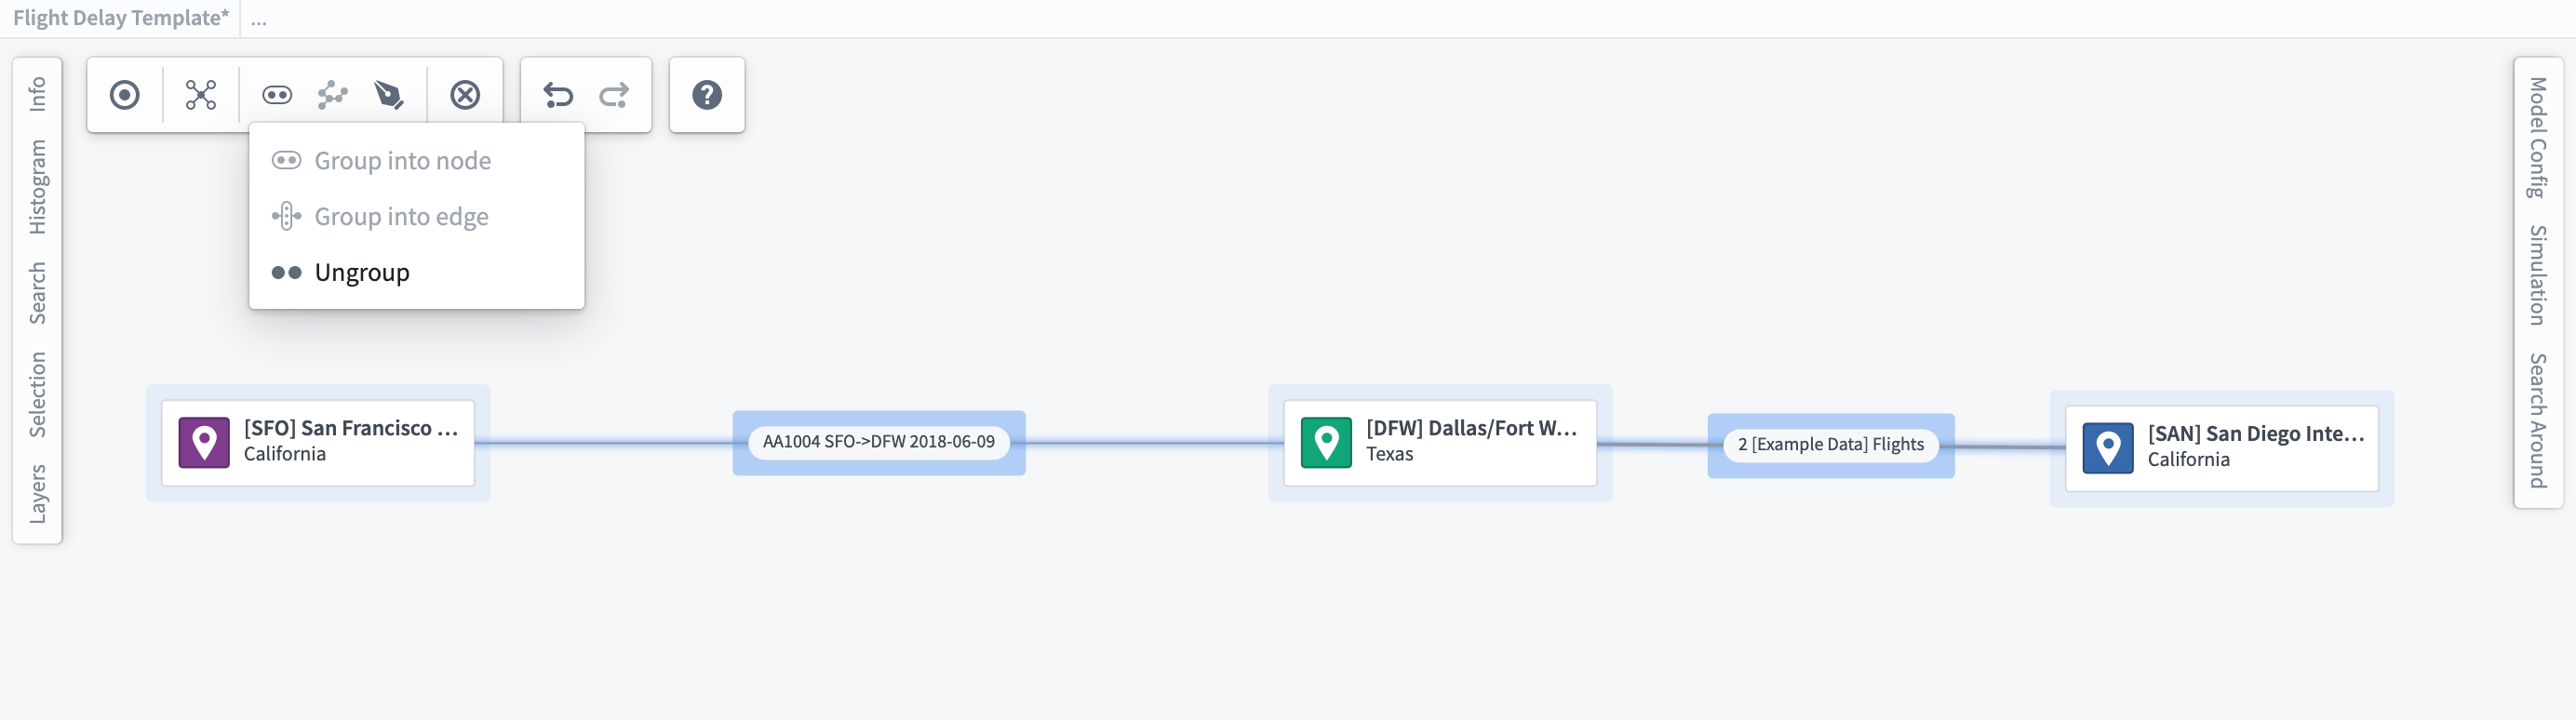
As you add more related objects, you may want to begin grouping objects into a single node on the graph. Once you have selected the objects you wish to group, use the layout toolbar at the top of the Workspace to group or ungroup the selected objects.
Once you have grouped a number of objects into a single node, you will see the full list of objects that have been grouped in the selection panel at the left of the workspace. If you only want to ungroup a subset of the objects in a node, use the selection panel to select those objects and choose Ungroup as seen below. This can also be done using the Filter to functionality in the histogram.
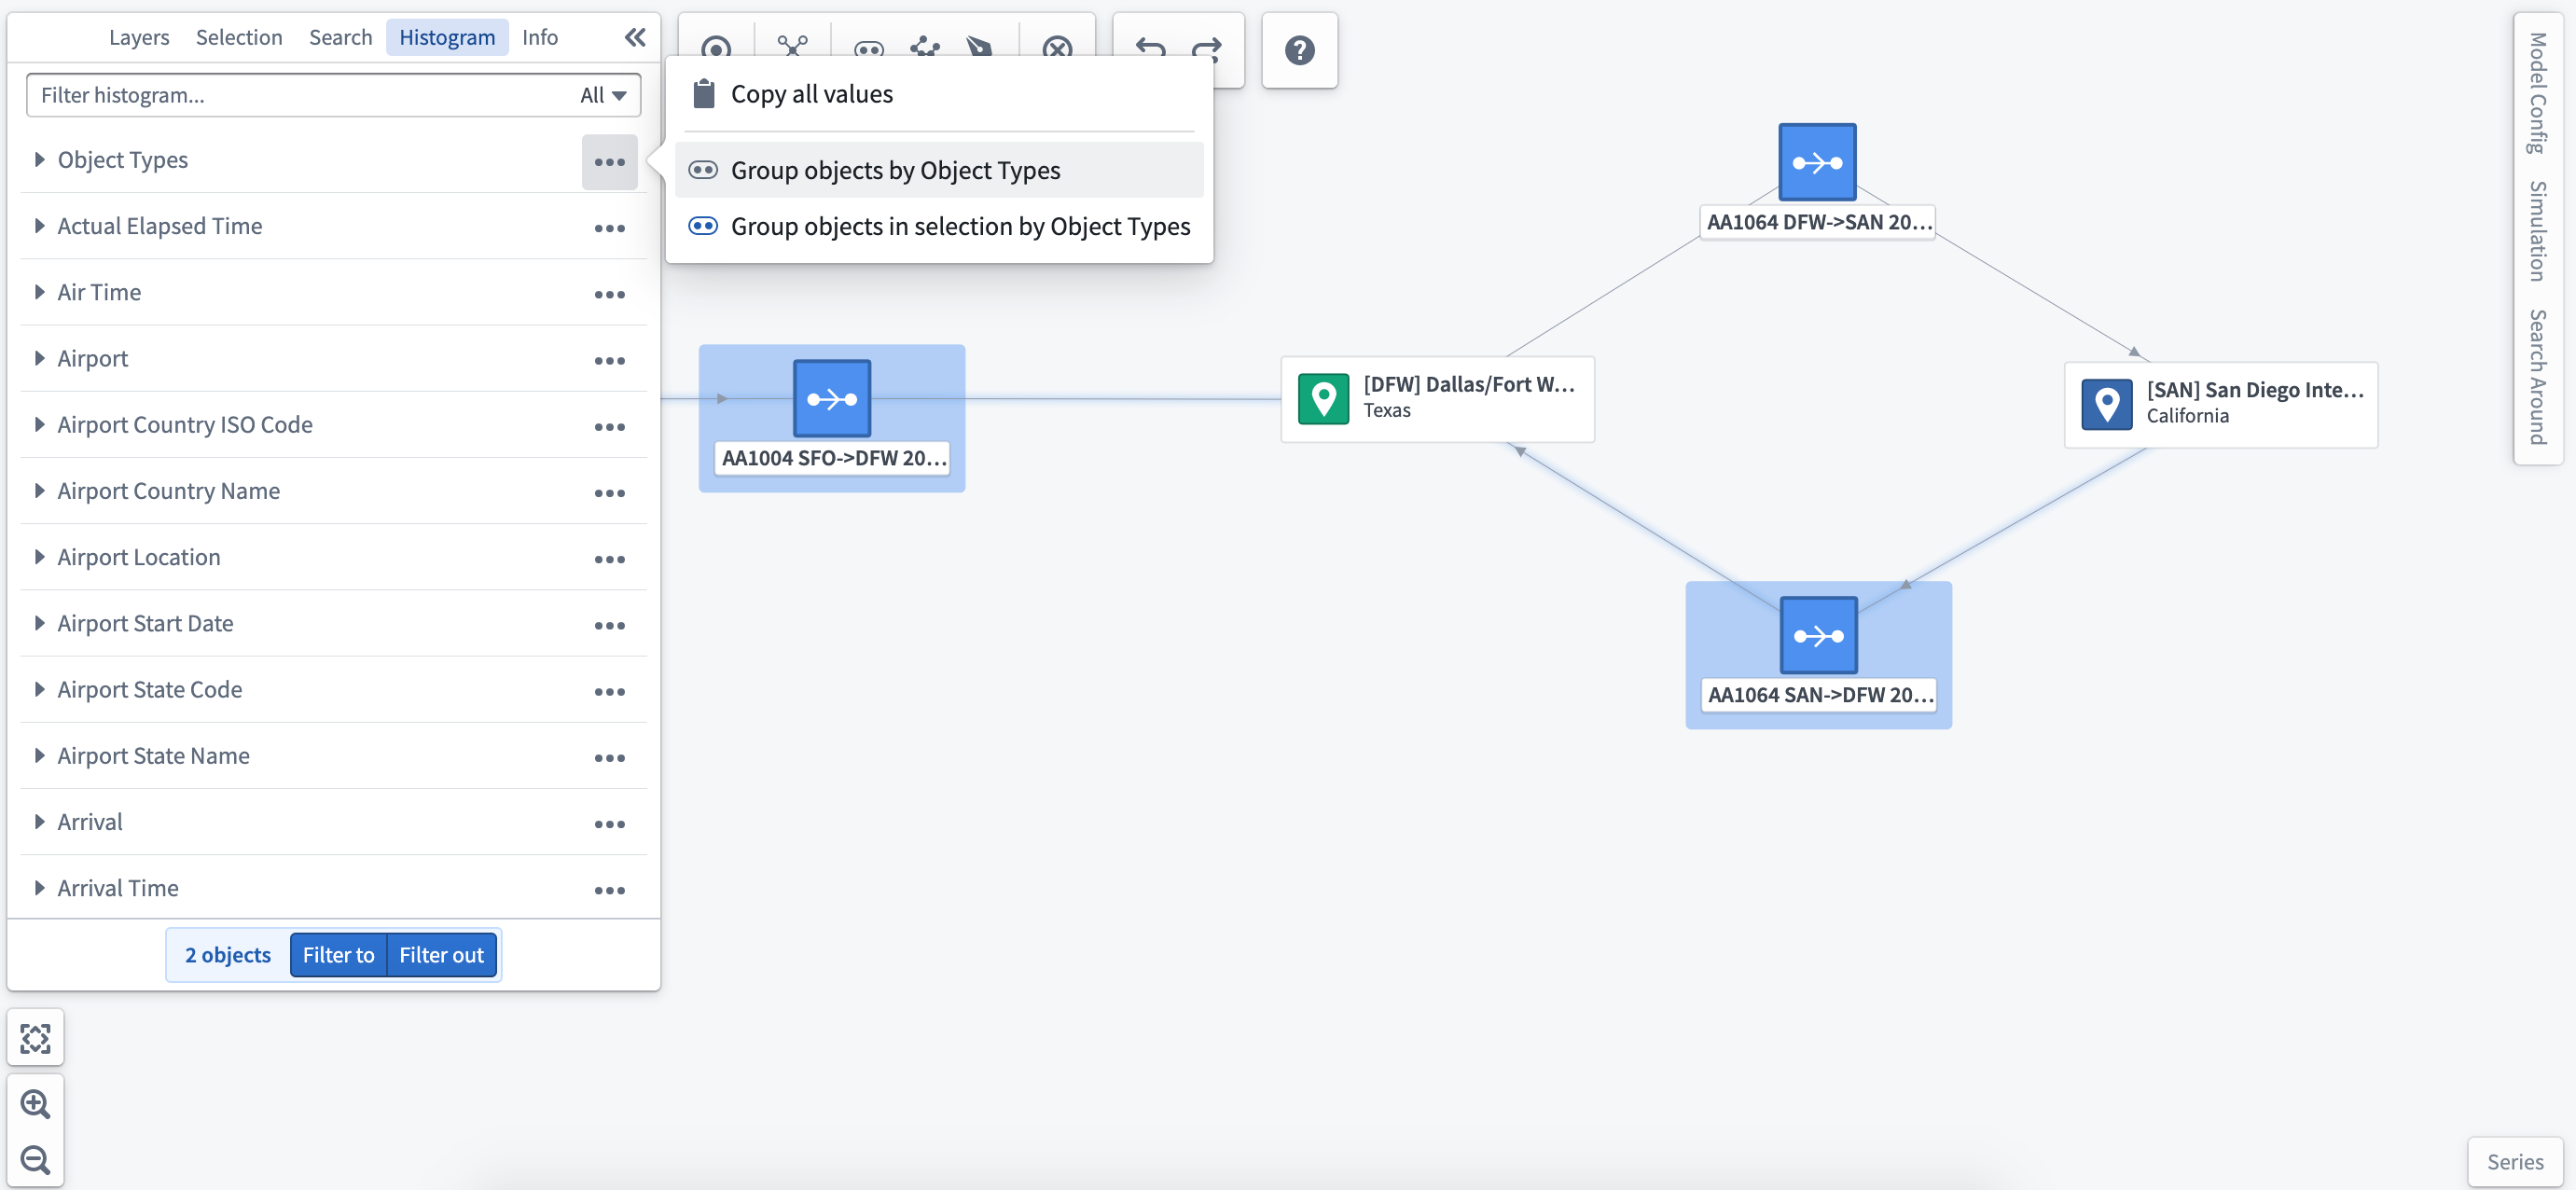
Group by a property of the object type
Using the histogram, you can explore the properties of selected objects as well as group objects by the values displayed. This will change the object layout on your graph to reflect the new groupings.
Group nodes into edge
Some objects are transactional and move between other nodes/objects in your system. For example, a Flight moves between a Departure Airport and a Destination Airport as a transactional object. In this instance, you can group the order objects onto the edge, with the ability to style edges based on key properties/metrics.
Select the edge and choose Ungroup from the right-click menu to show all objects previously grouped in the edge. Alternatively, you can ungroup a subset by first selecting objects to ungroup using the histogram or selection panel.
:::callout You can automatically group transactional objects into the related edge in the Ontology Manager → Capabilities tab. Learn more about link merging. :::
Layer styling options
Layers refer to the object node(s) of the same object type or the edge relationships between nodes. These can be configured individually with a number of layout options to allow flexible visualization and intuitive interaction with the digital twin of your system.
Using the layer styling panel in the left sidebar, you can style nodes and edges individually or style by properties of the object and related time series/measured values. Layer styling allows you to visualize key information, calculate metrics, and style by parameterized conditions to show current or simulated system state.
Object styling
Select Styling Options next to the object type you wish to configure to open the styling menu.
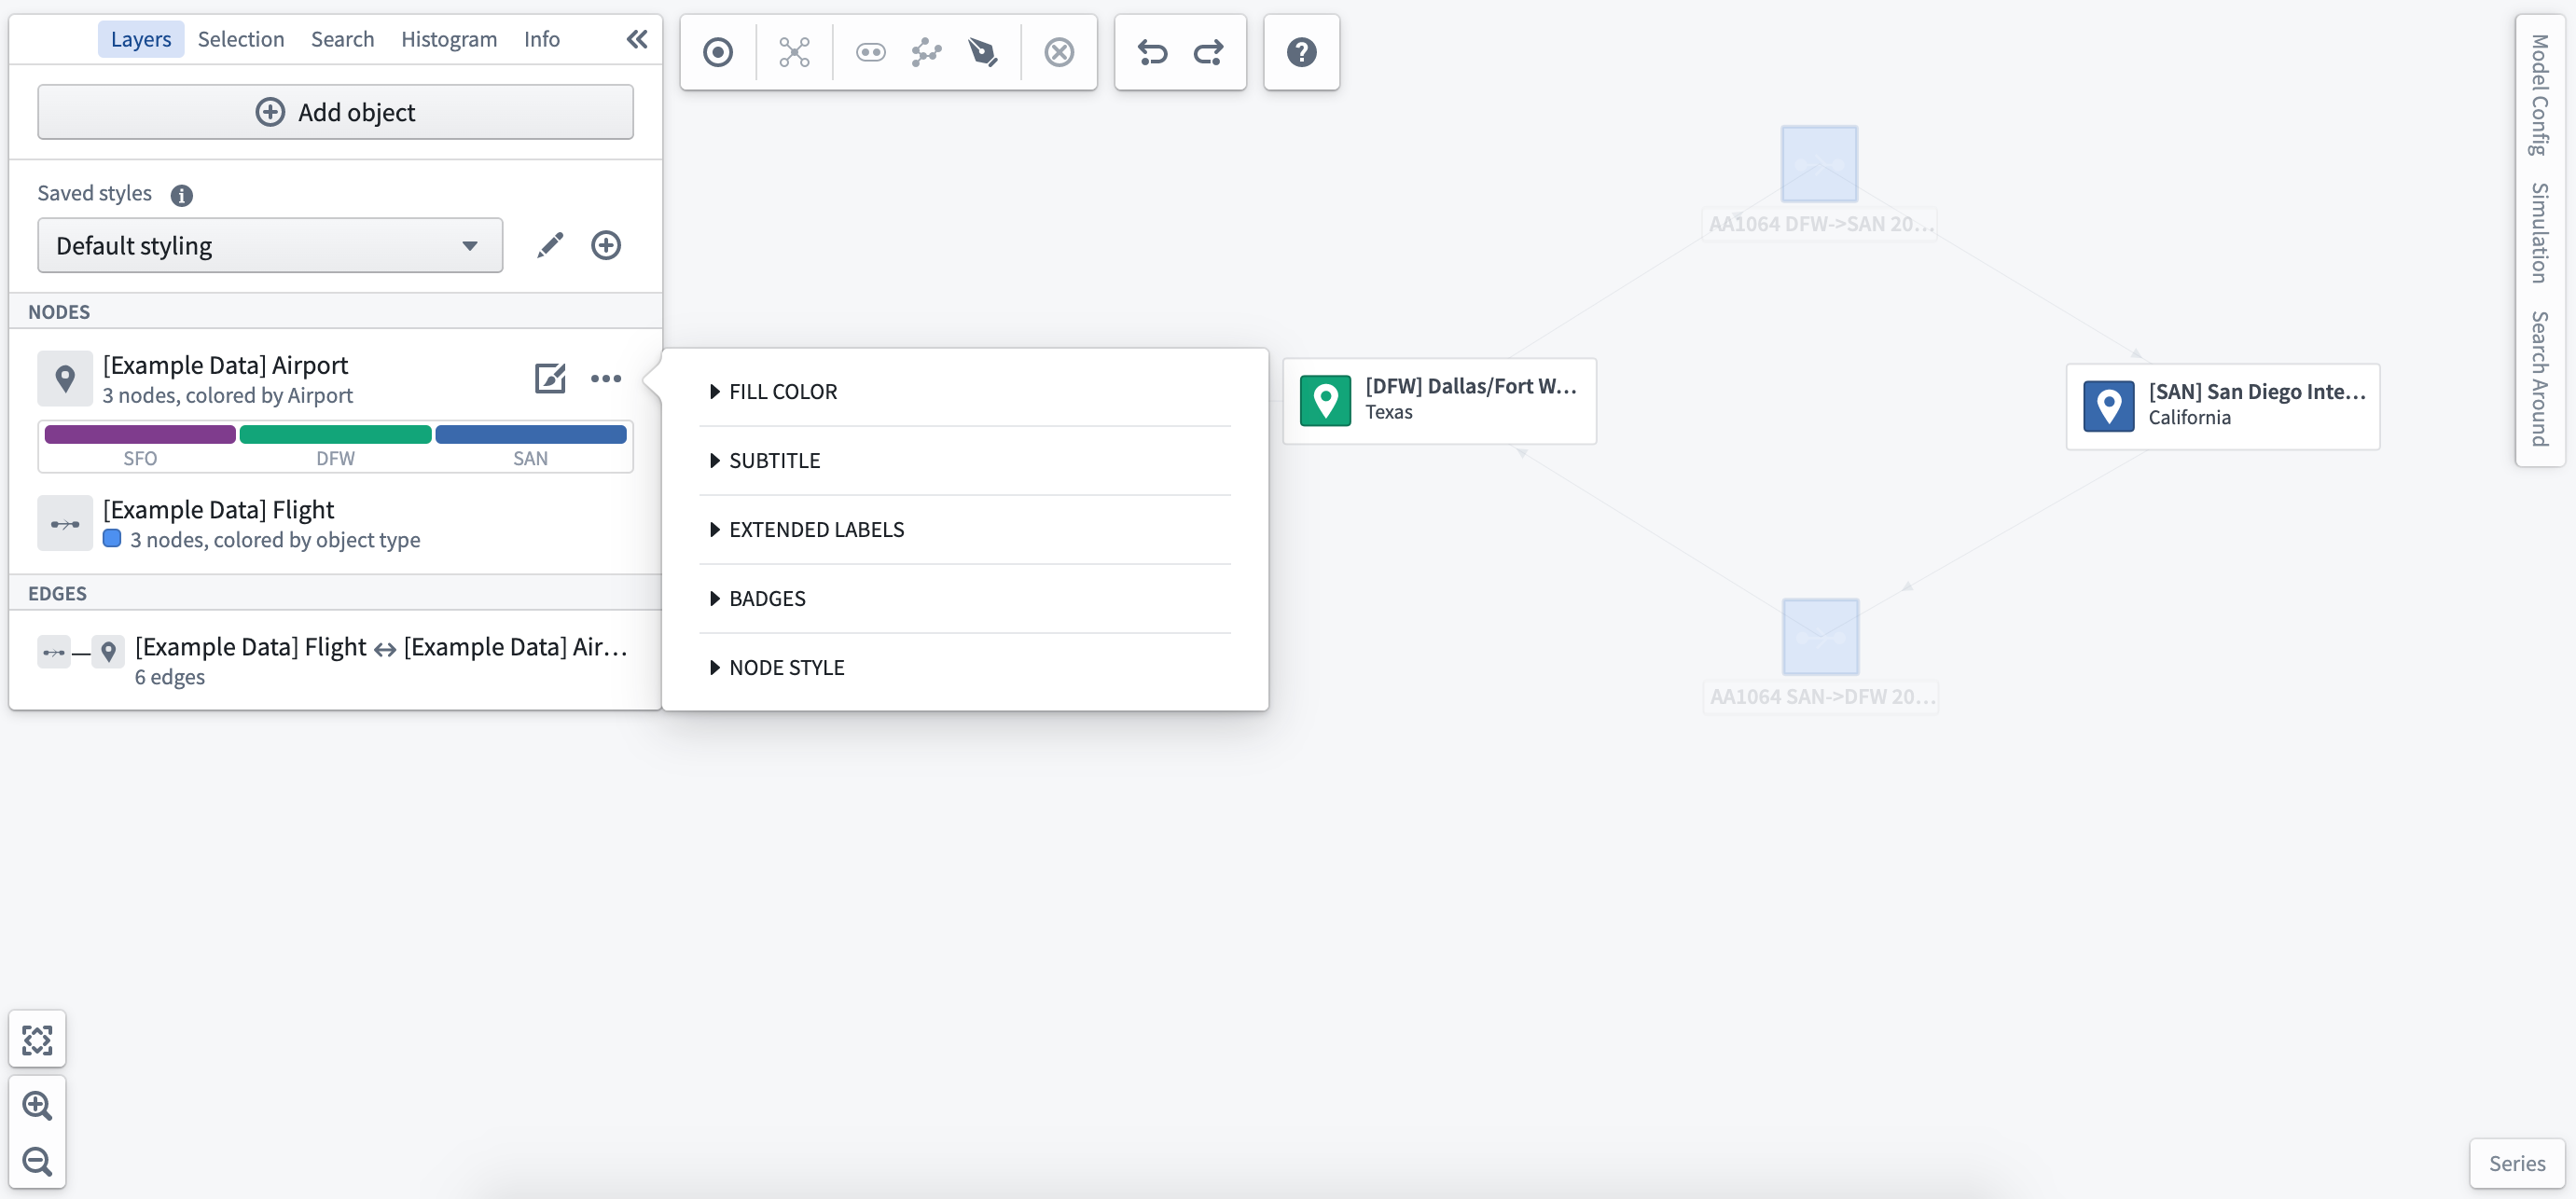
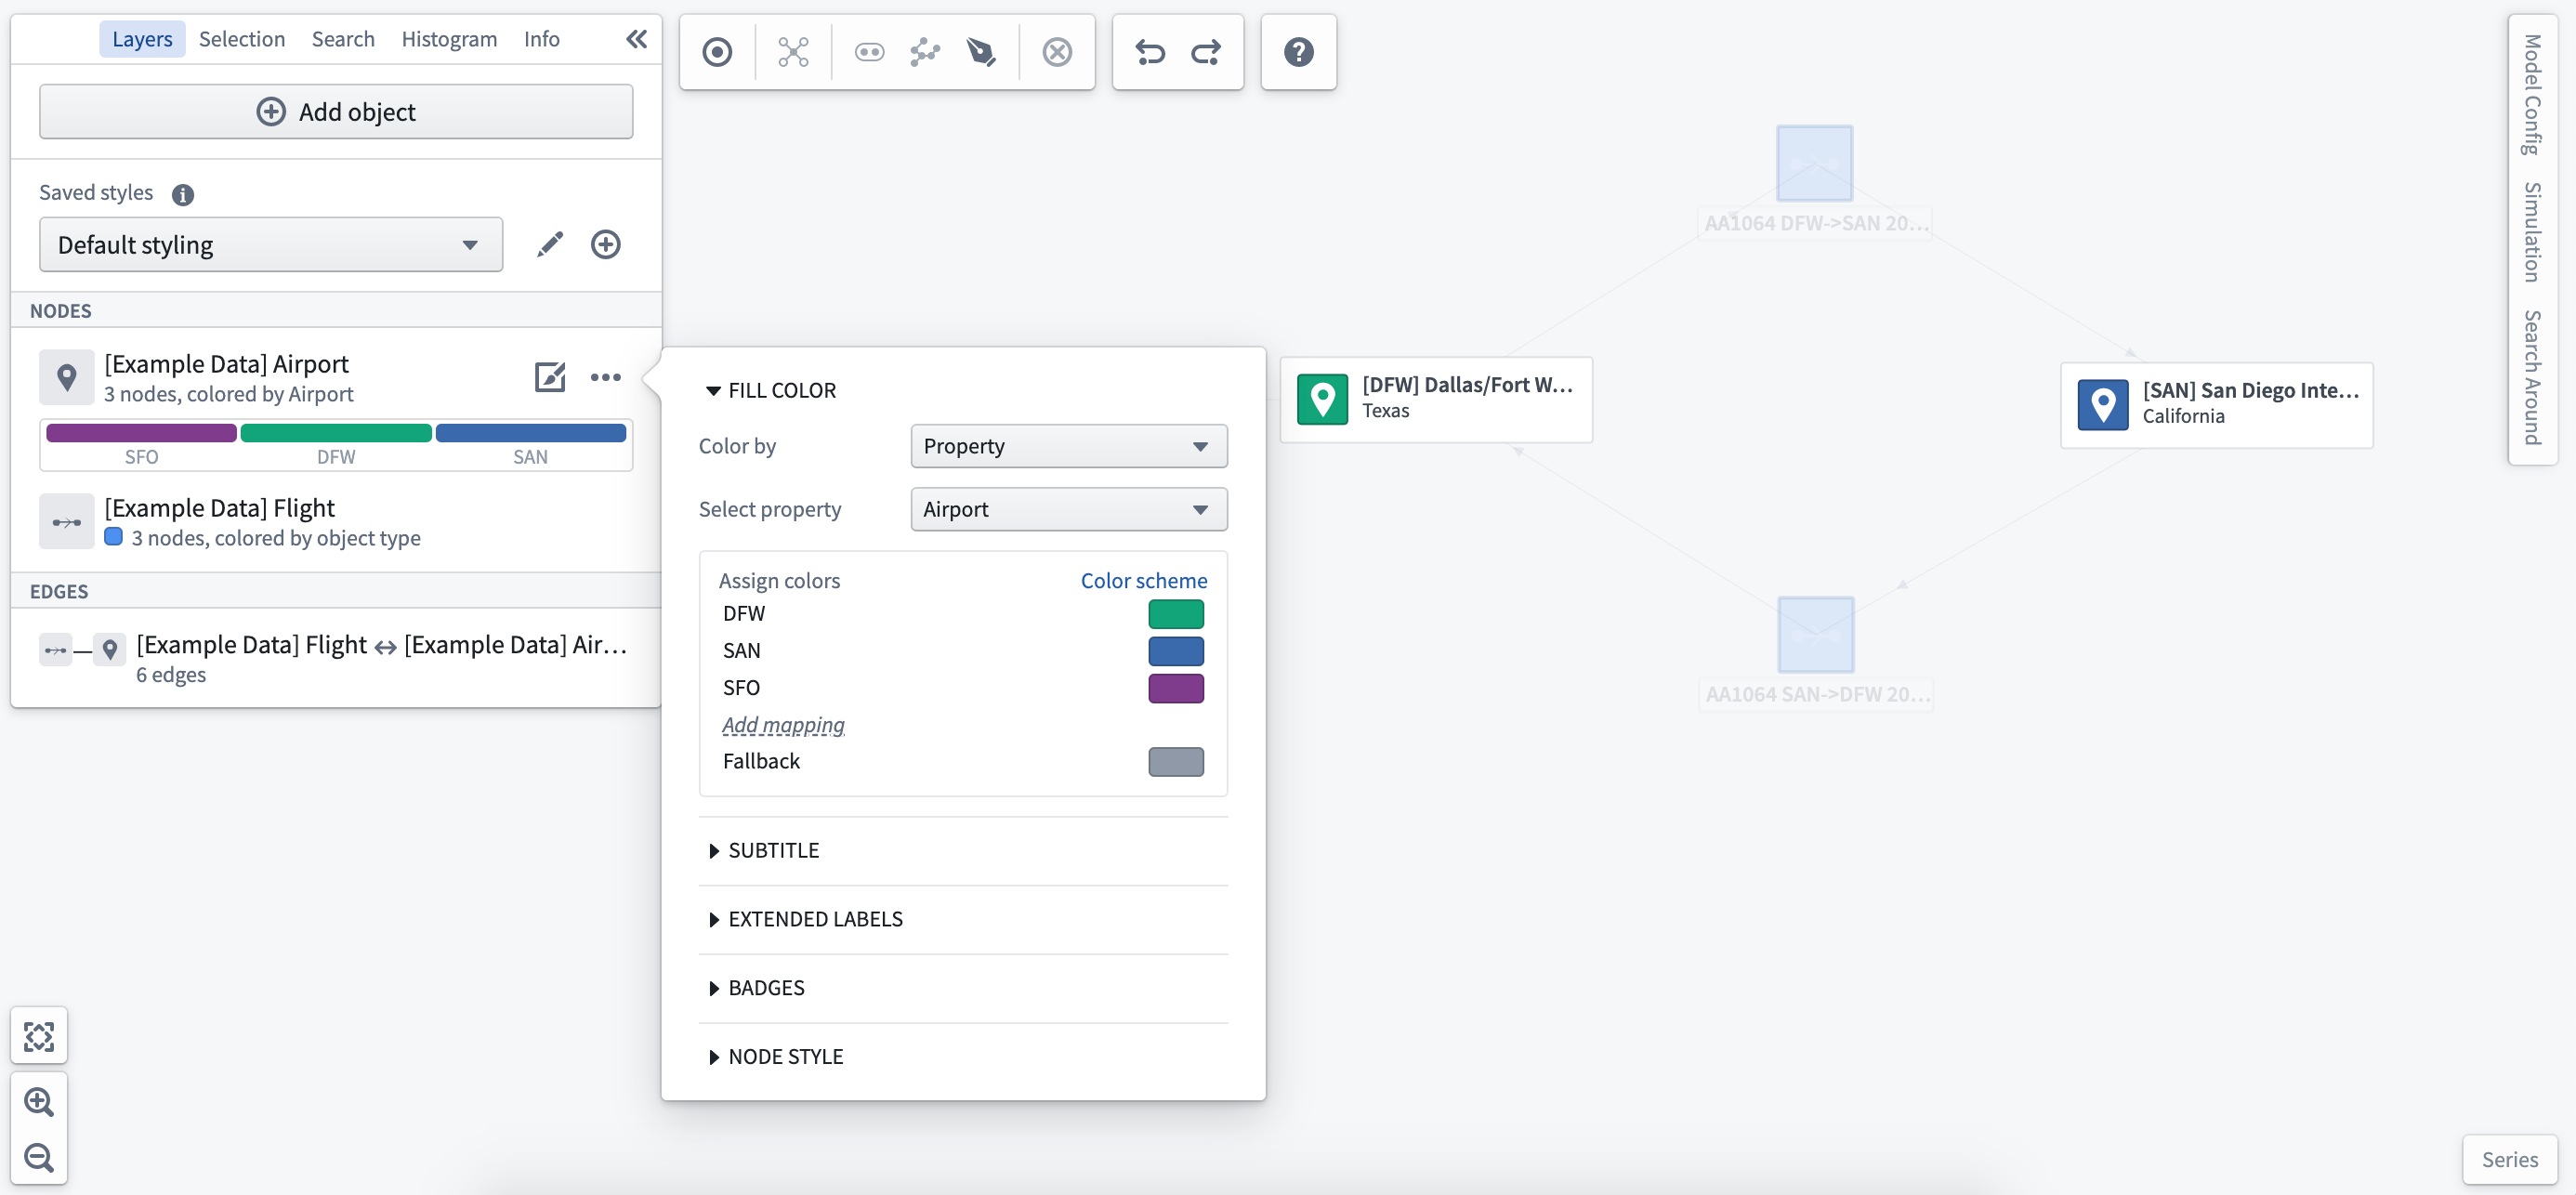
Color by
Select the Fill Color dropdown to choose the parameter by which to style as well as the color selection for all objects in this layer. You can select a time series measure as the Color by parameter, which will dynamically update the styling based on the selected time window. You can also color nodes using derived property functions.
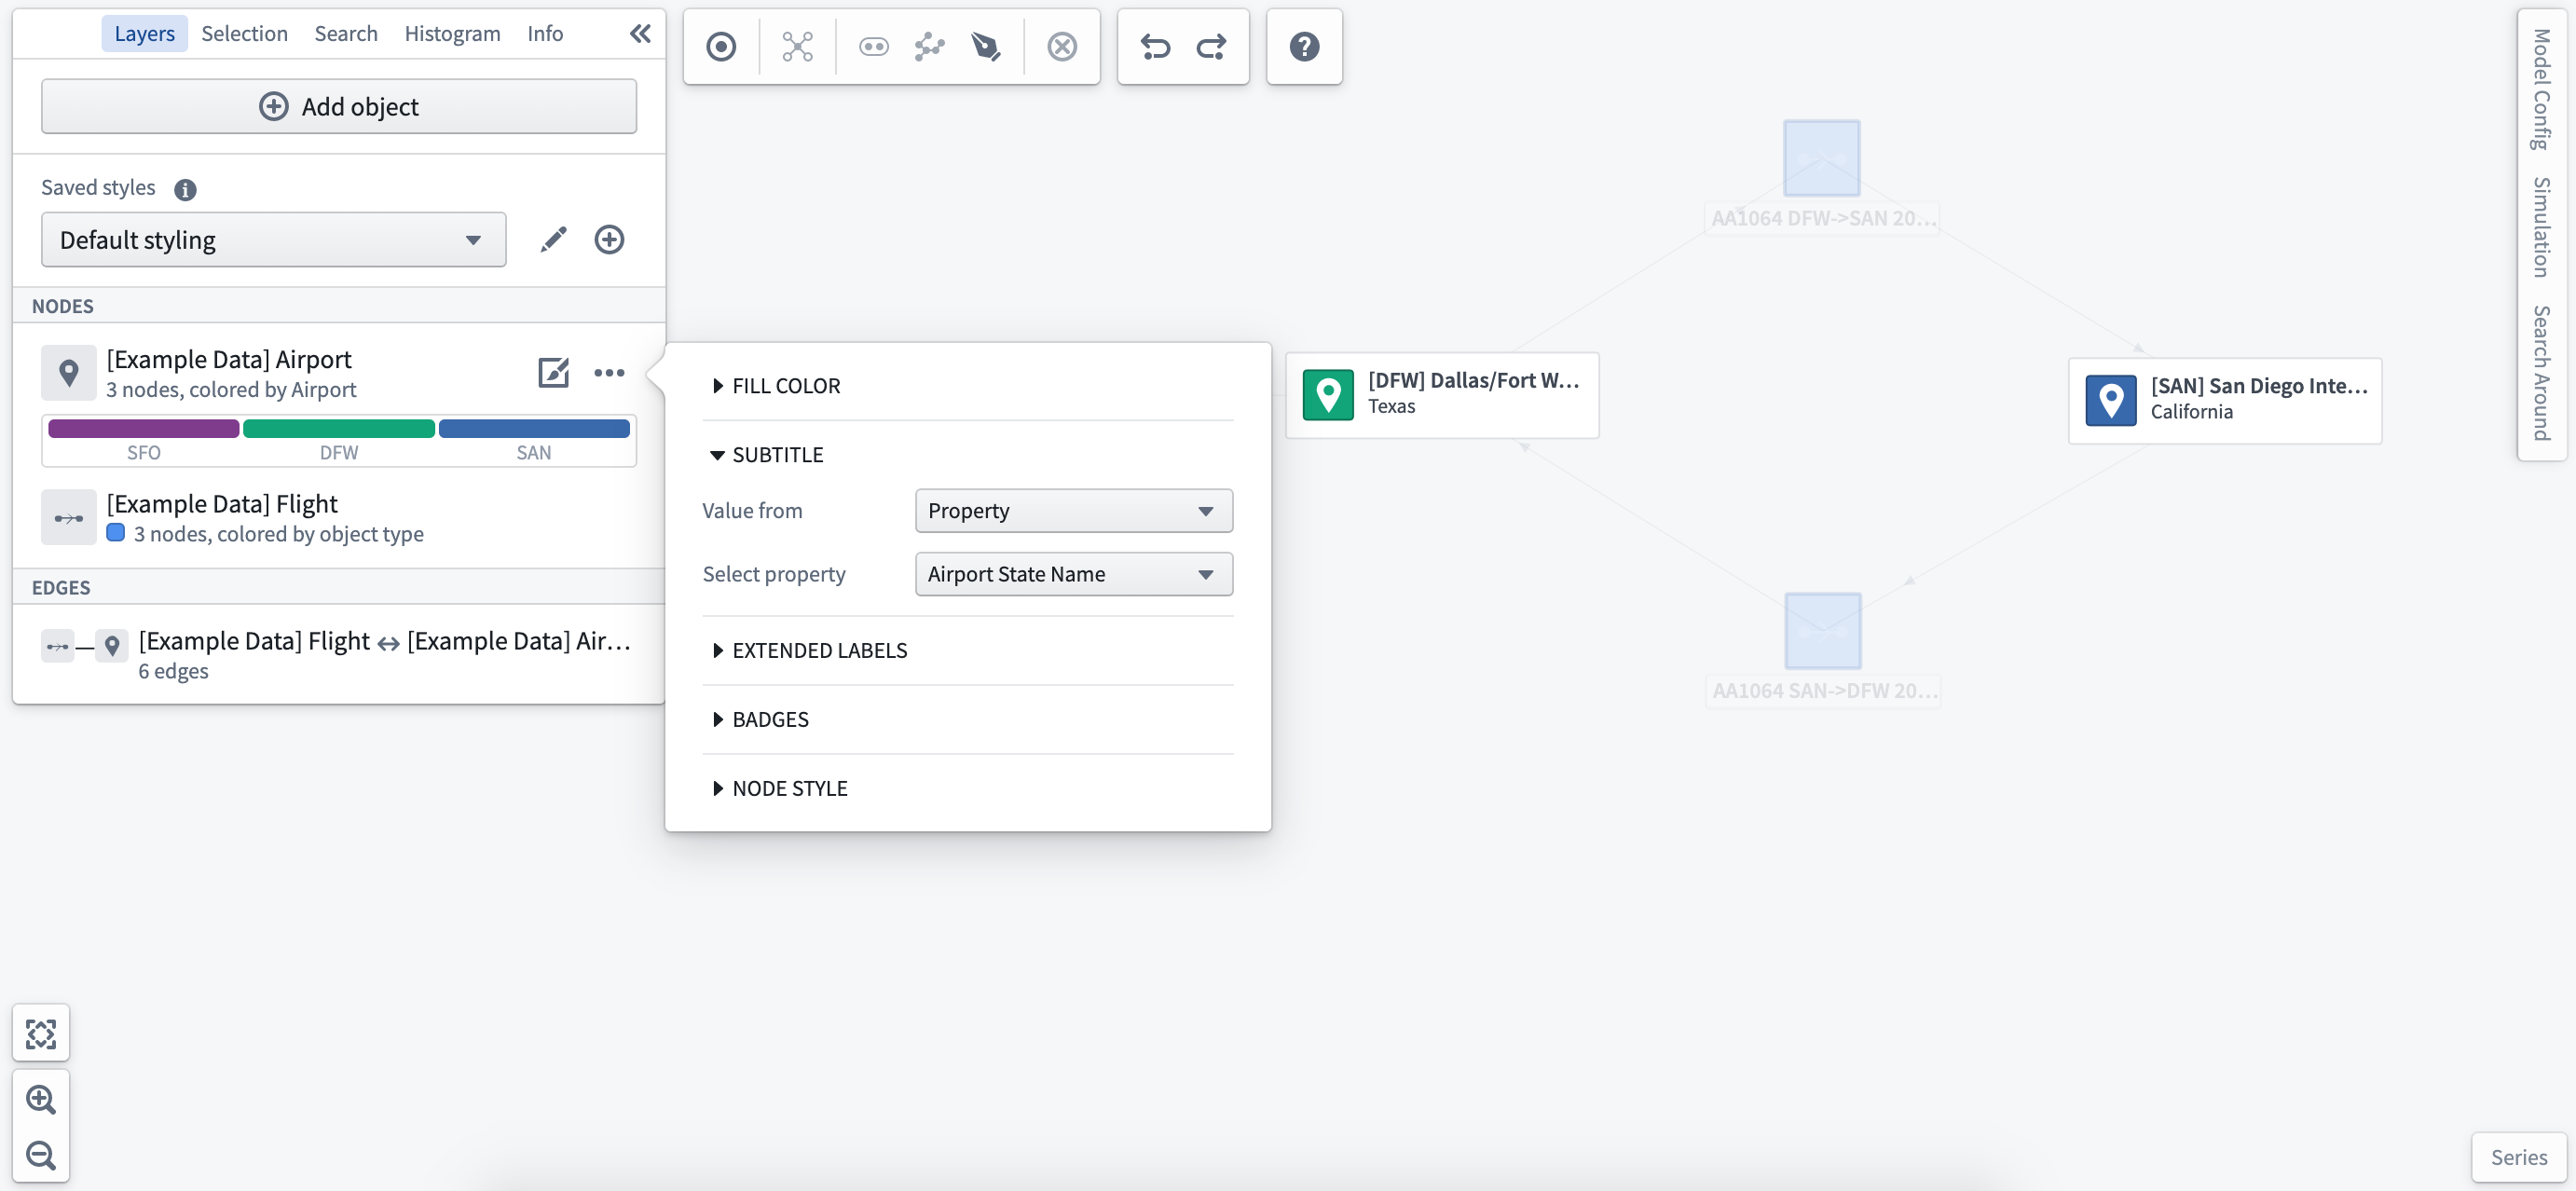
Subtitle
You can add subtitles to each object on the object type or a selected property of the object. Subtitles will display on all objects of the same type on the graph.
Extended labels
Selecting Extended Labels allows you to add specific readouts to the object nodes selected. You can select from real-world time series readings or simulated values to allow you to compare current and modeled conditions in a single view.
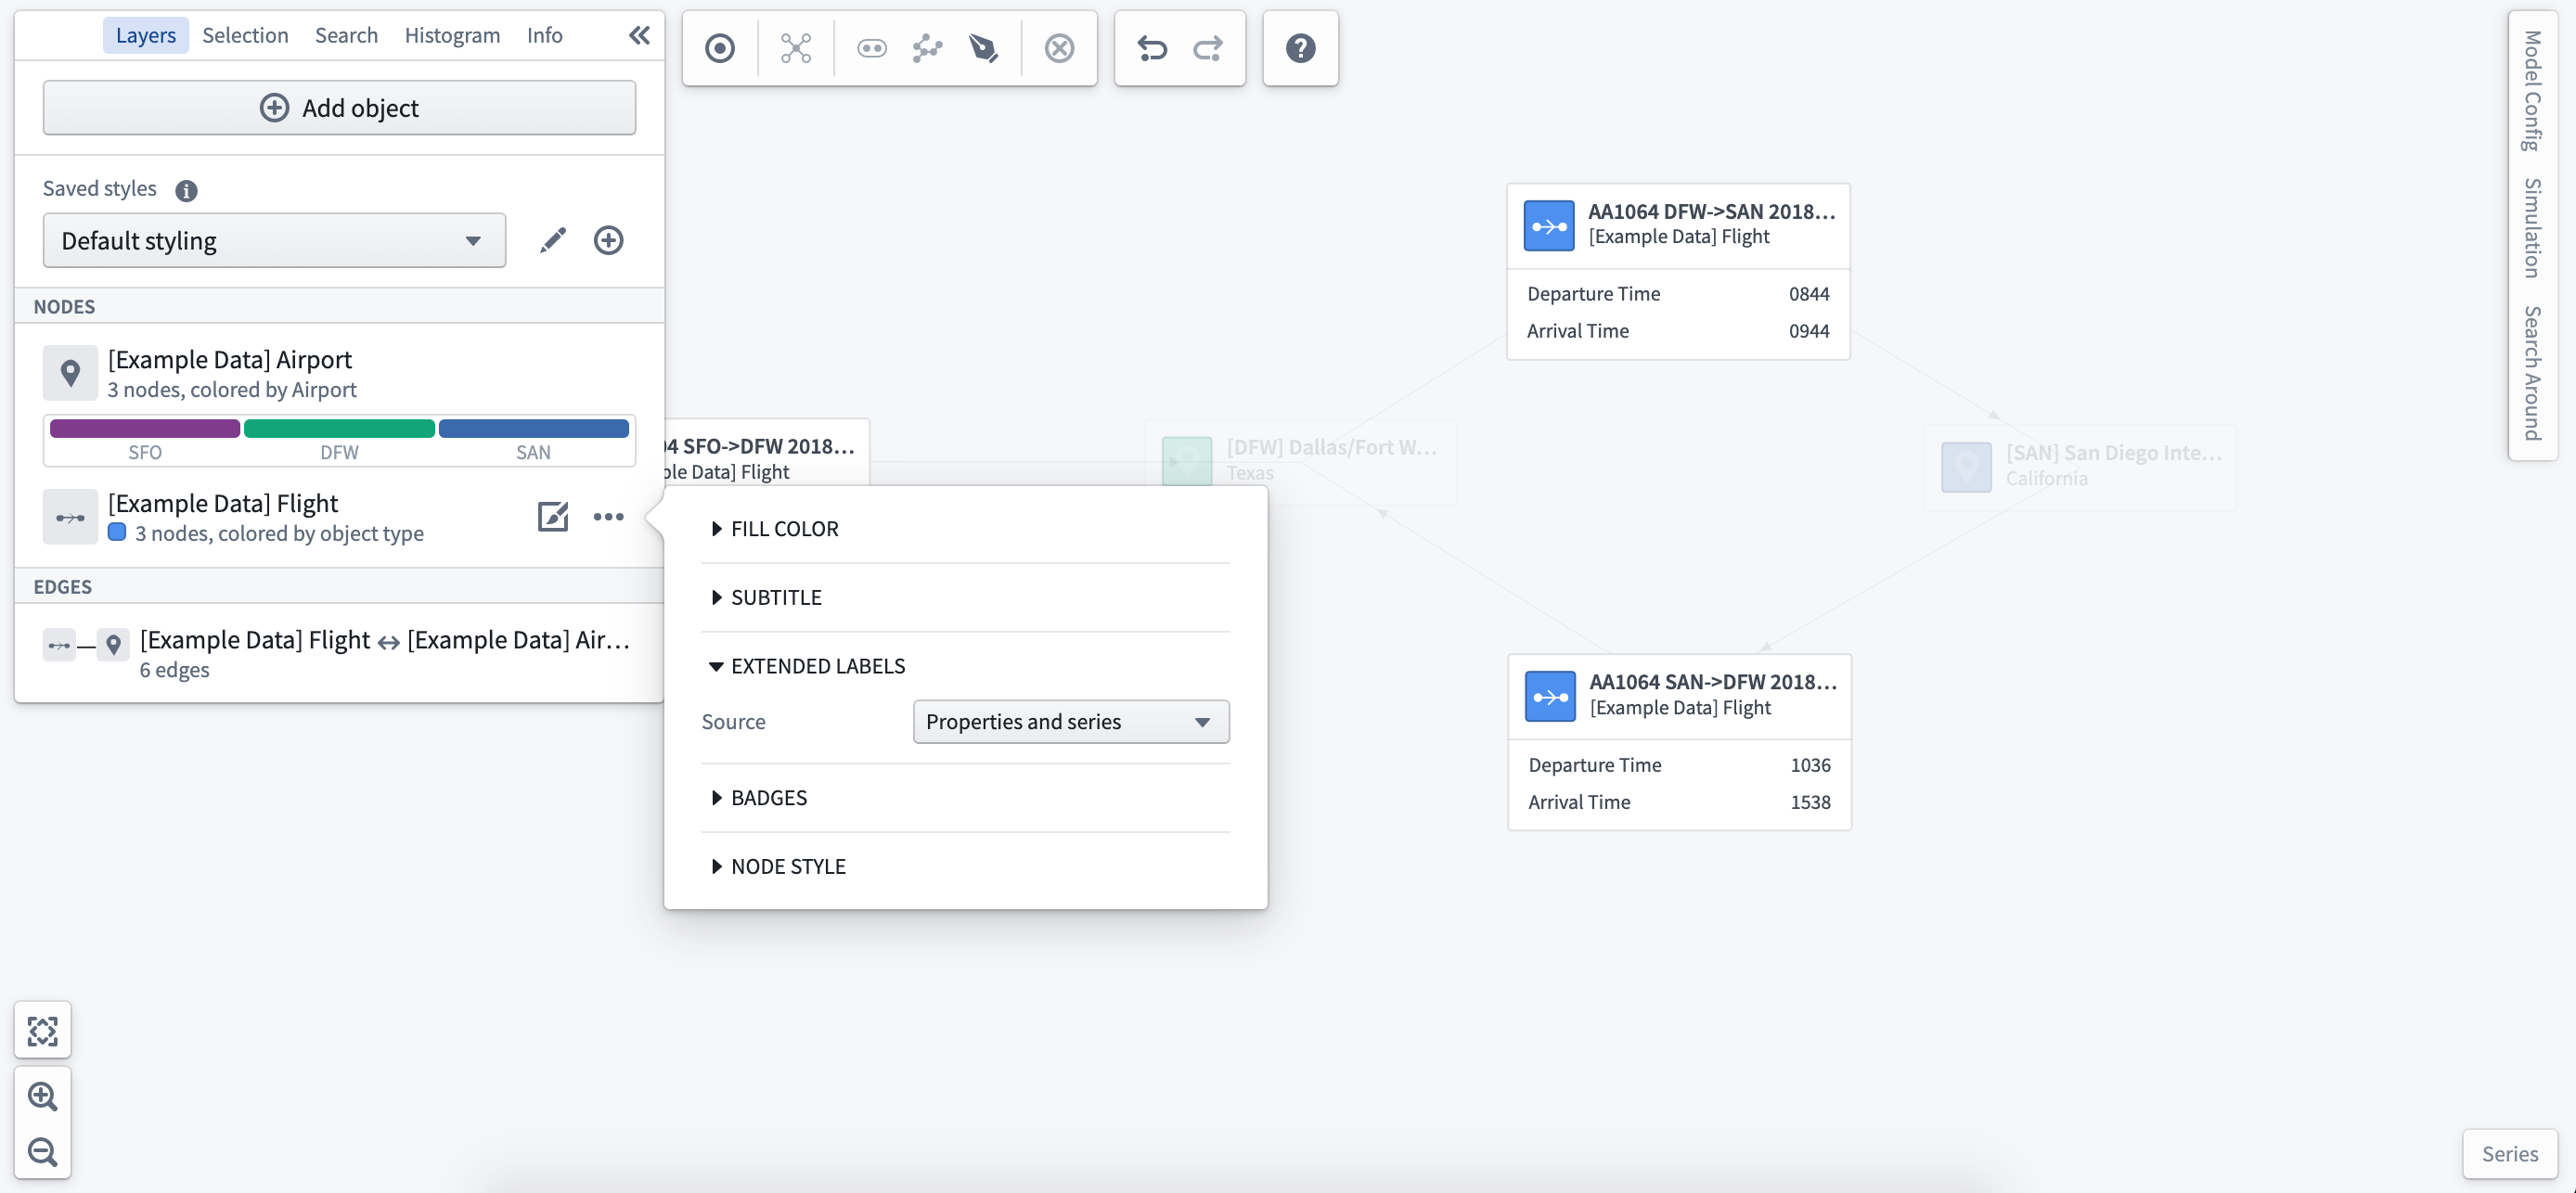
Once you have set the extended label styling, you can select the properties or time series to display from the object selection panel at the left of the workspace.
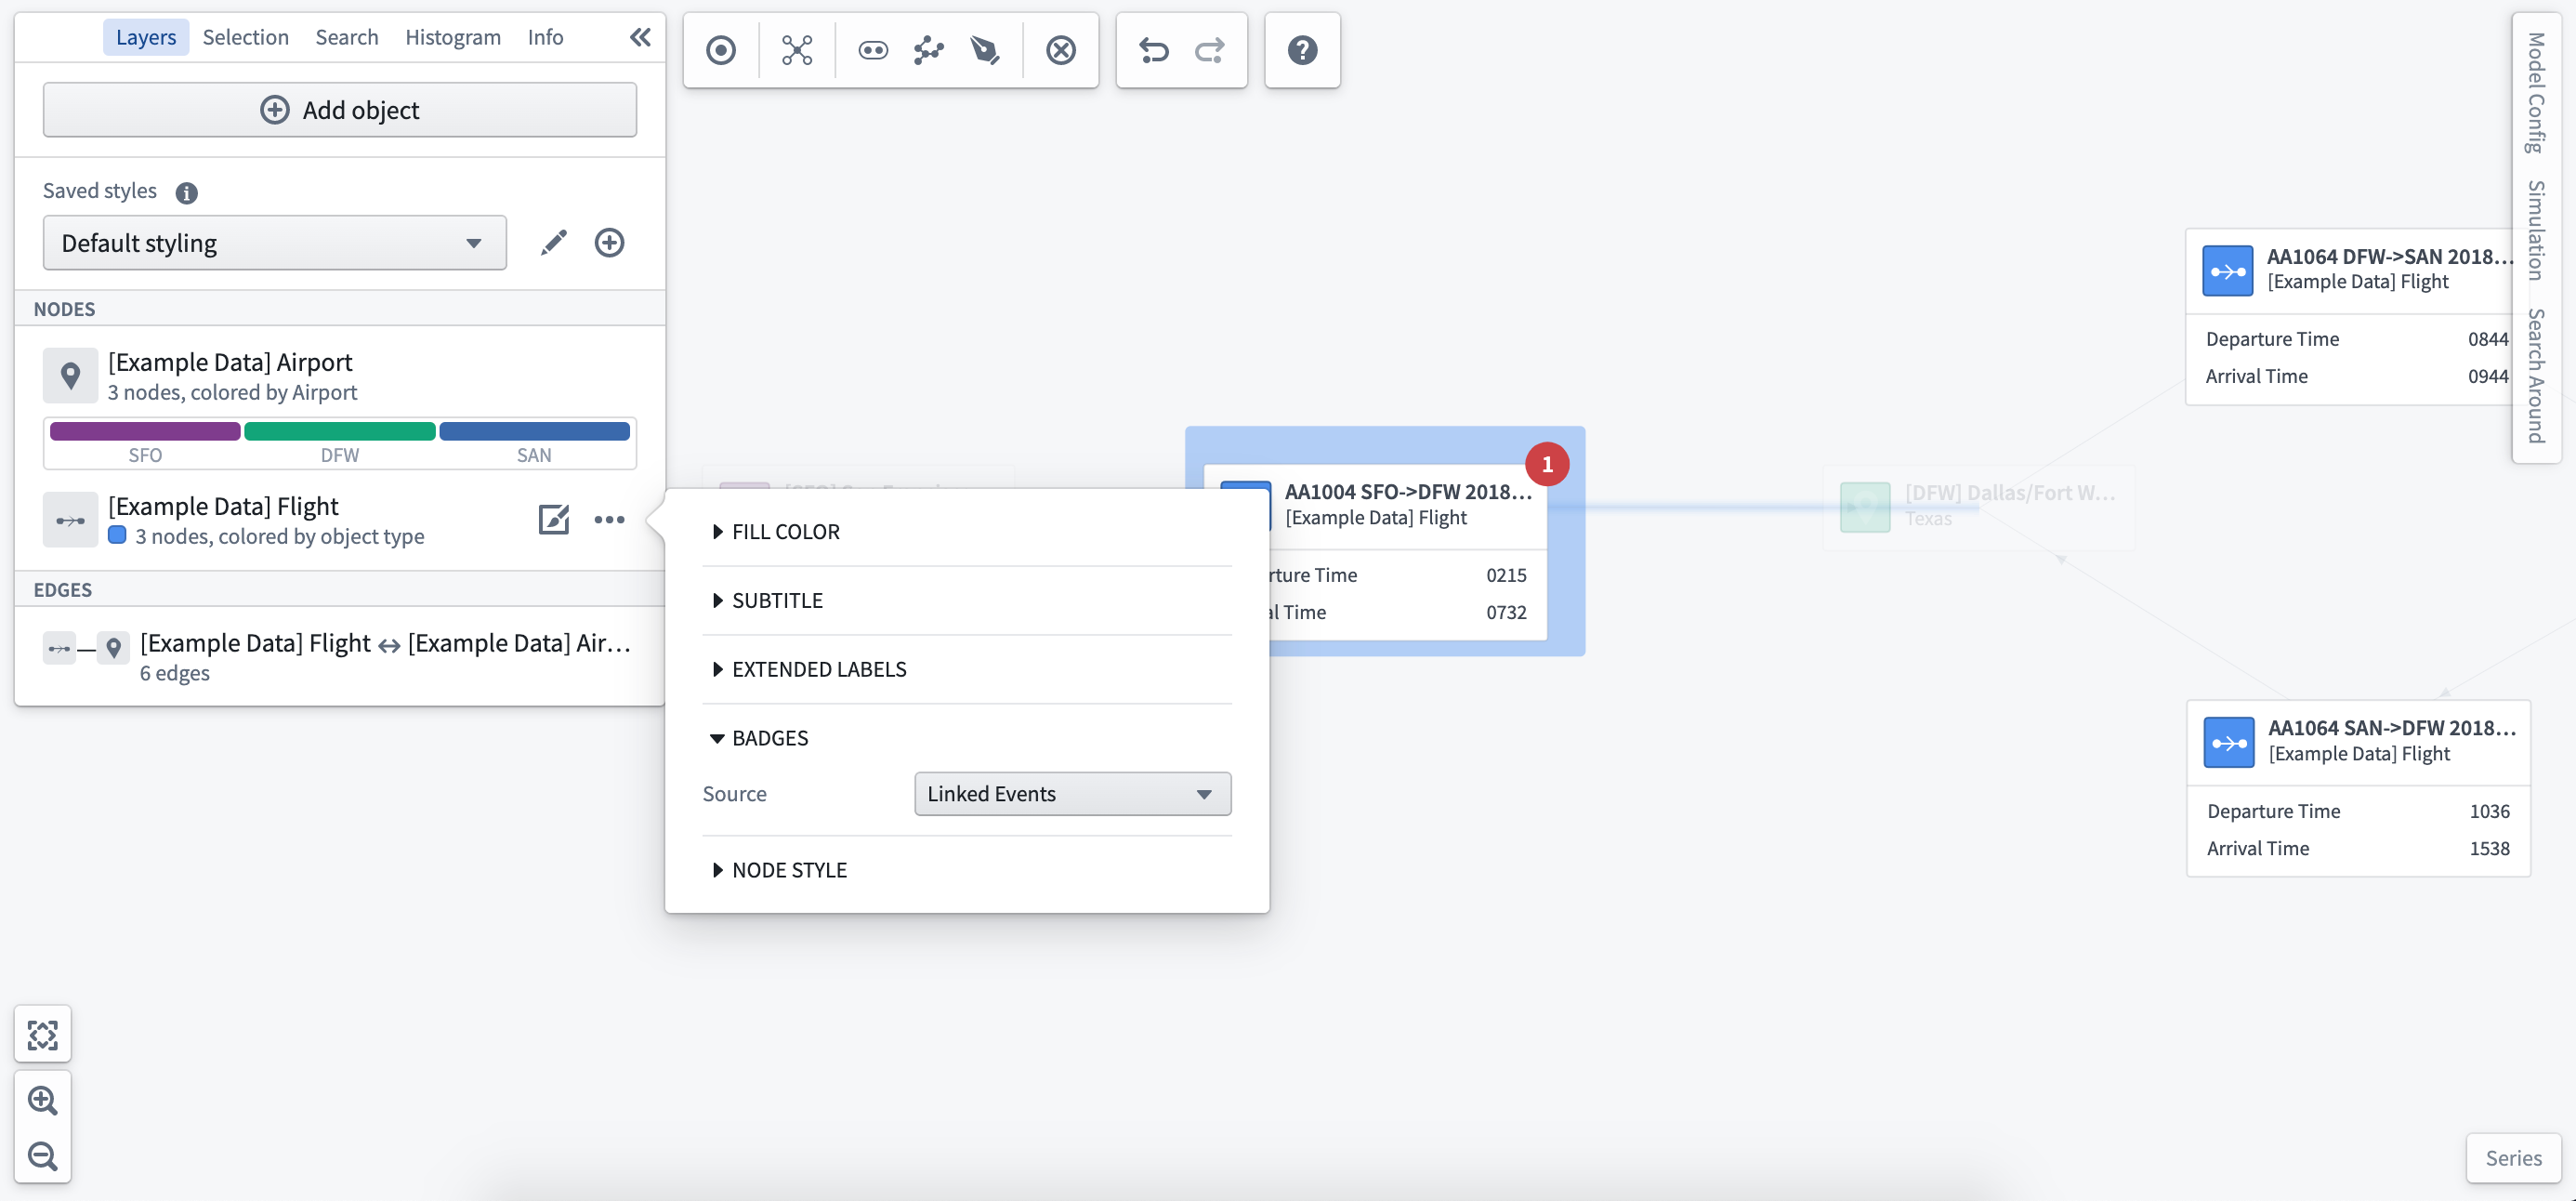
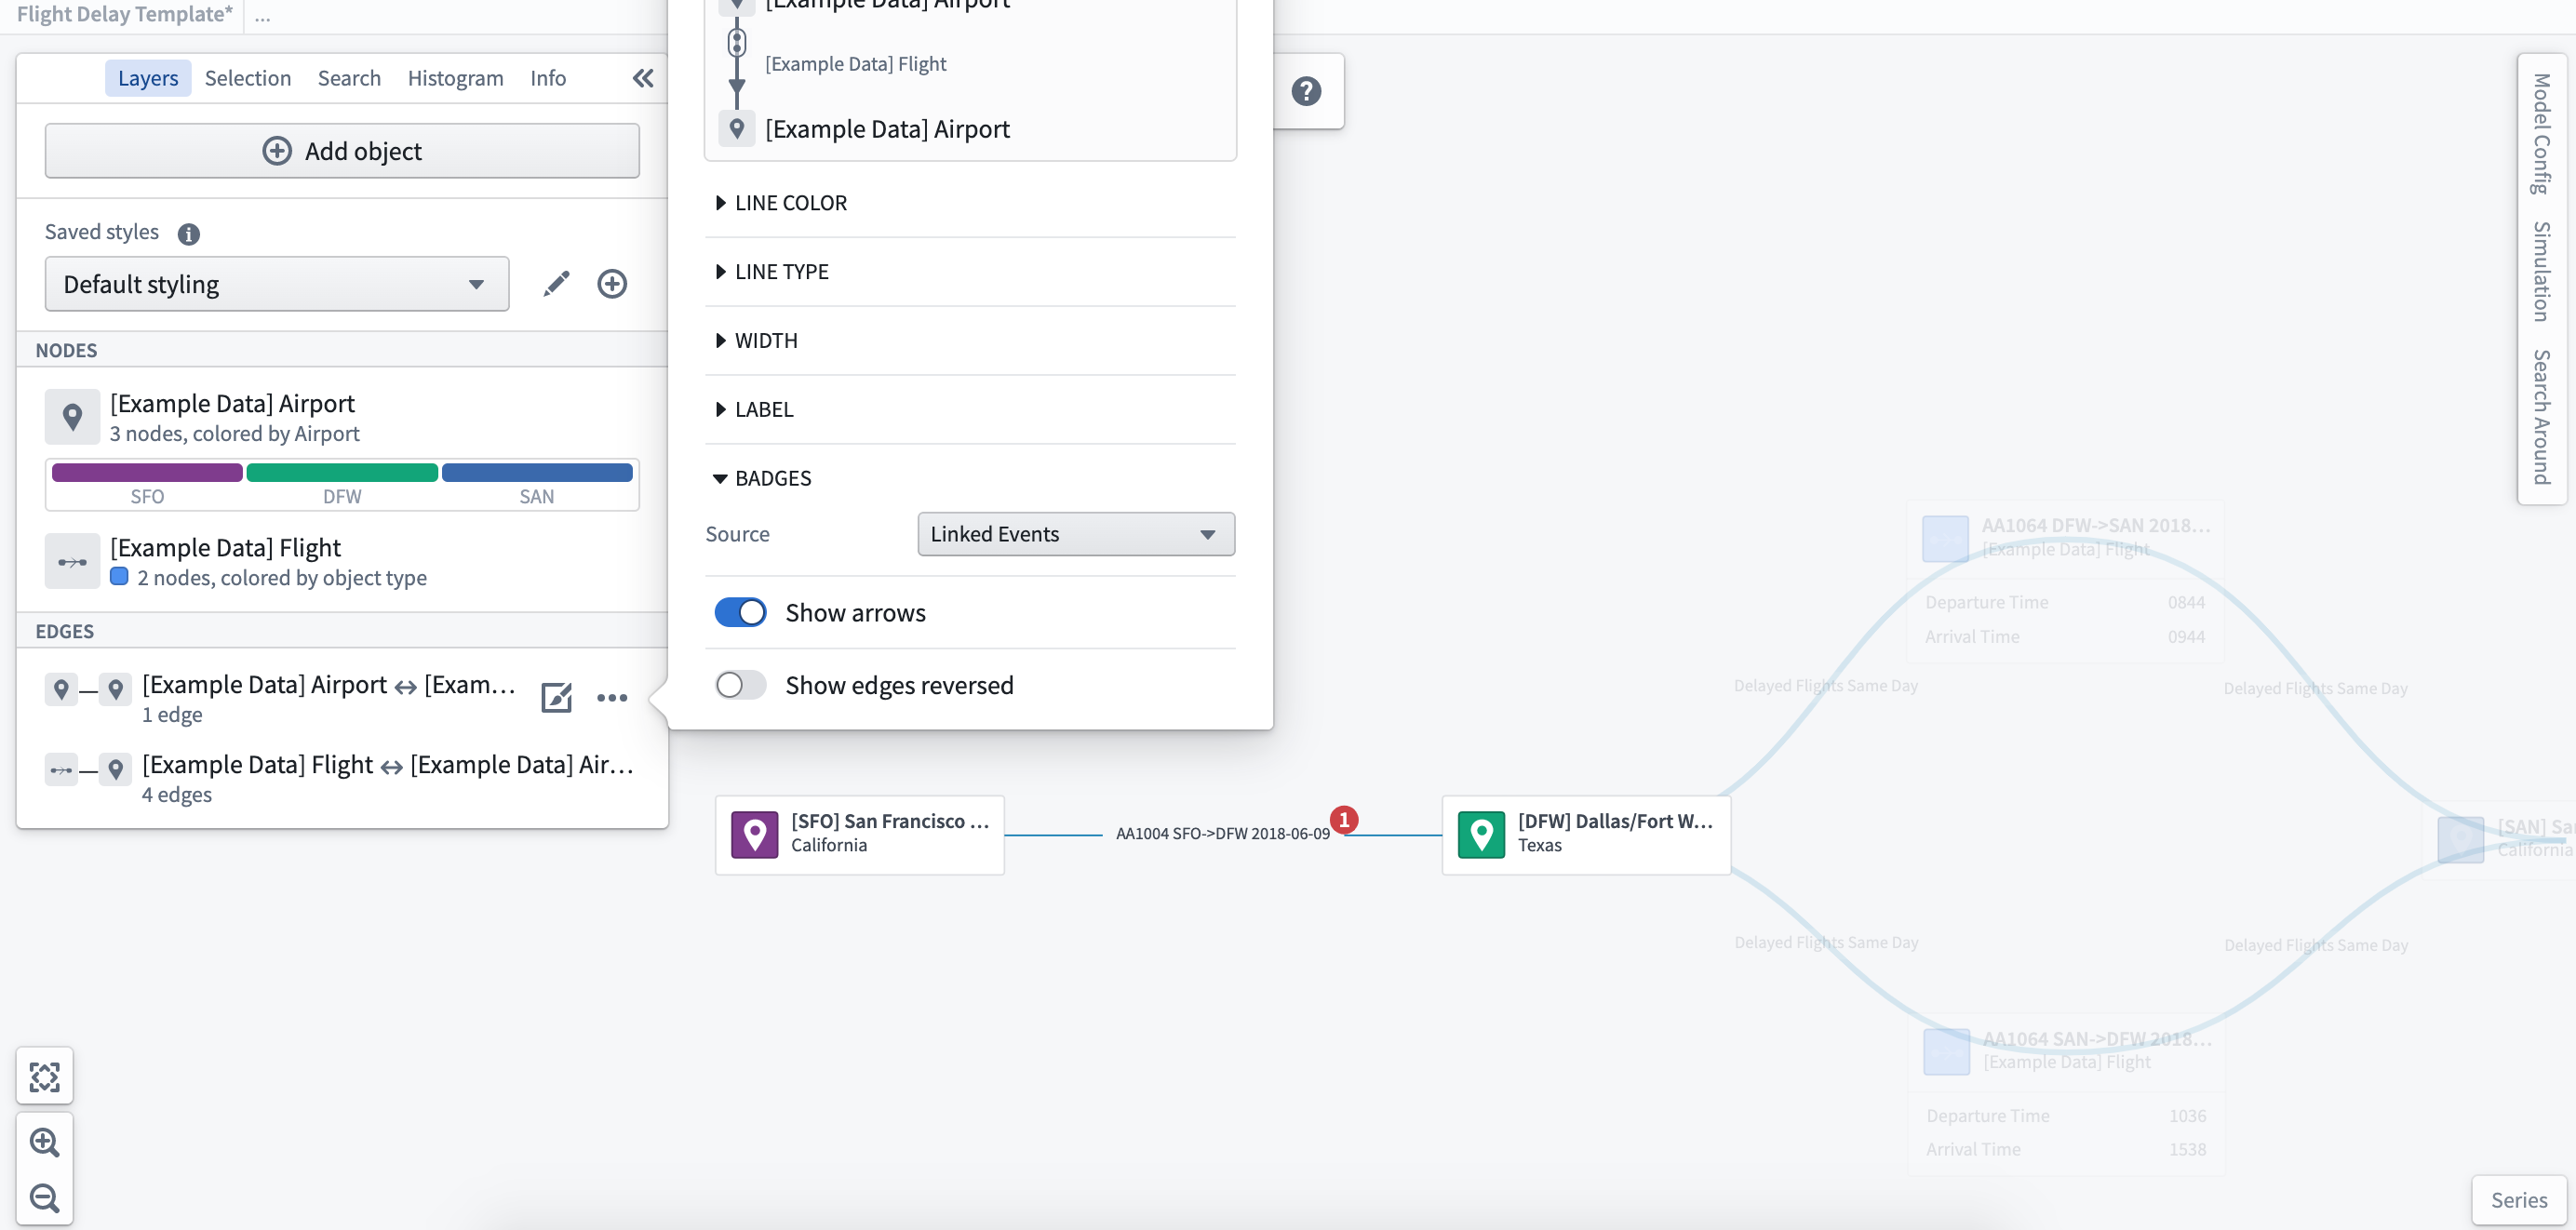
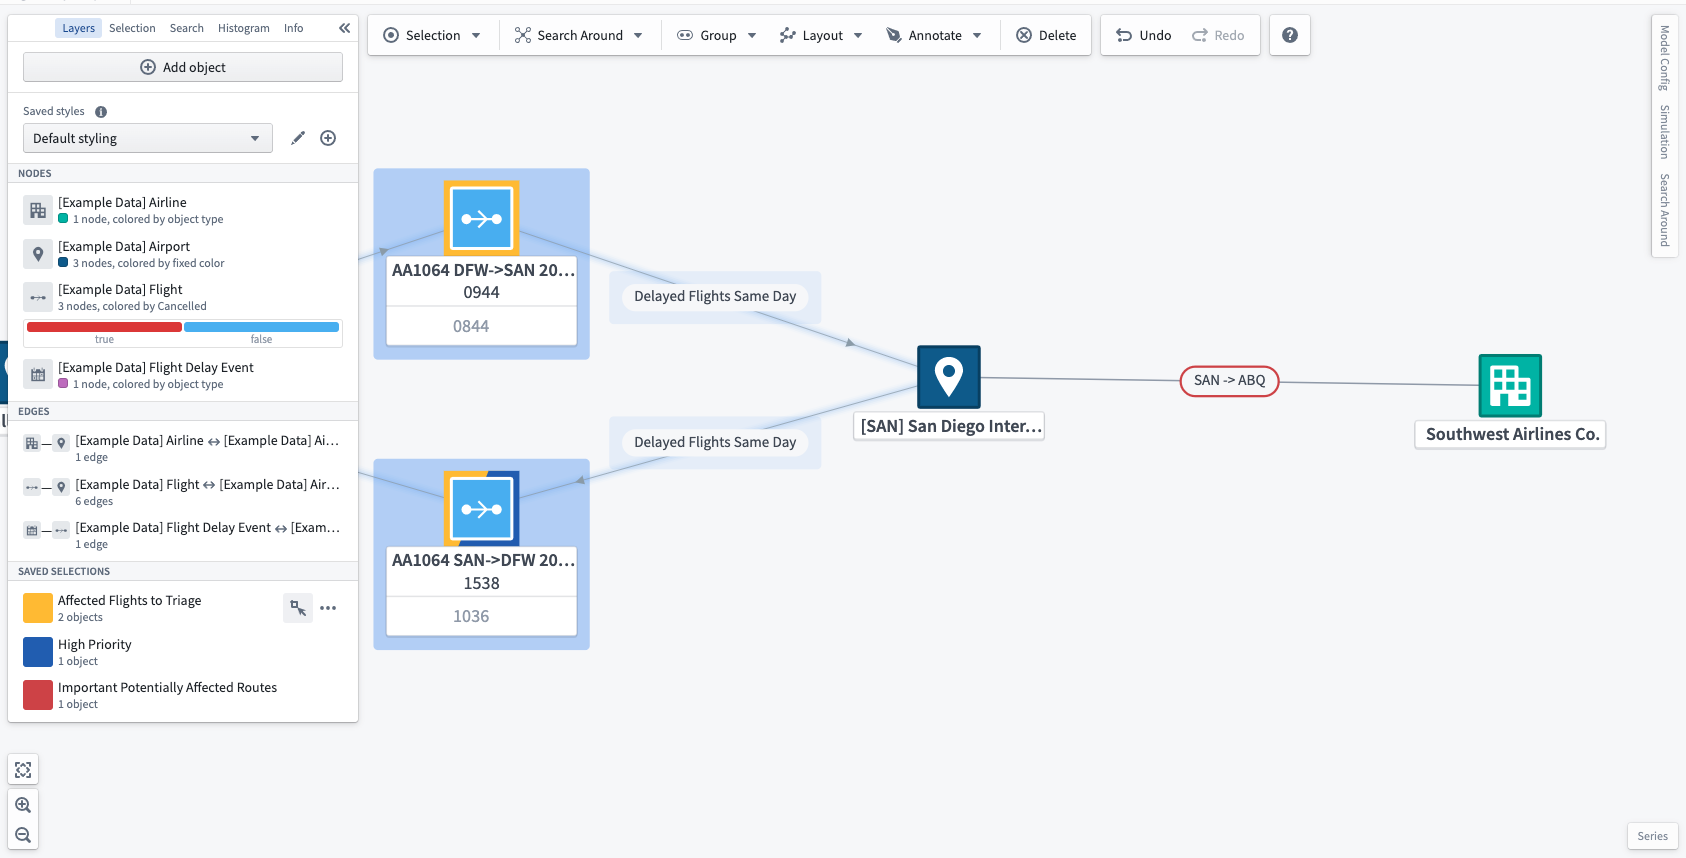
Badges
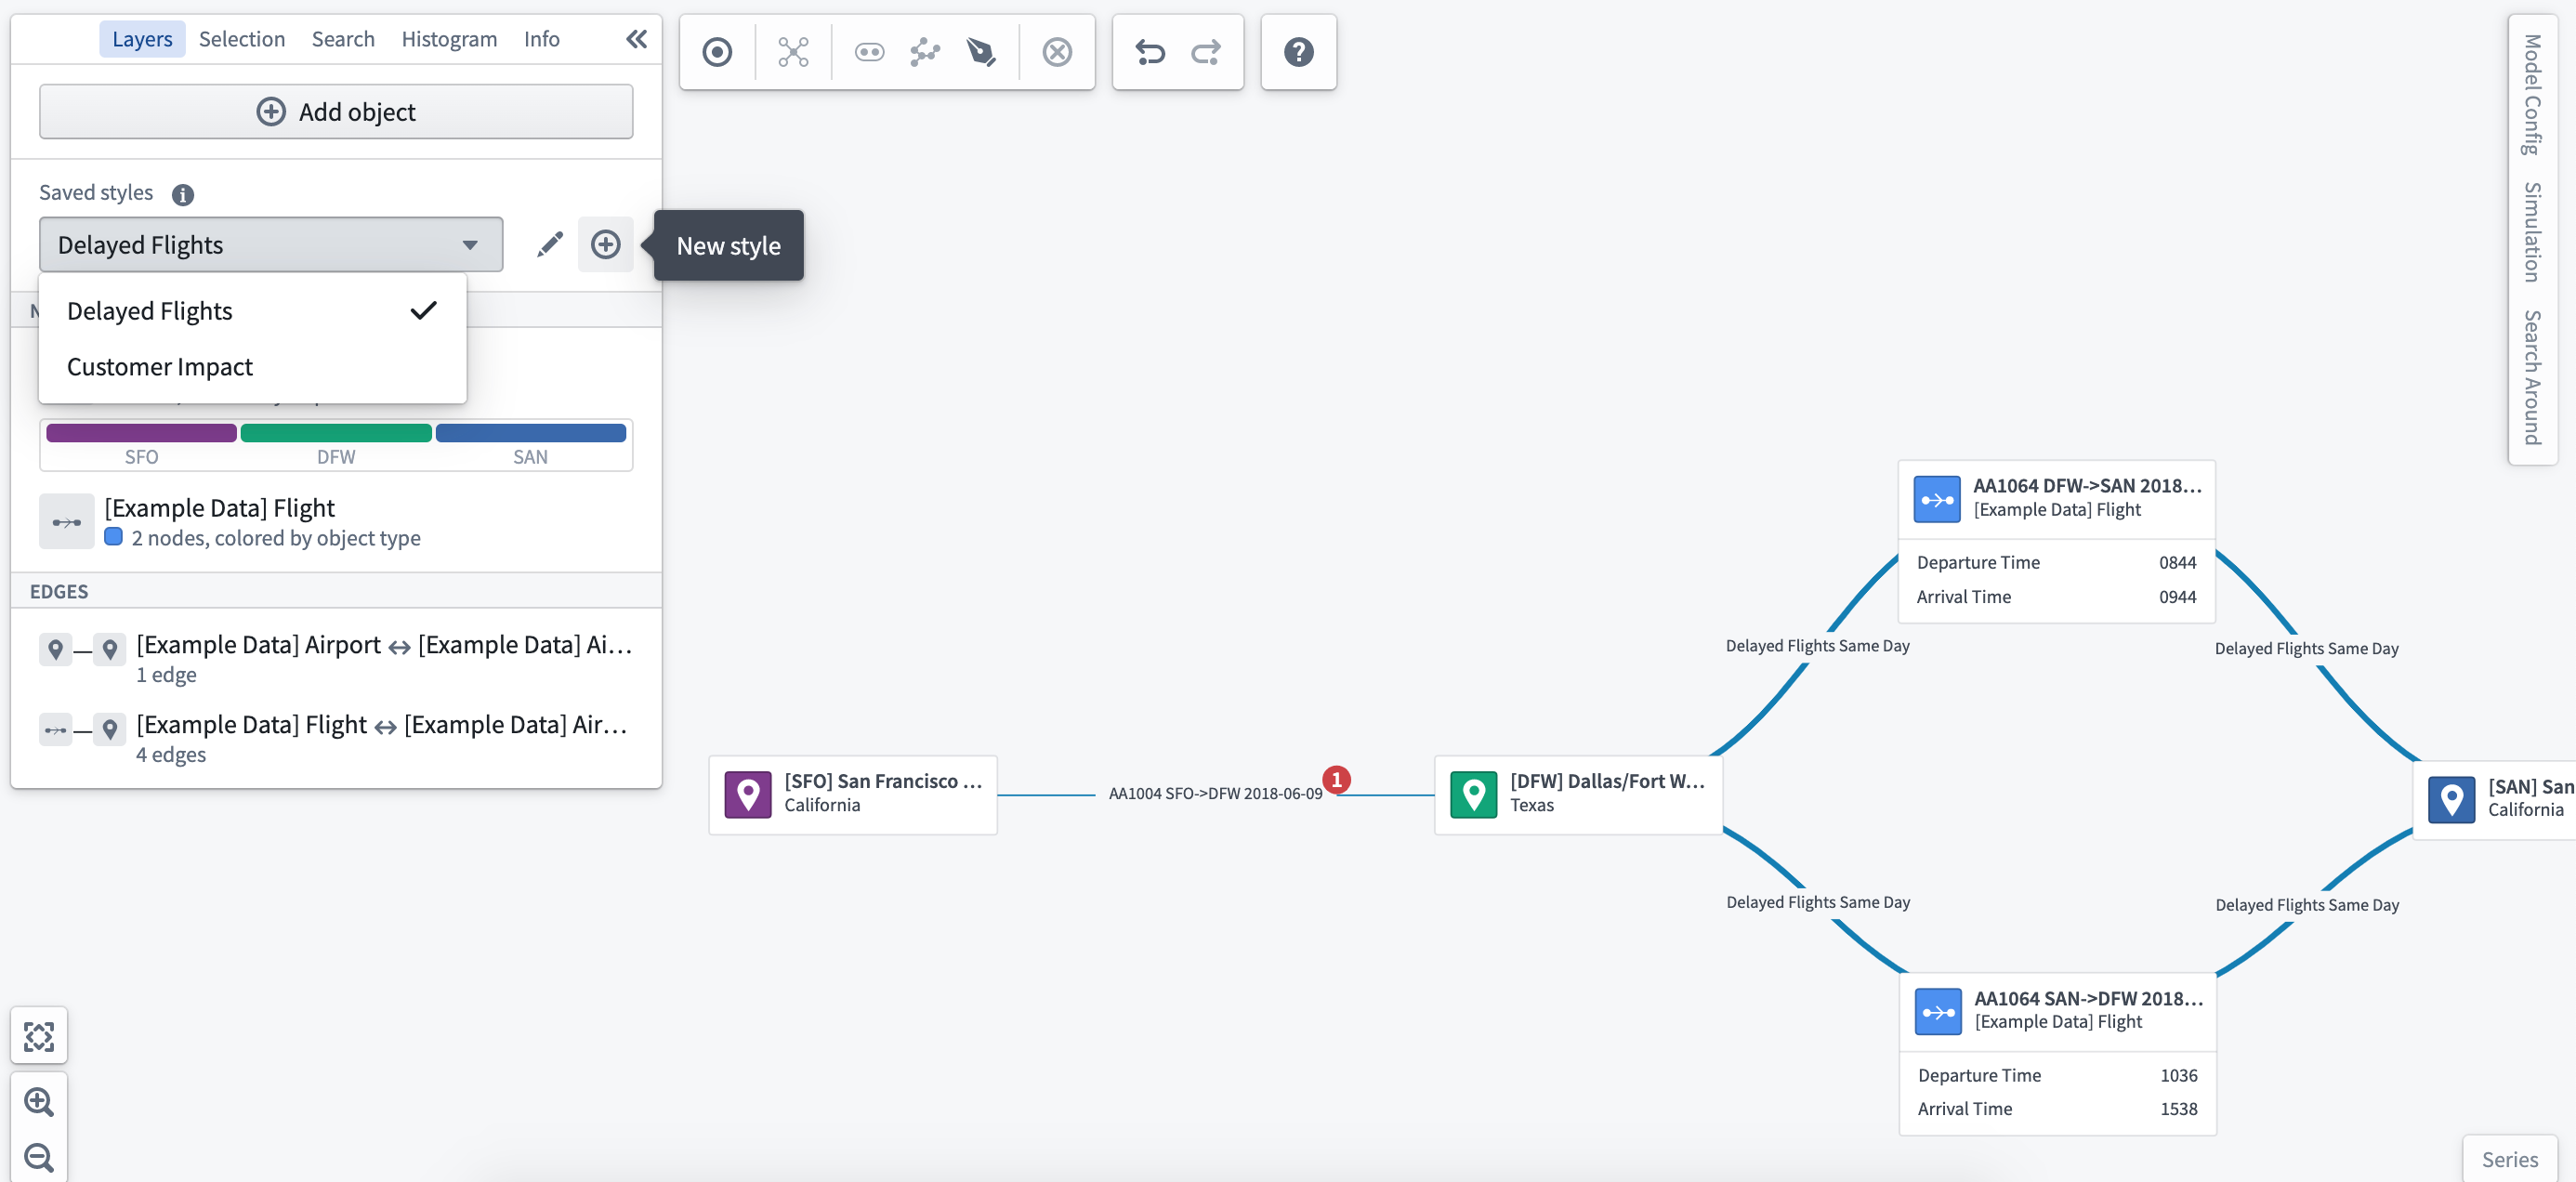
Add badges to indicate the number of linked events to a specific object type. In the screenshot below, you can see that there is one delayed flight event.
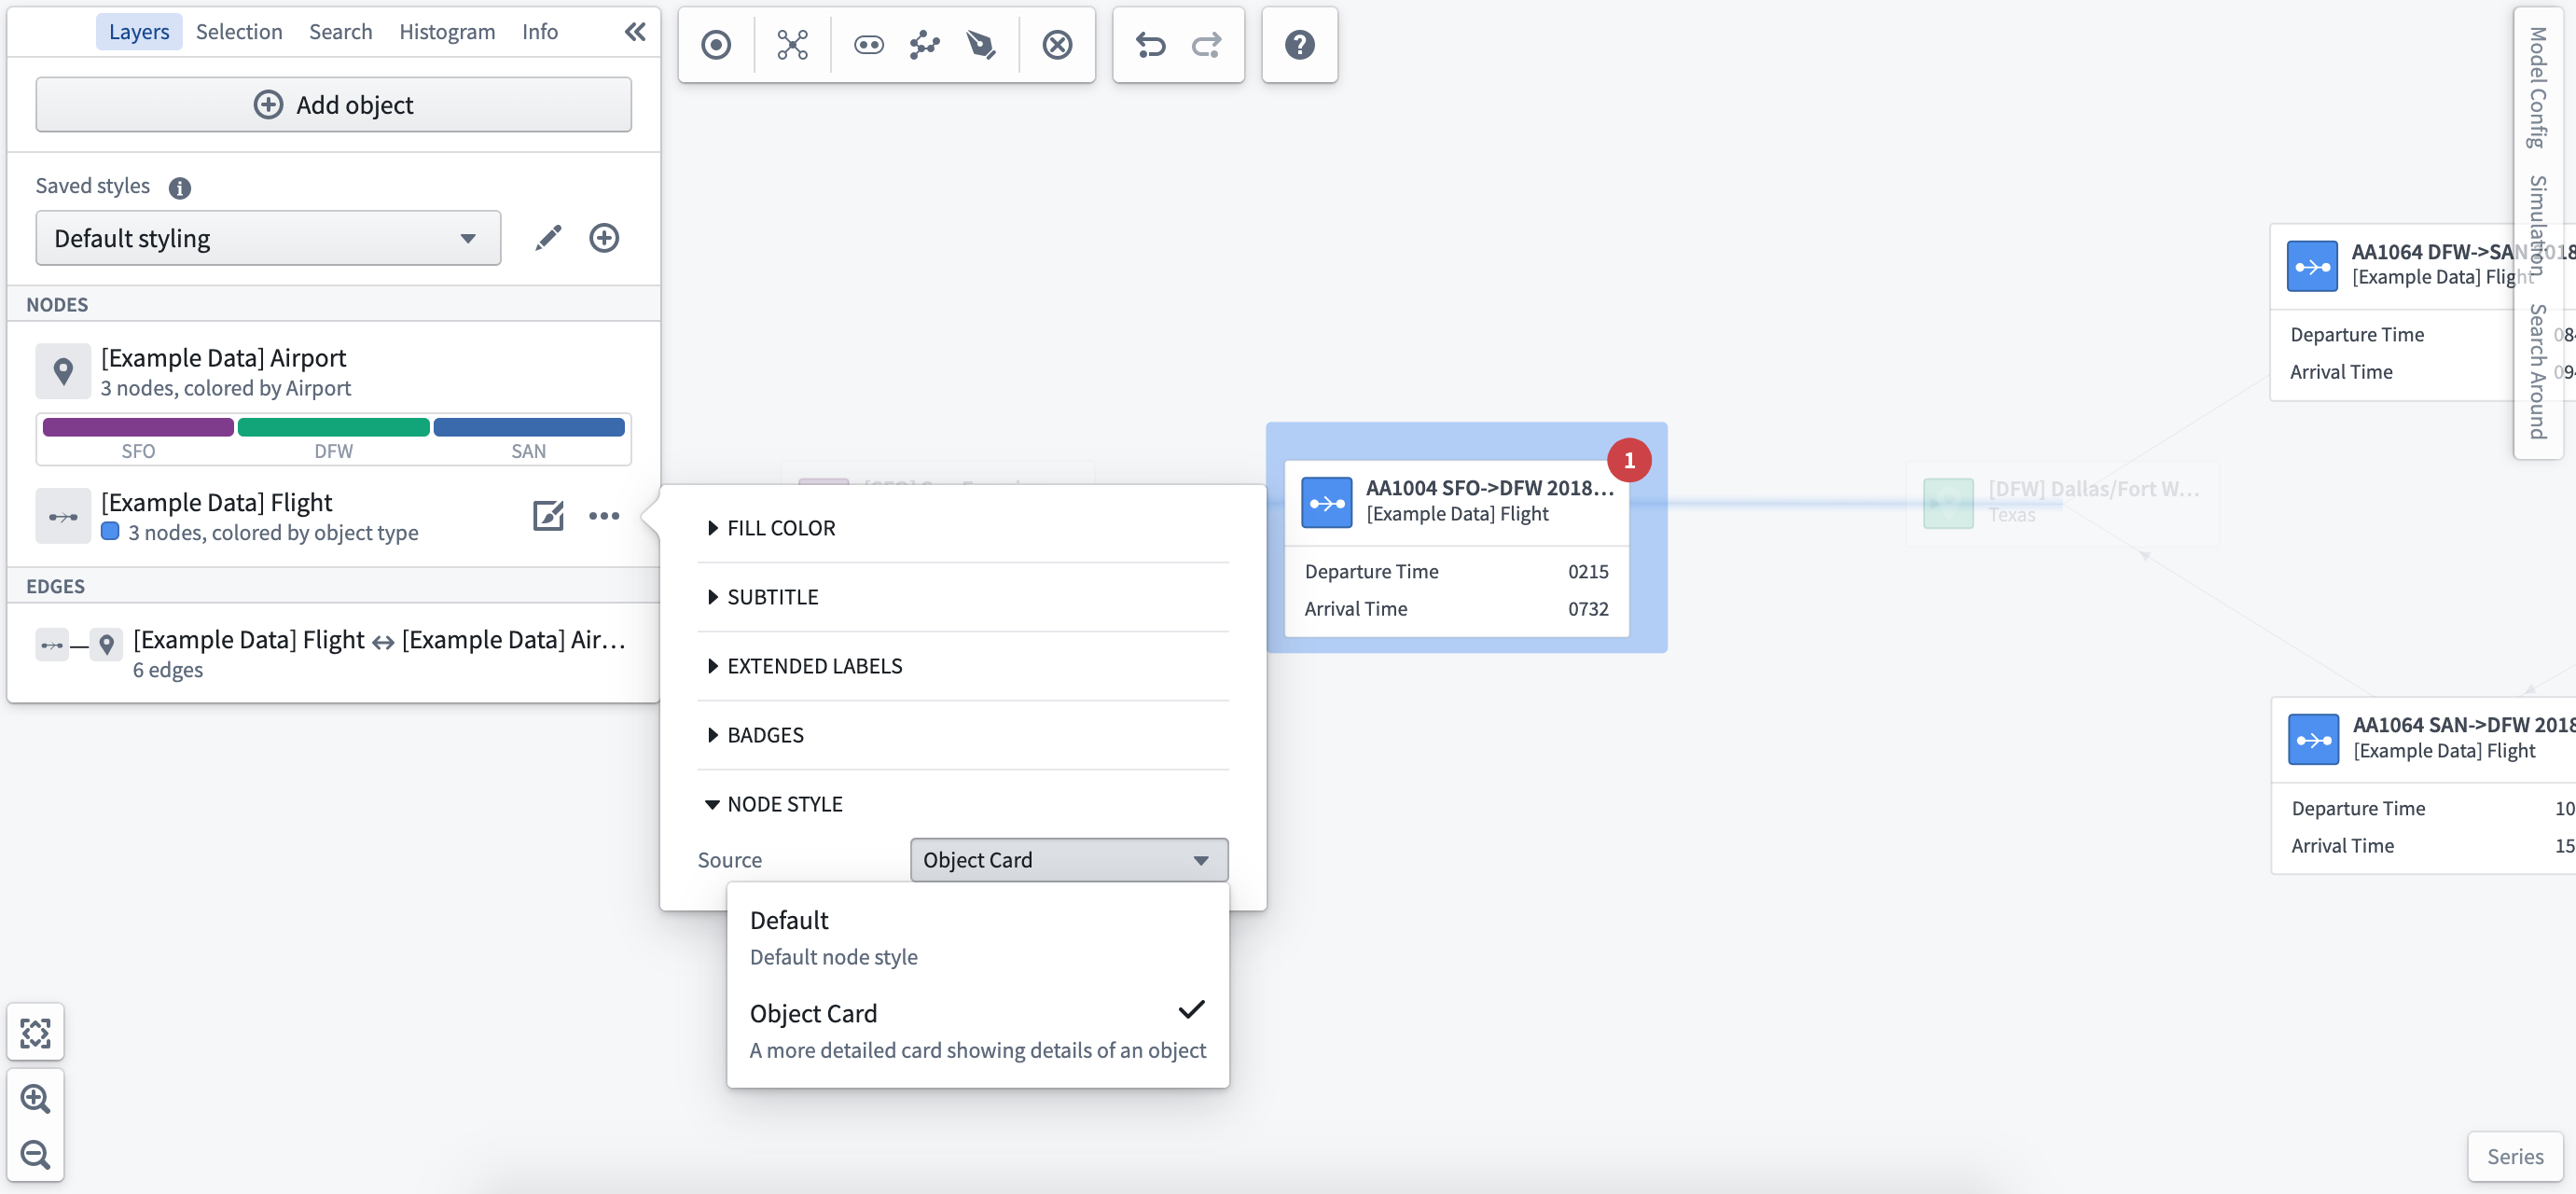
Node style
You can choose to display objects as the default node or as a full object card.
Edge styling
The edge represents the relationship between objects and can be styled to visualize the interactions between nodes in your system or process.
Select the Styling Options from the edge you would like to configure.
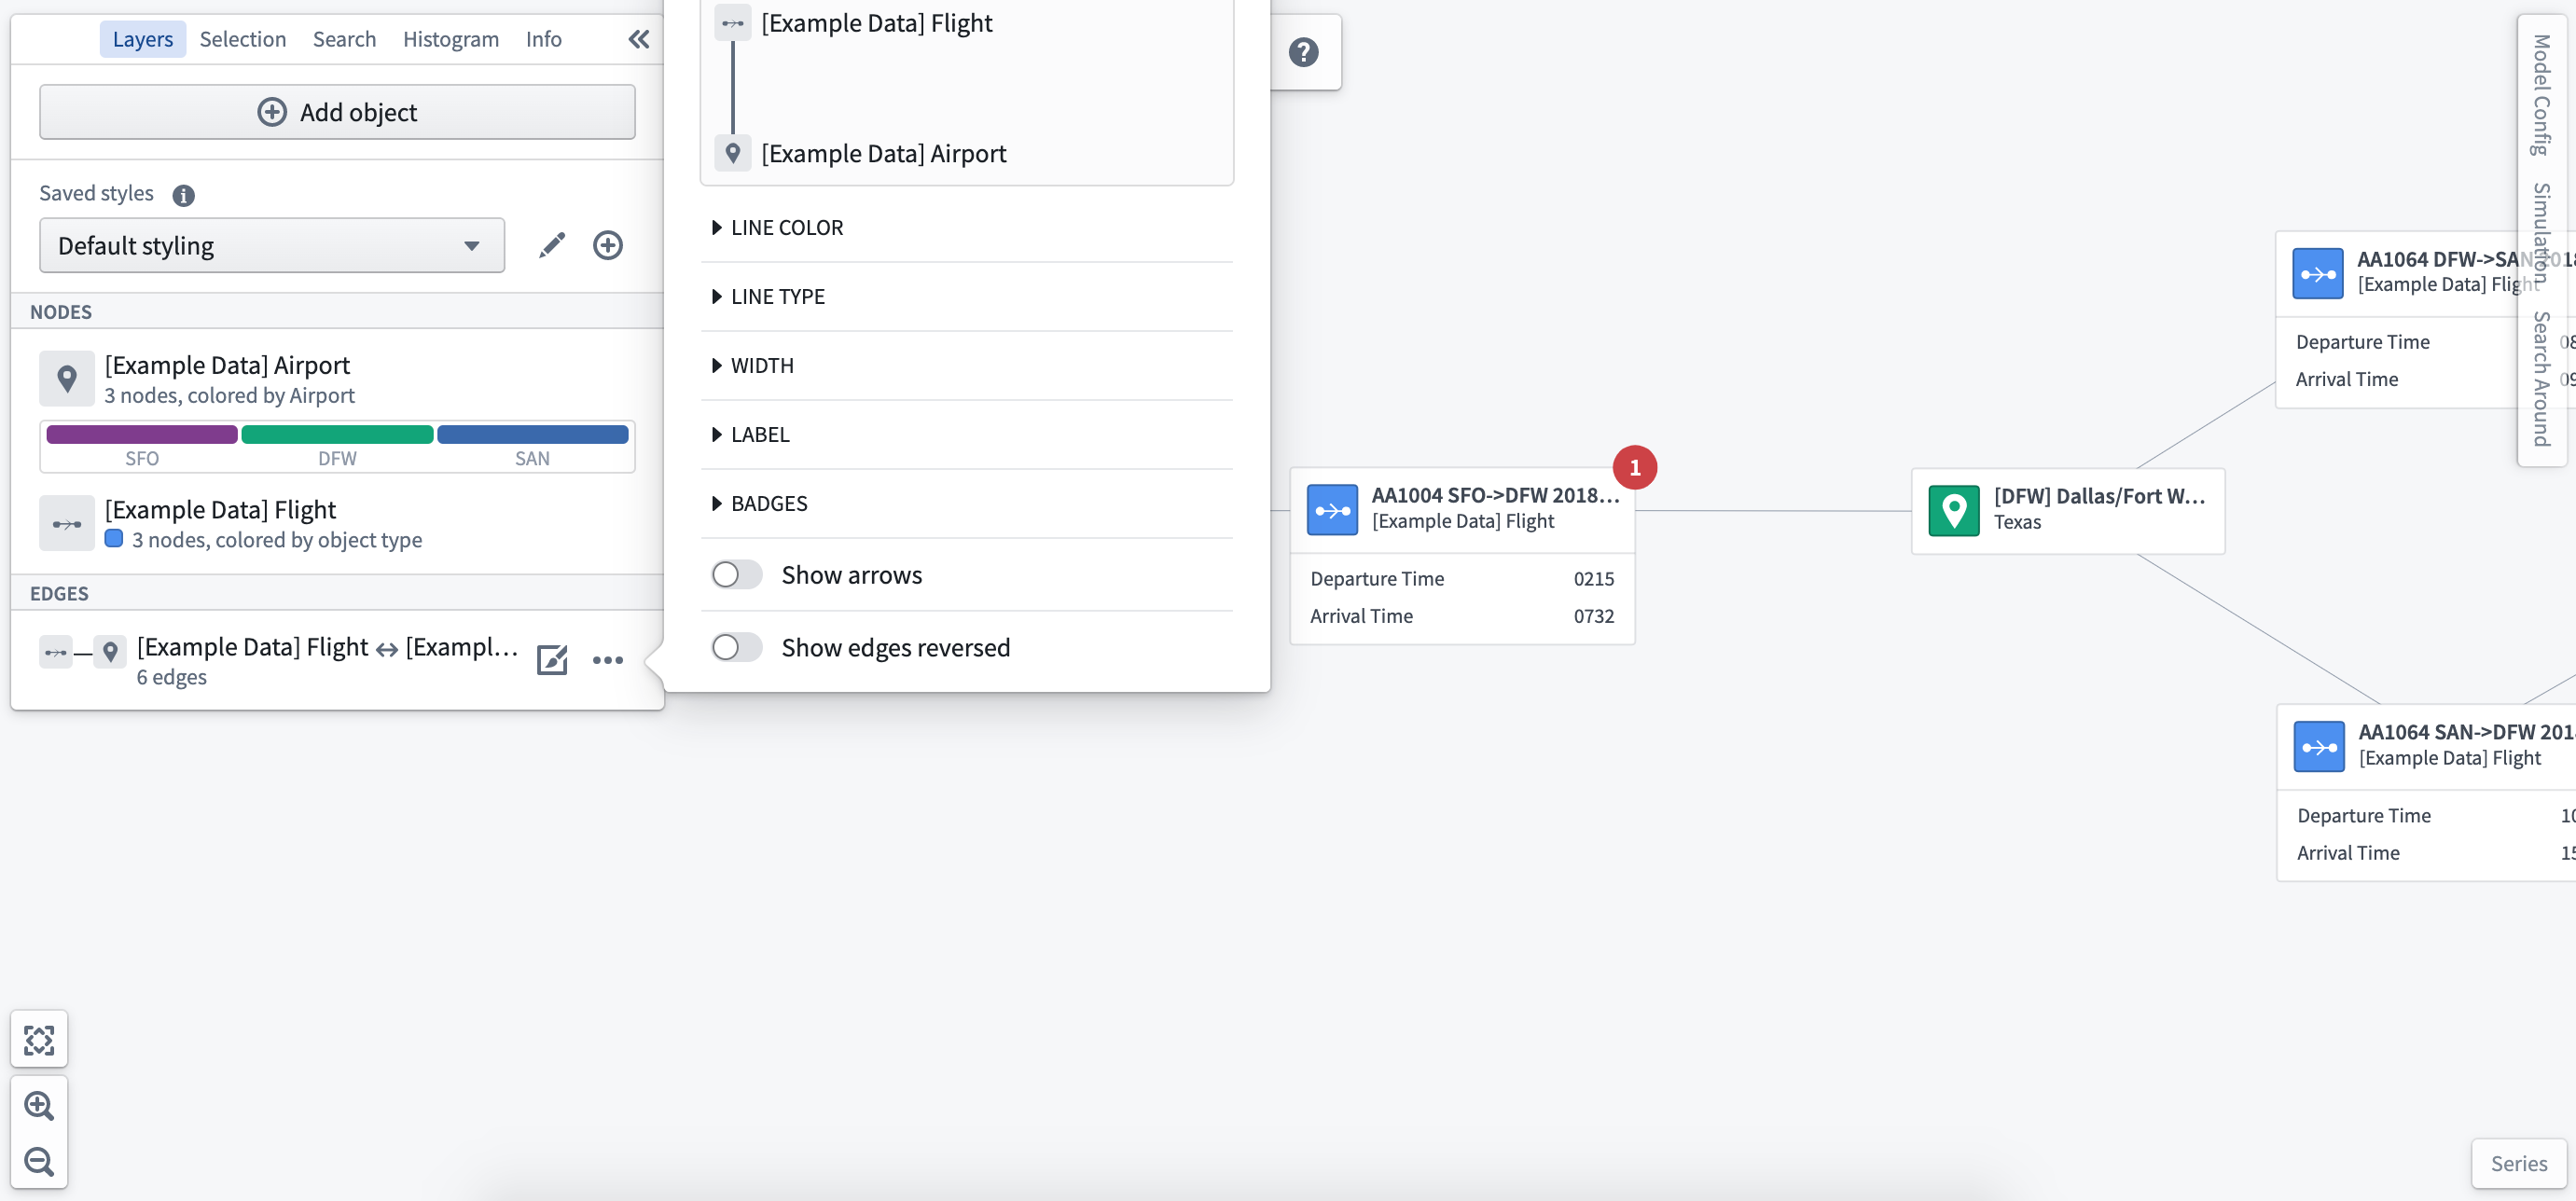
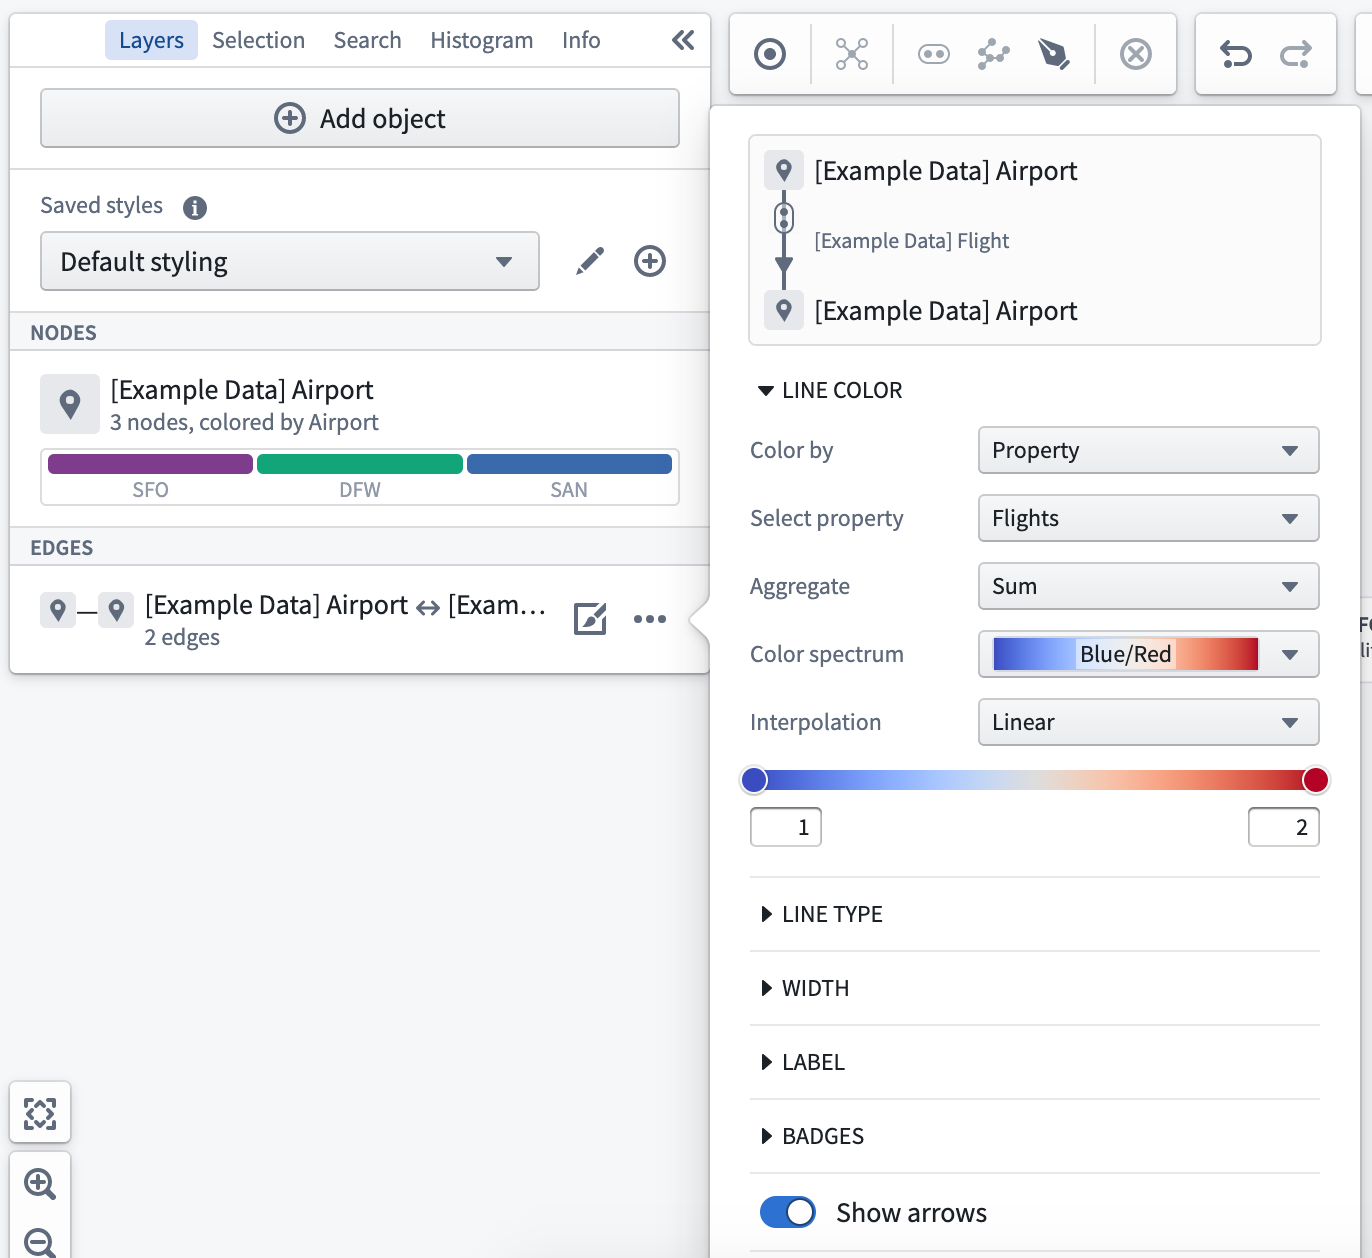
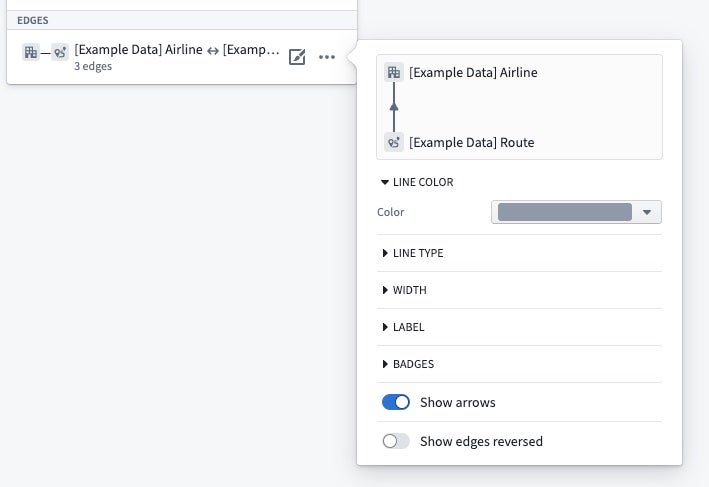
Line color
You can set the color of edges based on object types or a common property of related objects.
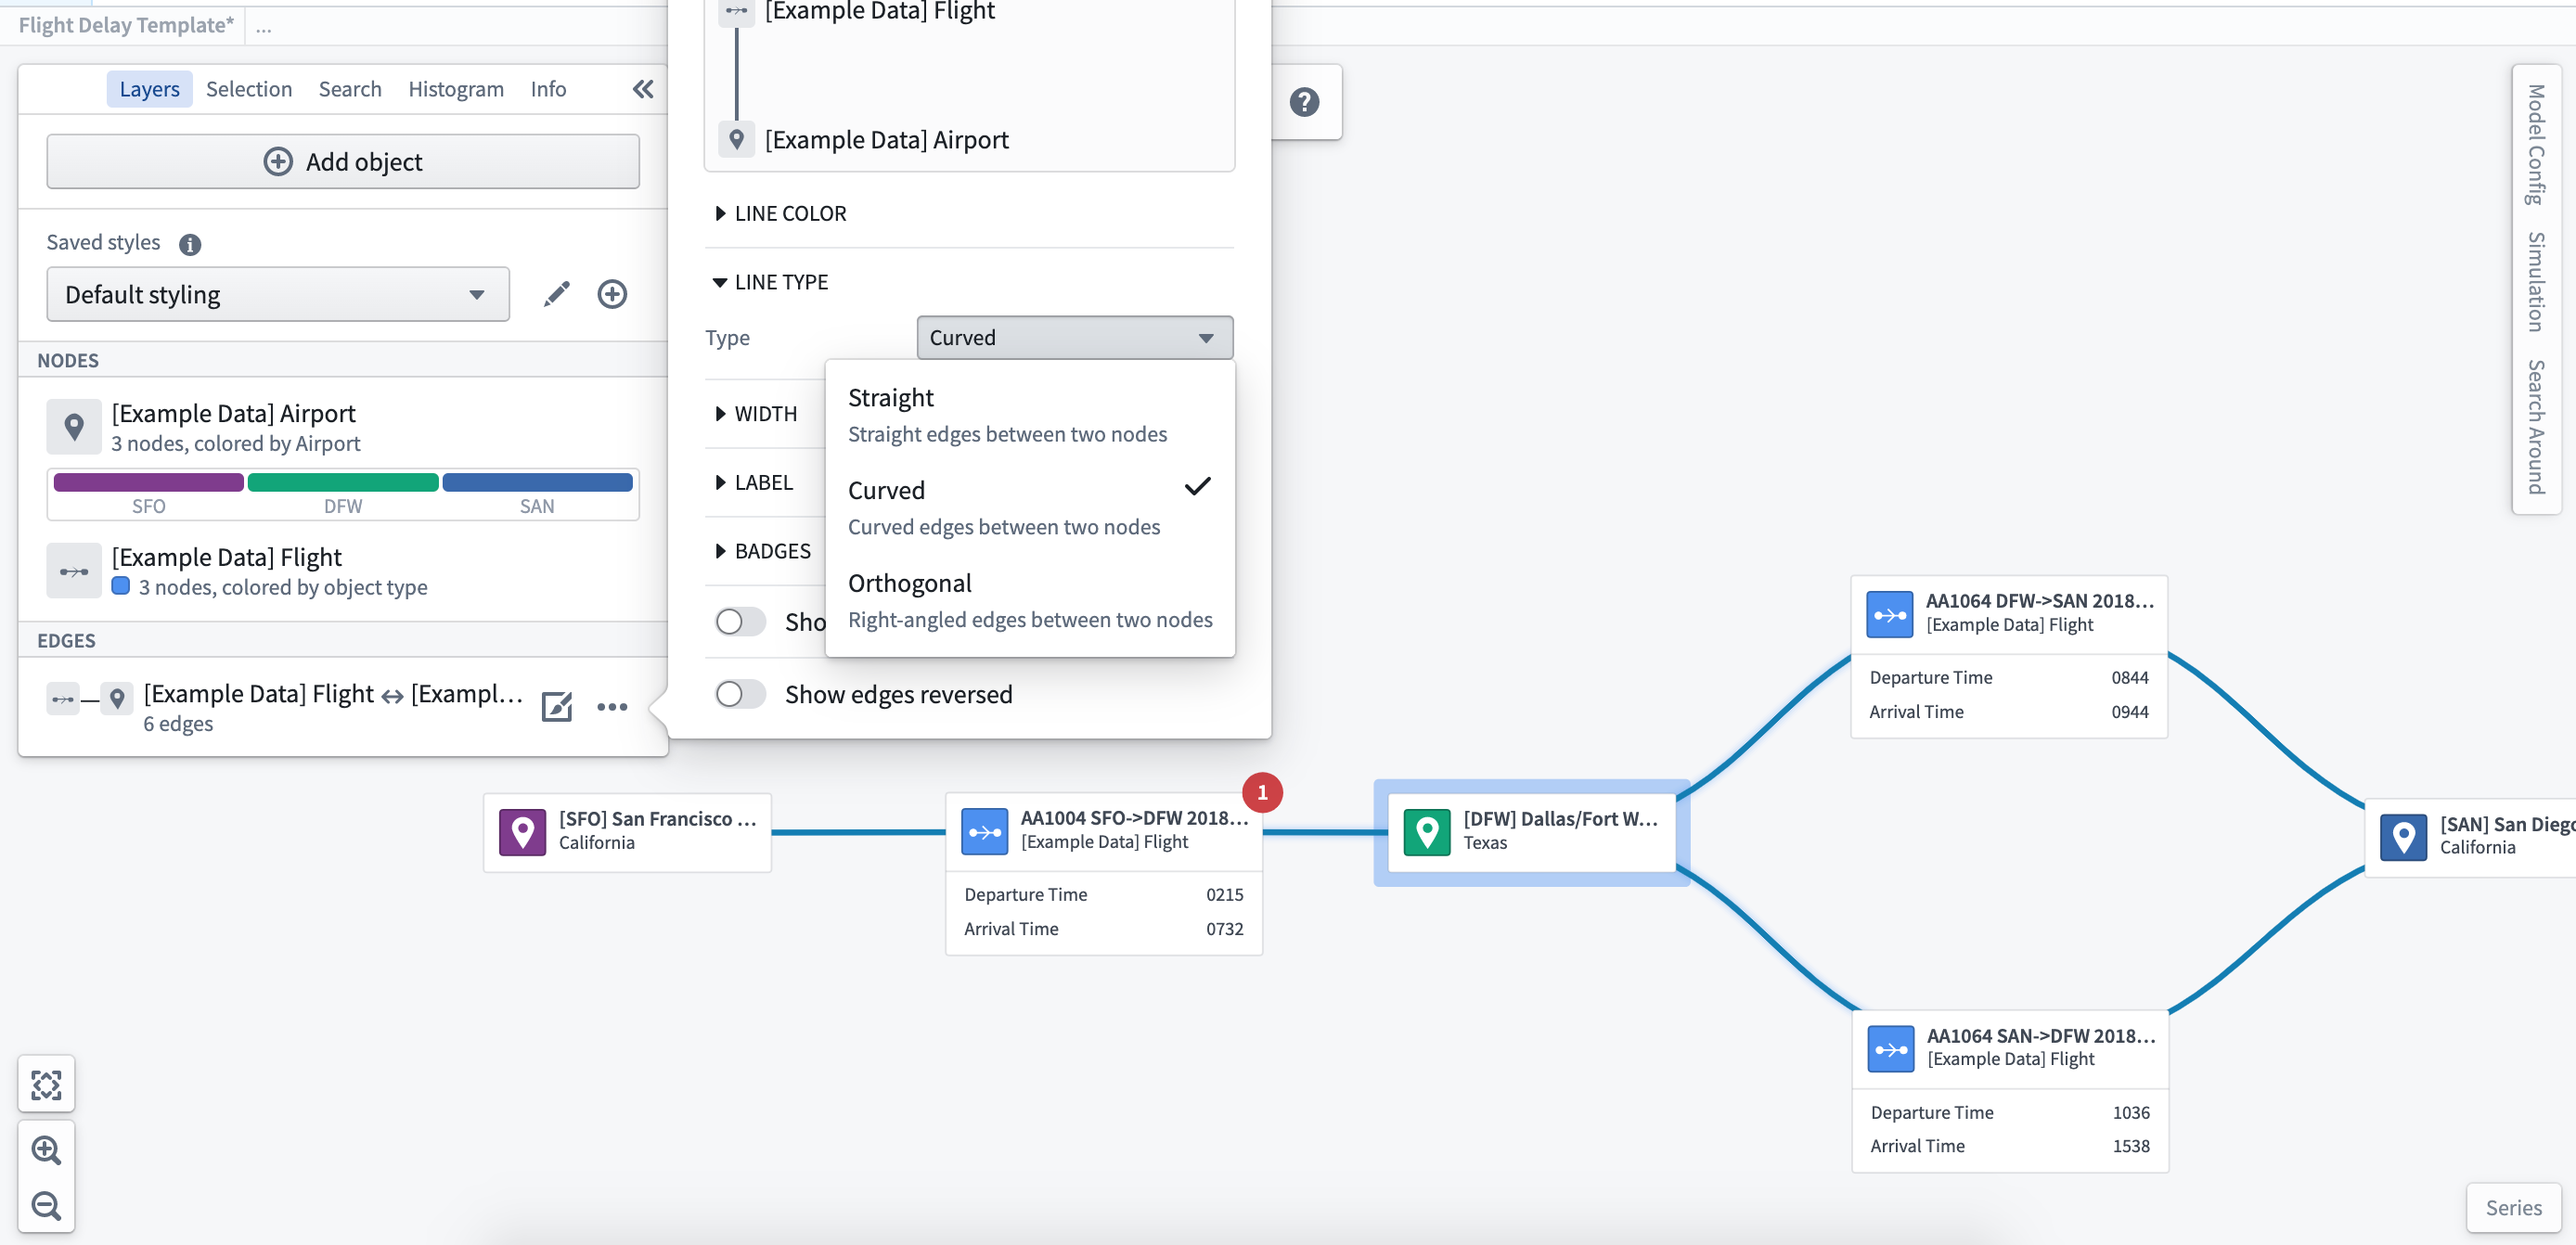
Line type
You can format the lines drawn to be straight, curved, or orthogonal.
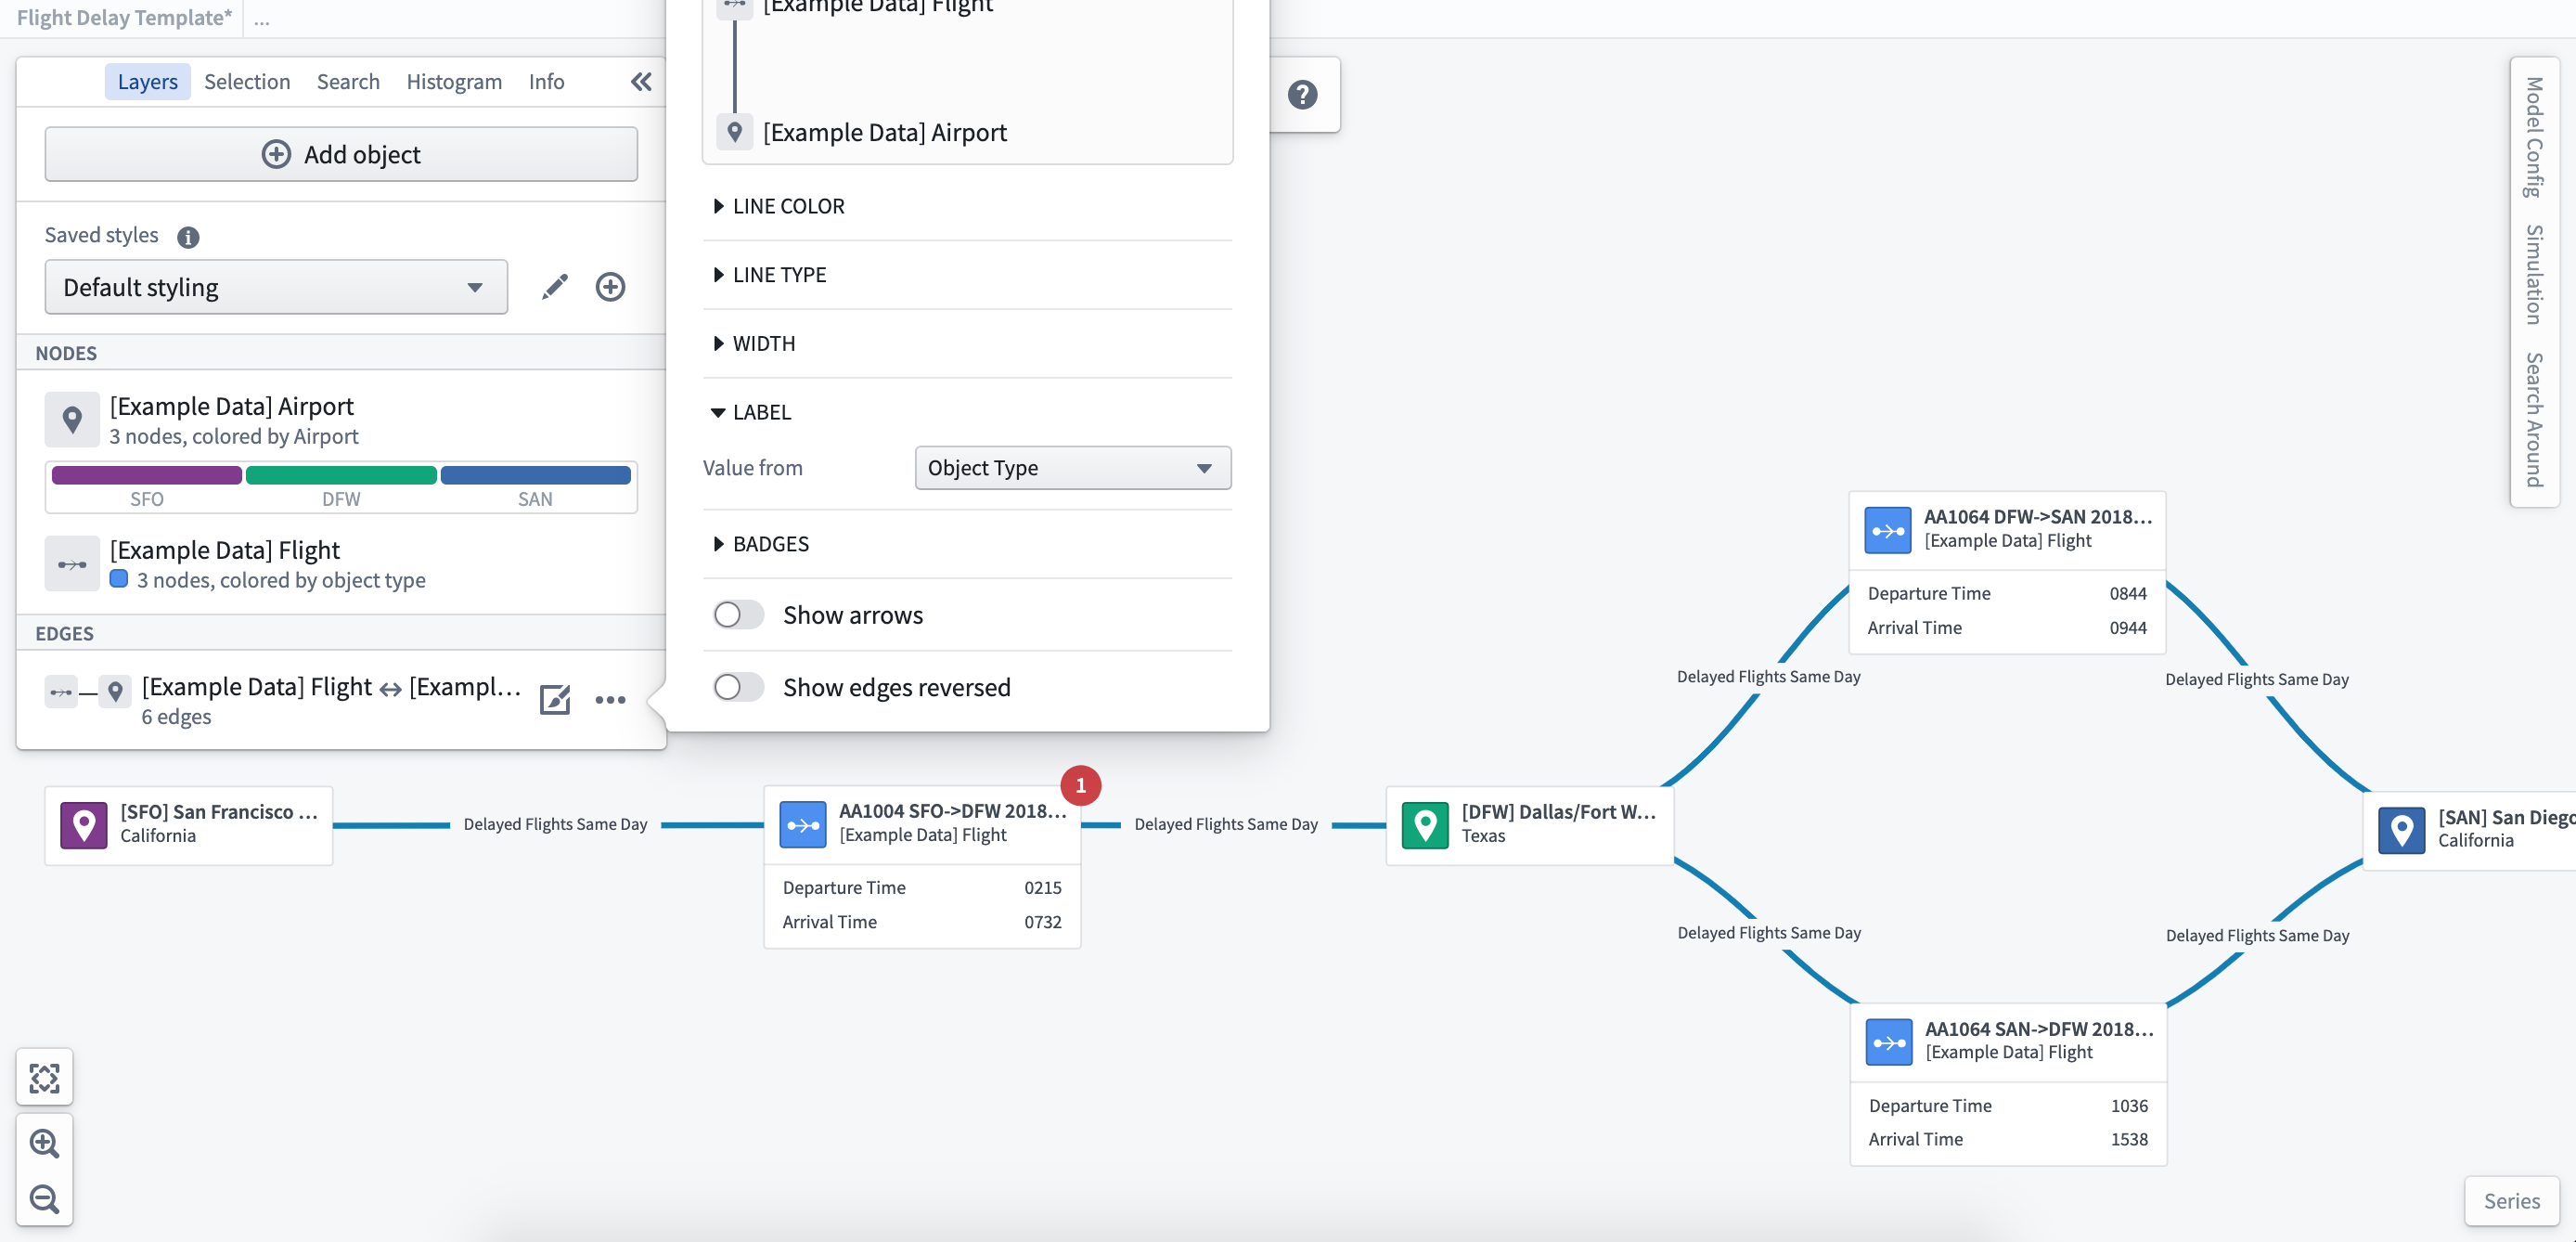
Labels
Where there are objects grouped in the edges, you can configure labels based on individual or aggregated properties of the object to show key metrics.
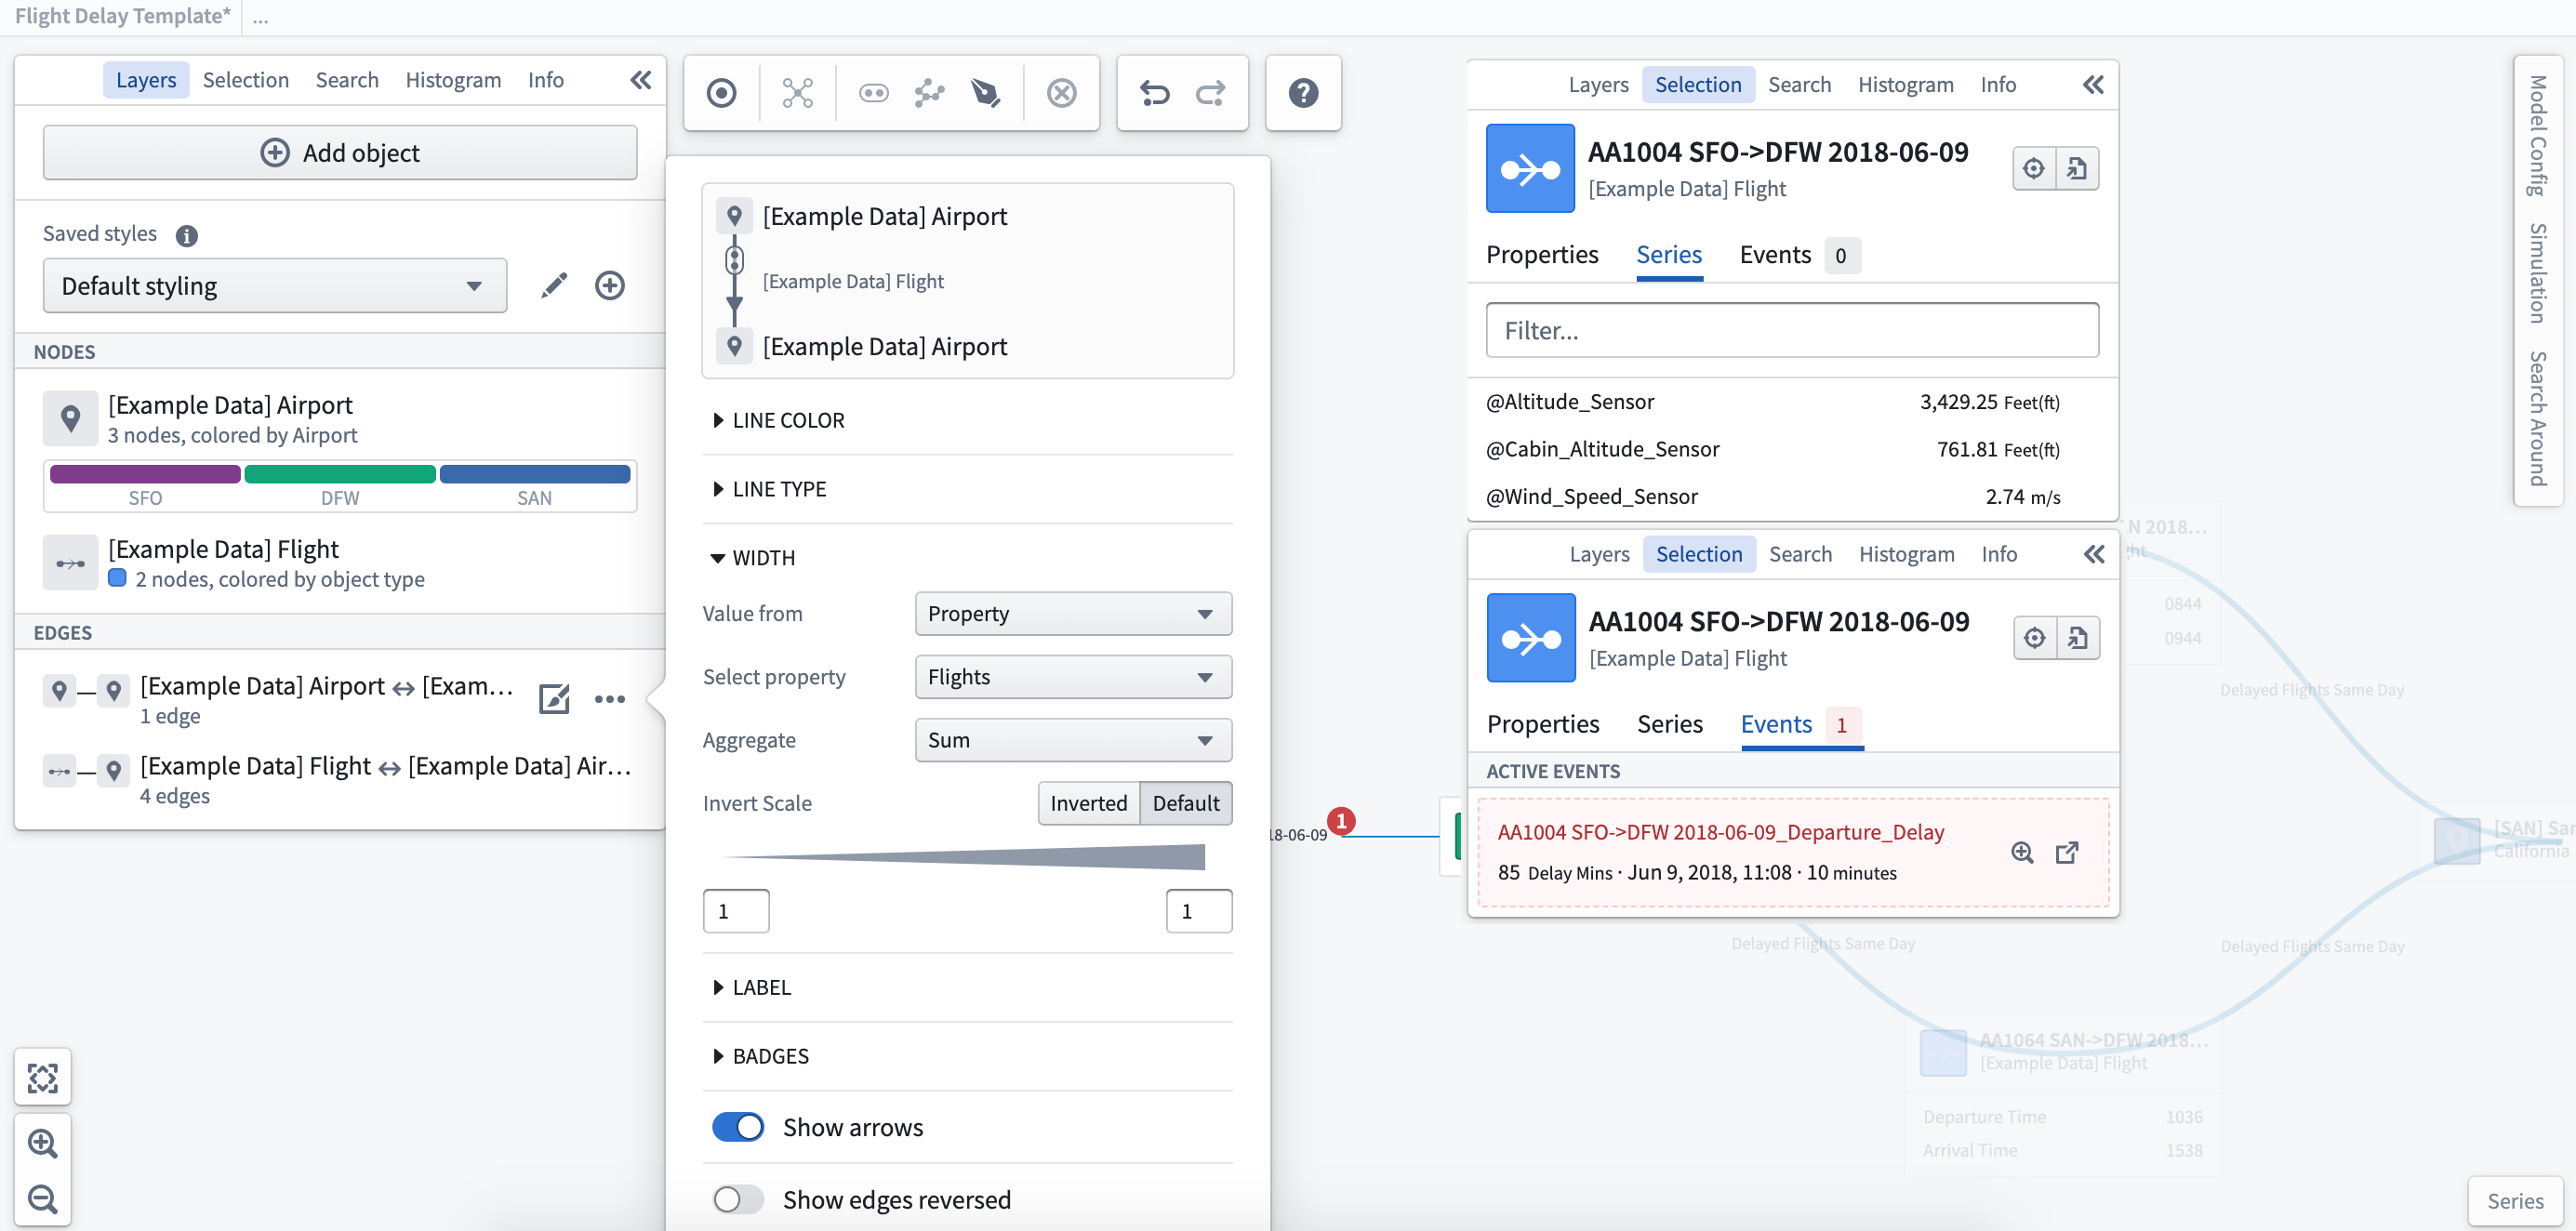
Line width
You can apply a different width to the edges based on properties of the objects. Applying different line widths allows you to indicate the movement and volume of transactions (such as flights) between objects (such as airports).
Badges
As with the object nodes, you can add badges to indicate the number of linked events to a specific edge relation. Here you can see there is one delayed flight event.
Ontology-level edge direction configuration
When adding links to the graph, by default the edge arrows are shown from the right side of the link pointing to the left. For example, for a link configured in the Ontology as a many-to-one link type, the arrows will point from the one side to the many side. This can be configured per link type using the following Ontology type classes:
- Primary Direction:
kind:vertex,name:link_primary_direction - When placed on one side of a link, indicates that the edge arrow should point towards the object on this side of the link.
- Undirectional:
kind:vertex,name:link_undirectional - When placed on either side of a link, indicates that no arrows should be shown on an edge.
- Bidirectional:
kind:vertex,name:link_bidirectional - When placed on either side of a link, indicates that arrows should be shown on both sides of an edge.
Edge arrows can also be hidden or reversed per-graph using the layer styling options.
Saved styles
Once configured, you can save different styling options for the same graph to provide different views of your system. For example, you could configure a view of flights between a set of airports to be styled by the key performance metrics of airline carriers. You can then use the same graph with different styling to show customer satisfaction over the same routes.
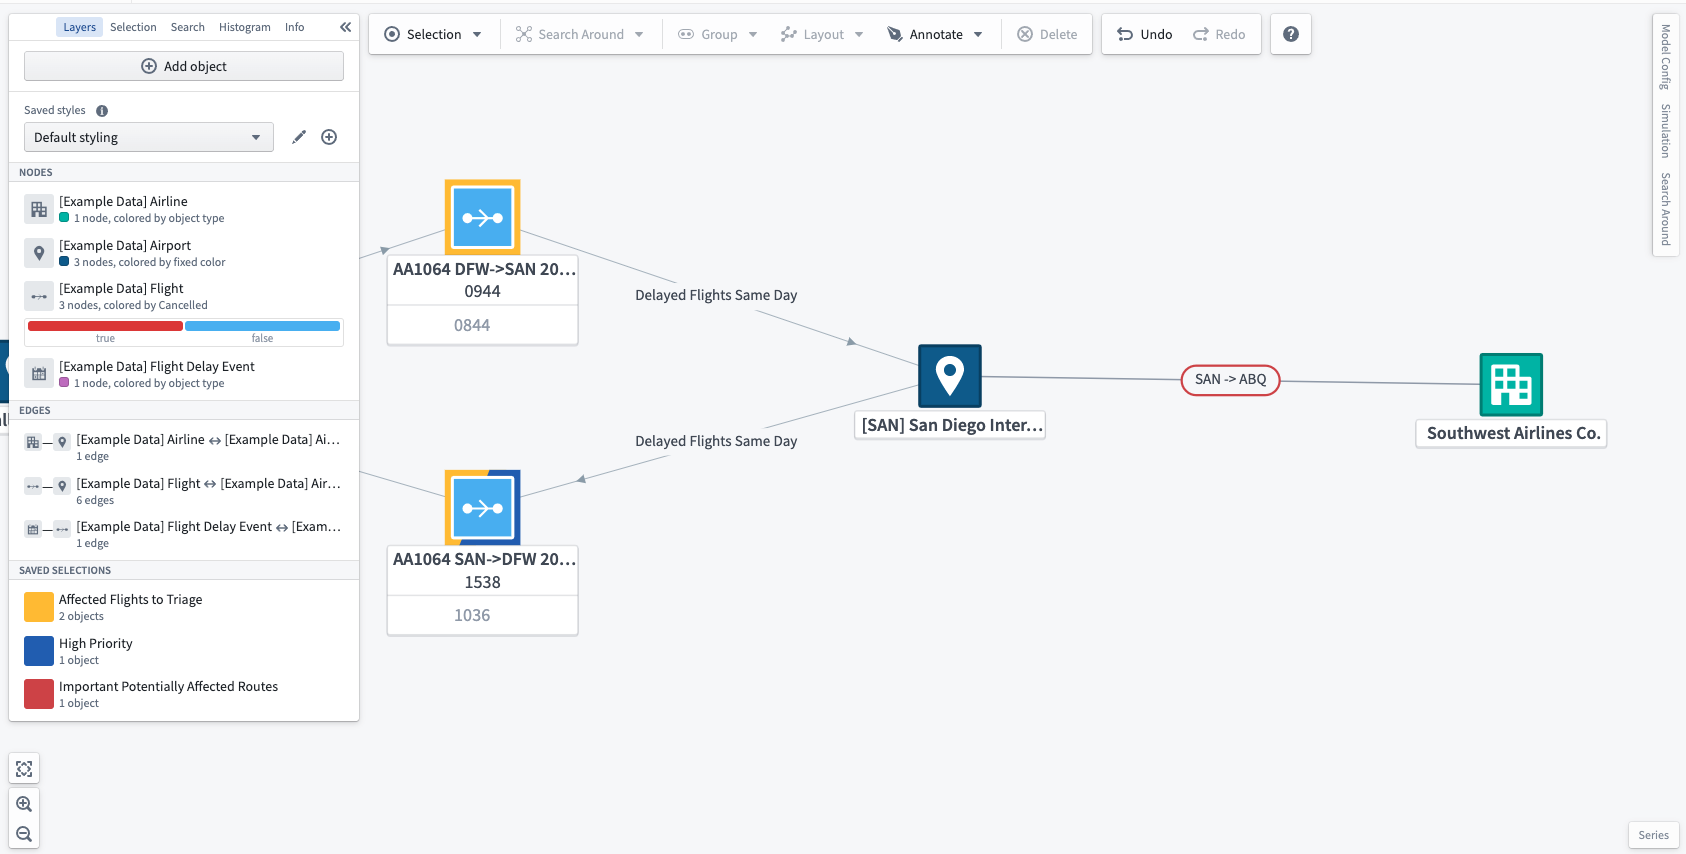
Saved selections
You can also save groups of objects that you have selected on the graph in a saved selection. To do this, select any number of nodes and edges that contain the desired objects and choose Save objects in current selection in the right-click menu or in the Selection menu in the toolbar.
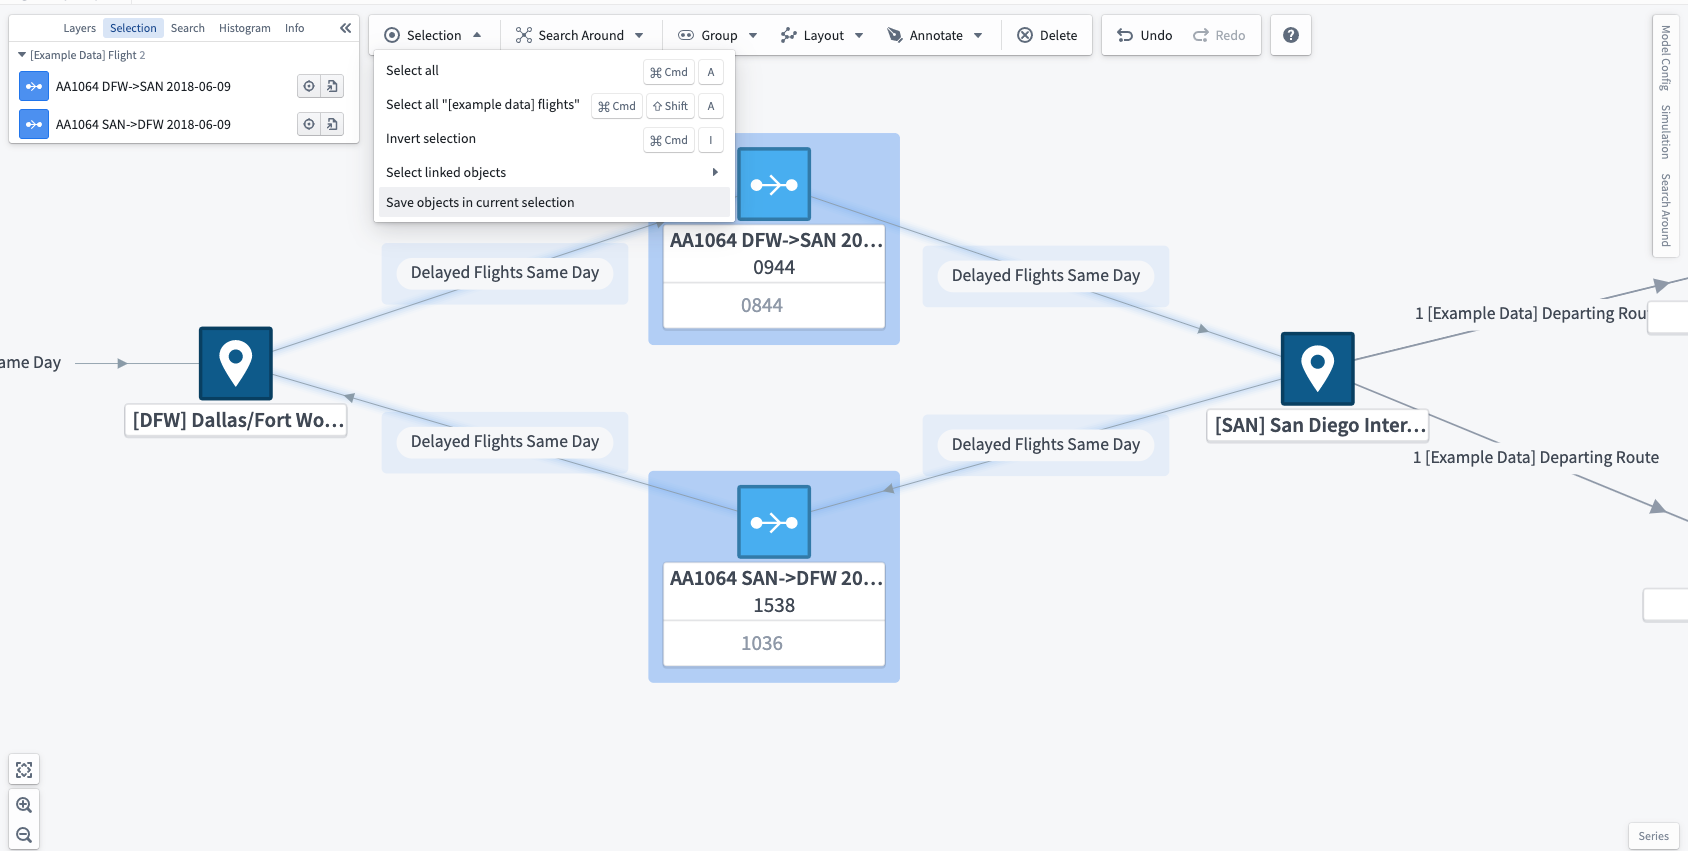
Each saved selection has an associated name and color which appears in the Saved selections section of the layers panel. Each object on the graph, represented as either an edge or a node, will have a split border around it in the colors of the saved selections to which the object belongs. Each object can be part of as many saved selections as needed, but the border will only show the color of the first three saved selections.
To quickly select all the objects stored in a saved selection, choose the quick select action when hovering over the saved selection.
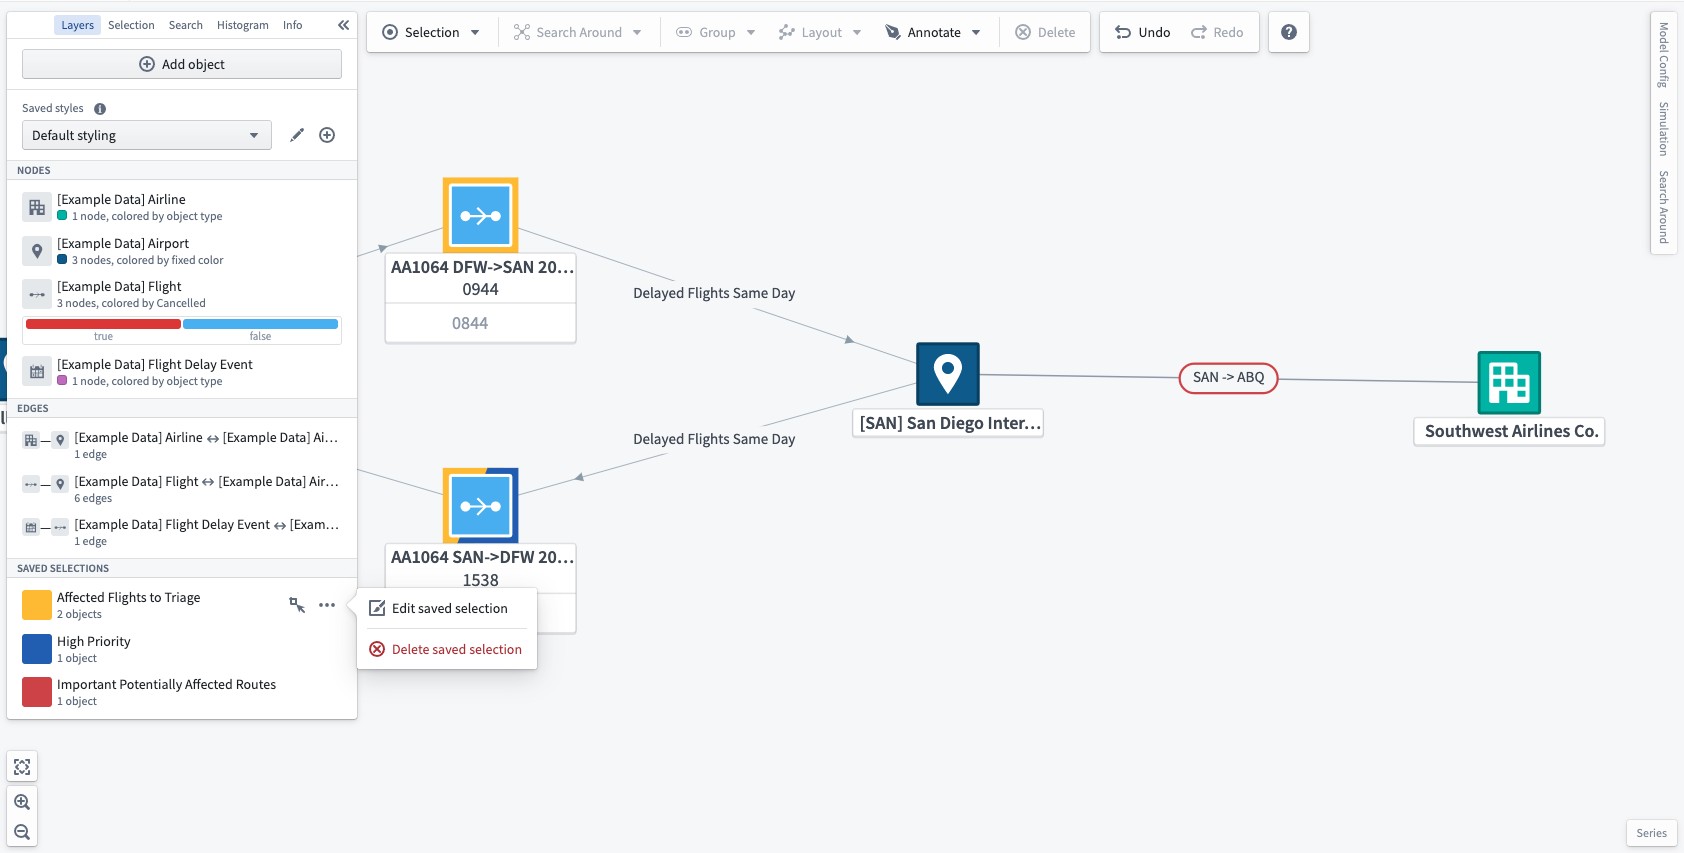
You can edit a saved selection in the layers panel. To edit the name of a saved selection, simply select the name, input a new name, and use the Enter key. To delete or edit the color of a saved selection, choose the ... icon ( ) when hovering over the saved selection. You can also toggle borders on and off for each saved selection with the eye icon (
 ).
).
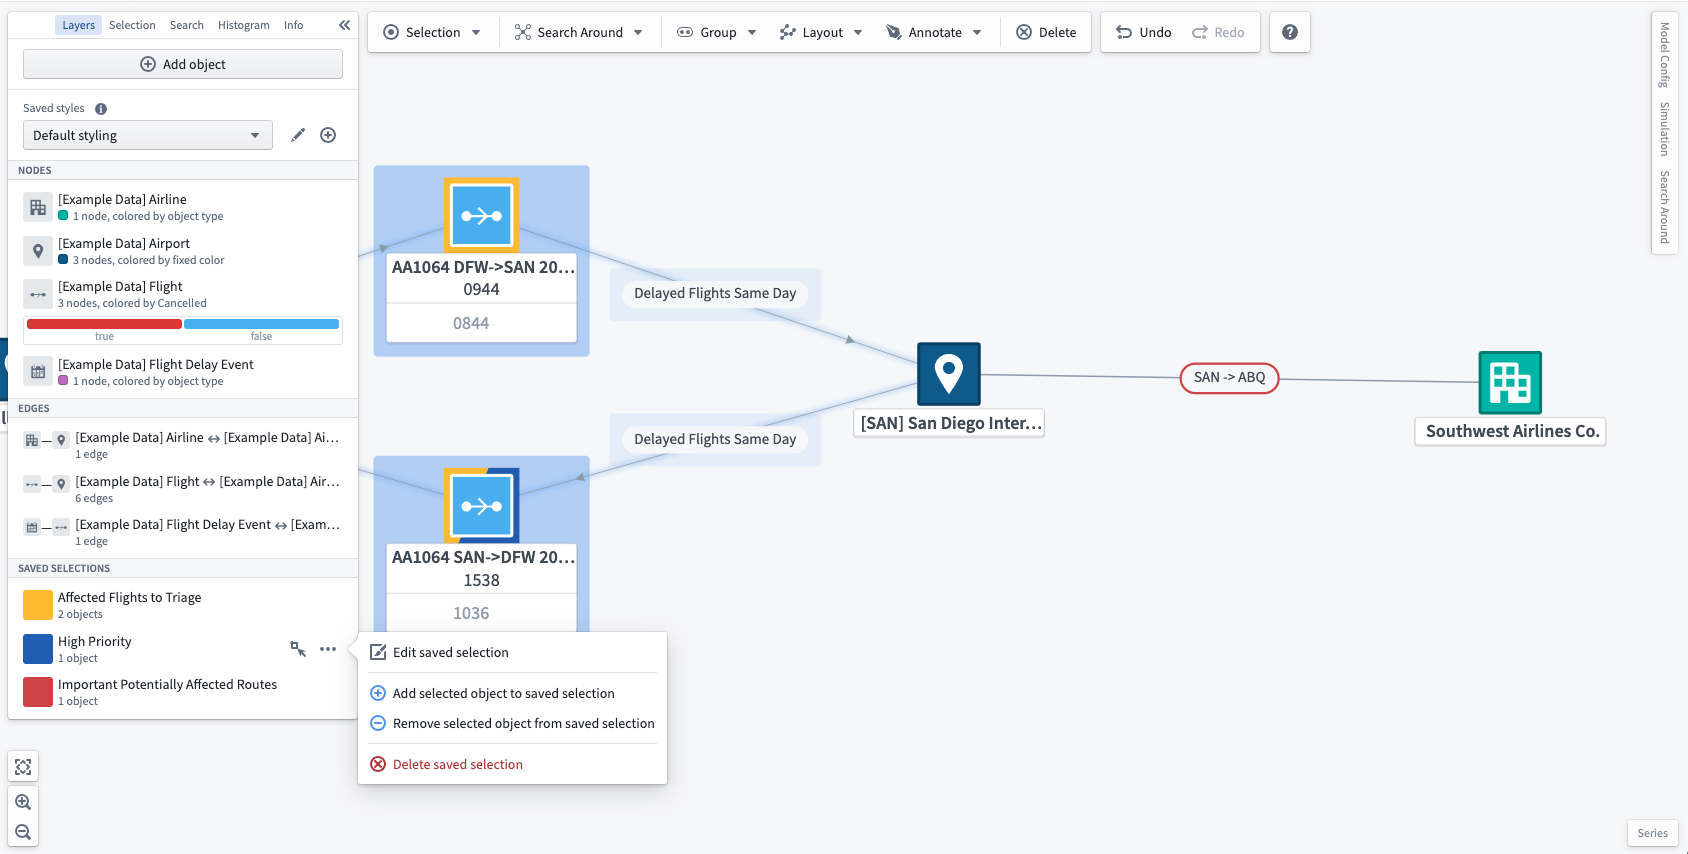
The objects in a saved selection can be edited by choosing objects on the graph, selecting the ... () button, then using the Add selected objects or Remove selected objects options.
中文翻译
对象与边显示选项
Vertex允许您为图表中的对象和边配置动态样式。设置样式并配置关键属性读数后,您可以通过时间选择窗口查看这些关键属性随时间的变化。
图表布局
自动布局选项
您可以在工作区顶部的工具栏中找到多个预定义的布局选项。选择后,对象和边将自动移动,使您能够在探索关系时对图表进行排序。许多布局包含用于修改其行为的高级参数。可以通过选择相应布局旁边的齿轮图标来访问这些参数。
以下是每种布局的高级参数。请注意,自动(Auto) 和 圆形(Circular) 布局没有高级参数。
层级结构(从左到右/从上到下)
- 反向(Reverse): 反转层级结构的顺序;从左到右变为从右到左,从上到下变为从下到上。
- 根节点(Root nodes): 选择一个节点作为层级结构的根节点。如果选择
自动(Automatic),系统将根据边的方向自动为您选择根节点。
网格(Grid)
- 交错(Staggered): 提供偏移奇数行元素的选项。
- 网格尺寸(Grid dimensions): 指定网格行数或列数的约束。
自动(Automatic)模式将尝试使用相等的行数和列数。
水平行/垂直列
- 排序依据(Order by): 用于对节点进行排序的对象属性。
- 默认使用升序。
- 如果未选择
排序依据(Order by)属性,布局将保持行中现有的水平节点顺序或列中现有的垂直节点顺序。 - 分组节点以及由不包含指定属性的对象支持的节点,在升序时将放置在开头,在降序时将放置在末尾。
- 只有数值属性会出现在此选择列表中。
- 不同对象上匹配的属性名称将一起排序。
- 反向(Reverse): 在升序和降序之间切换排序顺序。仅在选择
排序依据(Order by)属性时才会显示此选项。
径向(Radial)
- 中心节点(Central node): 指定应出现在布局中心的节点。
- 密度(Density): 介于1到5(含)之间的值,用于确定节点之间的间距。
聚类(Cluster)
- 聚类依据(Cluster by): 指定节点应据此进行聚类的属性。
- 如果未选择属性,此布局将按对象类型进行聚类。
- 分组节点以及由不具有所选属性的对象支持的节点将聚类在一起。
- 只有具有渲染提示(Render Hints)
可选择(Selectable)或低基数(Low Cardinality)的属性才会出现在此下拉菜单中。 - 不同对象的匹配属性名称将聚类在一起。
笛卡尔(Cartesian)
- X/Y属性(X/Y property): 用作布局中节点X和Y坐标的属性。
- 坐标将被归一化,以便在执行布局时节点适合视口。
- 除非选择了X属性、Y属性或两者,否则不会执行笛卡尔布局。
- 分组节点以及由不具有所选属性的对象支持的节点将保留在布局前的位置。
- 只有具有渲染提示(Render Hints)
可选择(Selectable)或低基数(Low Cardinality)的属性才会出现在此下拉菜单中。 - 不同对象上匹配的属性名称将一起排序。
- X/Y反向(X/Y reverse): 反转X和Y坐标。仅在选择属性后才会显示反向切换。
按对象类型分组节点
随着您添加更多相关对象,您可能希望开始将对象分组为图表上的单个节点。选择要分组的对象后,使用工作区顶部的布局工具栏对所选对象进行分组或取消分组。
将多个对象分组到单个节点后,您将在工作区左侧的选择面板中看到已分组的完整对象列表。如果您只想取消分组节点中的部分对象,请使用选择面板选择这些对象,然后选择如下所示的取消分组(Ungroup)。这也可以使用直方图中的筛选至(Filter to)功能完成。
按对象类型的属性分组
使用直方图,您可以探索所选对象的属性,也可以按显示的值对对象进行分组。这将更改图表上的对象布局以反映新的分组。
将节点分组到边中
某些对象是事务性的,并在系统中的其他节点/对象之间移动。例如,航班作为事务性对象在出发机场(Departure Airport)和目的地机场(Destination Airport)之间移动。在这种情况下,您可以将订单对象分组到边上,并能够根据关键属性/指标设置边的样式。
选择边,然后从右键菜单中选择取消分组(Ungroup),以显示之前分组在边中的所有对象。或者,您可以通过首先使用直方图或选择面板选择要取消分组的对象来取消分组子集。
:::callout 您可以在本体管理器(Ontology Manager) → 功能(Capabilities)选项卡中自动将事务性对象分组到相关边中。了解有关链接合并(Link Merging)的更多信息。 :::
图层样式选项
图层(Layers)指的是相同对象类型的对象节点或节点之间的边关系。这些可以单独配置多种布局选项,以实现灵活的视觉化并与系统的数字孪生进行直观交互。
使用左侧边栏中的图层样式面板,您可以单独设置节点和边的样式,或根据对象的属性以及相关时间序列/测量值设置样式。图层样式允许您可视化关键信息、计算指标,并根据参数化条件设置样式,以显示当前或模拟的系统状态。
对象样式
选择要配置的对象类型旁边的样式选项(Styling Options)以打开样式菜单。
颜色依据(Color by)
选择填充颜色(Fill Color)下拉菜单以选择样式参数以及此图层中所有对象的颜色选择。您可以选择时间序列度量作为颜色依据(Color by)参数,这将根据所选时间窗口动态更新样式。您还可以使用派生属性函数(Derived Property Functions)为节点着色。
副标题(Subtitle)
您可以为对象类型或对象的选定属性上的每个对象添加副标题。副标题将显示在图表上所有相同类型的对象上。
扩展标签(Extended Labels)
选择扩展标签(Extended Labels)允许您向选定的对象节点添加特定的读数。您可以从真实世界的时间序列读数或模拟值中进行选择,以便在单个视图中比较当前和建模的条件。
设置扩展标签样式后,您可以从工作区左侧的对象选择面板中选择要显示的属性或时间序列。
徽章(Badges)
添加徽章以指示链接到特定对象类型的事件数量。在下面的屏幕截图中,您可以看到有一个延误航班事件。
节点样式(Node style)
您可以选择将对象显示为默认节点或完整对象卡片。
边样式
边表示对象之间的关系,可以设置样式以可视化系统或流程中节点之间的交互。
选择要配置的边的样式选项(Styling Options)。
线条颜色(Line color)
您可以根据对象类型或相关对象的公共属性设置边的颜色。
线条类型(Line type)
您可以将绘制的线条格式化为直线、曲线或正交线。
标签(Labels)
当边中有对象分组时,您可以根据对象的单个或聚合属性配置标签以显示关键指标。
线条宽度(Line width)
您可以根据对象的属性为边应用不同的宽度。应用不同的线条宽度允许您指示对象(如机场)之间事务(如航班)的移动和数量。
徽章(Badges)
与对象节点一样,您可以添加徽章以指示链接到特定边关系的事件数量。在这里您可以看到有一个延误航班事件。
本体级别边方向配置
将链接添加到图表时,默认情况下边箭头从链接的右侧指向左侧。例如,对于在本体(Ontology)中配置为多对一链接类型的链接,箭头将从一侧指向多侧。可以使用以下本体类型类(Type Classes)为每个链接类型配置此设置:
- 主方向(Primary Direction):
kind:vertex,name:link_primary_direction - 放置在链接的一侧时,表示边箭头应指向此侧的对象。
- 无方向(Undirectional):
kind:vertex,name:link_undirectional - 放置在链接的任一侧时,表示边上不应显示箭头。
- 双向(Bidirectional):
kind:vertex,name:link_bidirectional - 放置在链接的任一侧时,表示边的两侧都应显示箭头。
也可以使用图层样式选项在每个图表中隐藏或反转边箭头。
已保存样式(Saved styles)
配置完成后,您可以为同一图表保存不同的样式选项,以提供系统的不同视图。例如,您可以配置一组机场之间的航班视图,按航空公司的关键性能指标设置样式。然后,您可以使用同一图表但采用不同的样式来显示相同航线上的客户满意度。
已保存选择(Saved selections)
您还可以将图表上选择的对象组保存在已保存选择中。为此,请选择任意数量的包含所需对象的节点和边,然后在右键菜单或工具栏的选择(Selection)菜单中选择保存当前选择中的对象(Save objects in current selection)。
每个已保存选择都有一个关联的名称和颜色,显示在图层面板的已保存选择(Saved selections)部分中。图表上的每个对象(表示为边或节点)周围将有一个分割边框,其颜色为对象所属的已保存选择的颜色。每个对象可以根据需要属于任意数量的已保存选择,但边框仅显示前三个已保存选择的颜色。
要快速选择已保存选择中存储的所有对象,请在悬停在已保存选择上时选择快速选择操作。
您可以在图层面板中编辑已保存选择。要编辑已保存选择的名称,只需选择名称,输入新名称,然后使用Enter键。要删除或编辑已保存选择的颜色,请在悬停在已保存选择上时选择...图标()。您还可以使用眼睛图标()为每个已保存选择切换边框的显示和隐藏。
可以通过在图表上选择对象,选择... ()按钮,然后使用添加所选对象(Add selected objects)或移除所选对象(Remove selected objects)选项来编辑已保存选择中的对象。