View and filter events on a timeline(在时间轴上查看和筛选事件)
The timeline can be used to inspect the time properties of objects and filter to specific events in a given time range.
View time events
The Timeline button in the lower-left of the interface can be used to show or hide the timeline.
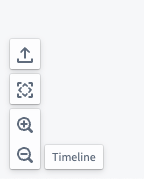
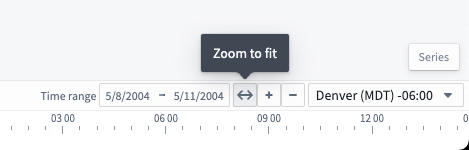
If nothing is visible on the timeline, the Zoom to fit button can be helpful to show time events on the graph in the timeline's Time range.
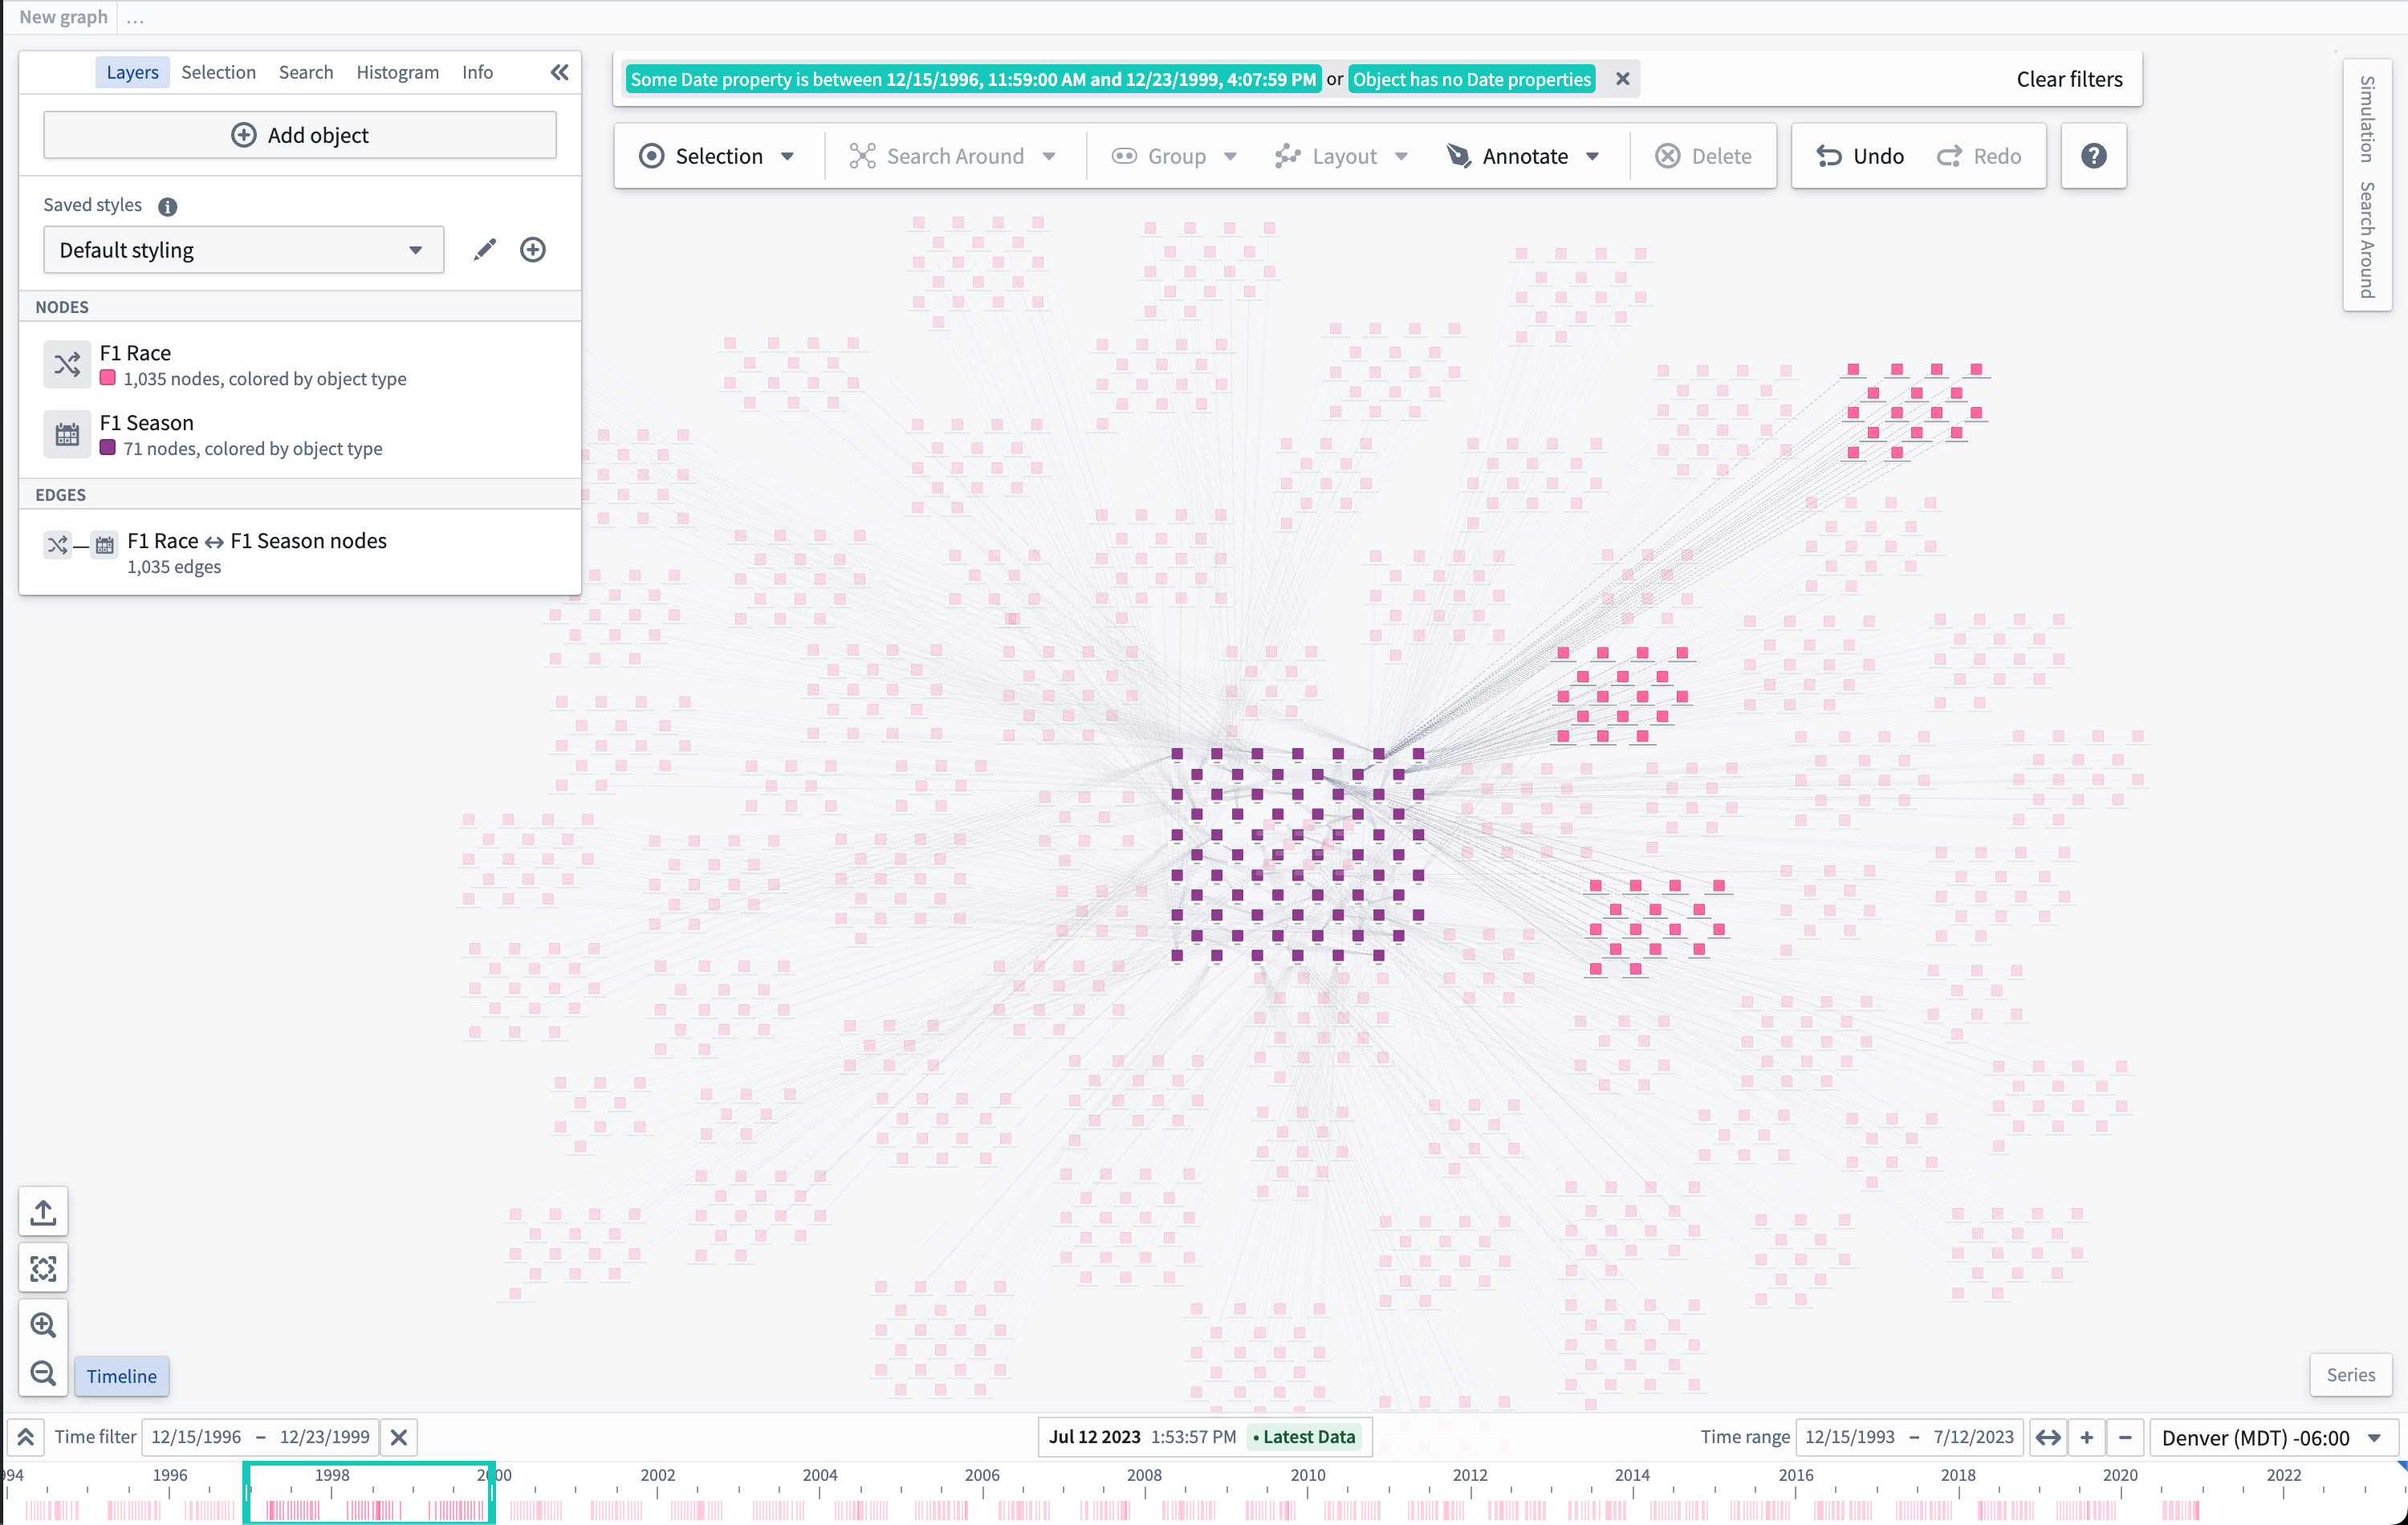
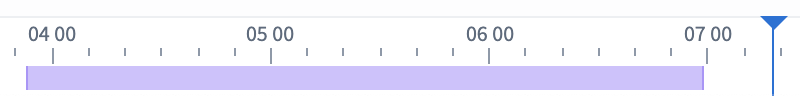
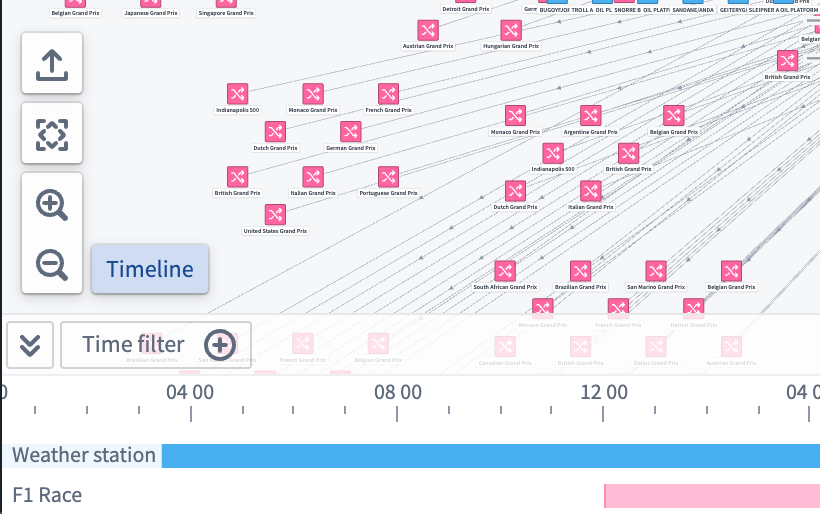
When visible, the timeline will show lines for an object's time properties and bars for time ranges in an object's properties.
Filter time events
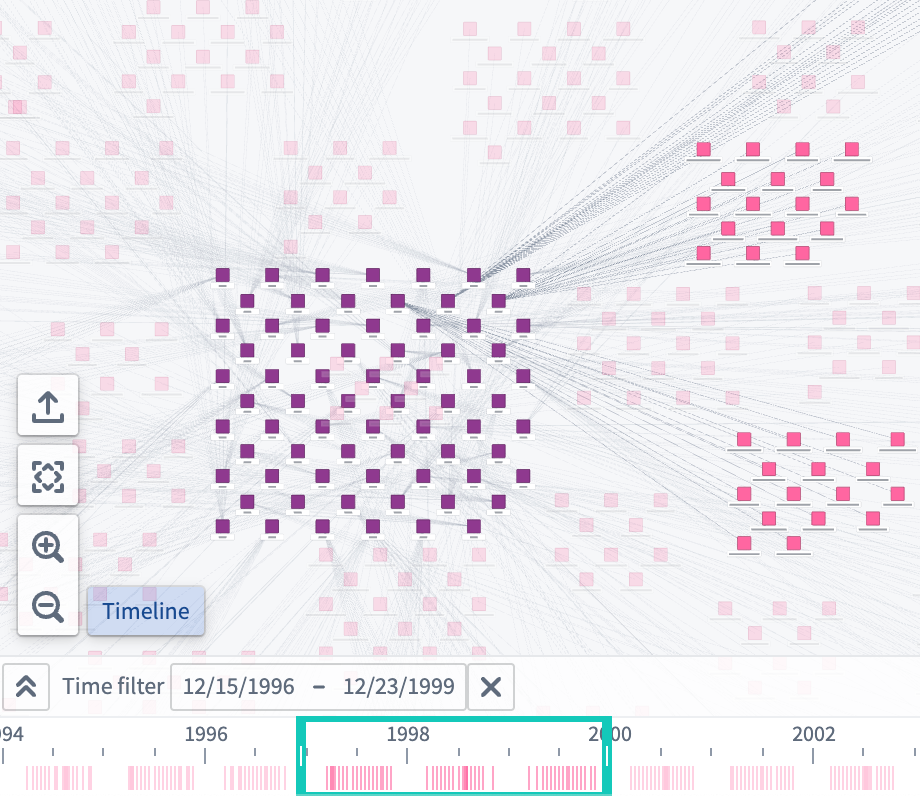
Events can be filtered on the graph by either holding Shift and left-click dragging on the timeline to create a time filter window, or by using the Time filter button in the control bar of the timeline.
The Time filter is also available on the top of the application. Nodes on the graph that match the filter are fully opaque, while nodes that do not match the time filter are faded out.
Change cursor position
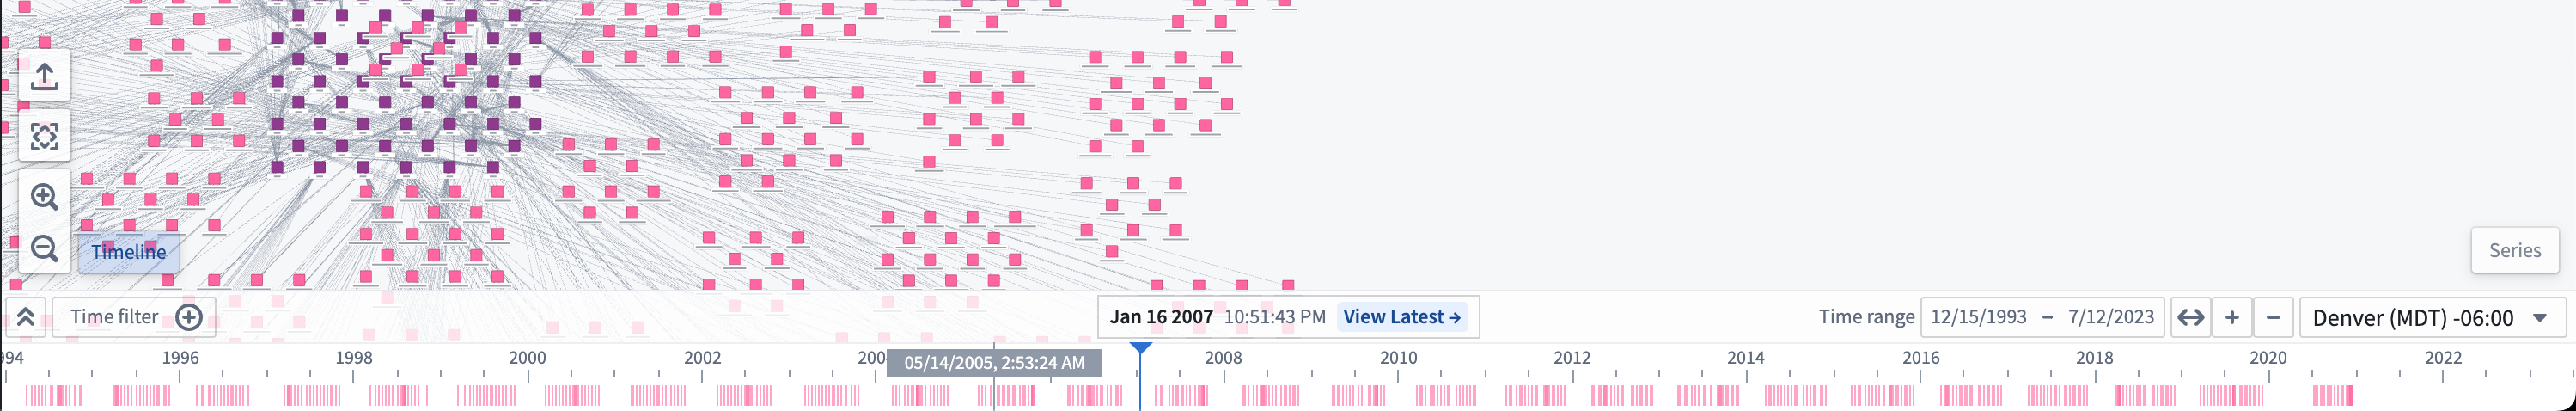
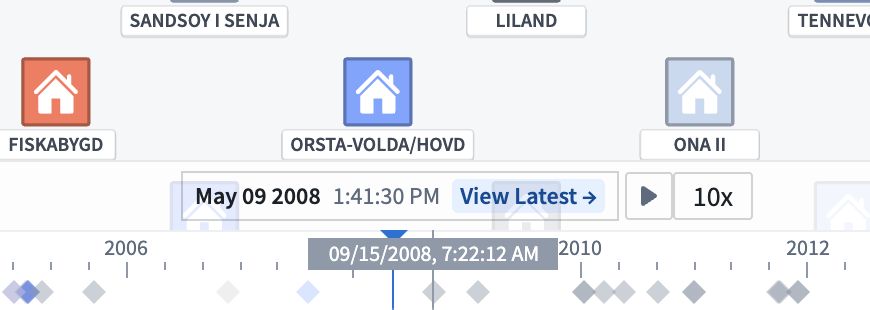
The cursor position on the timeline can be changed by double-left-clicking on the timeline, dragging the cursor to a new position, or by using the input in the middle of the control bar.
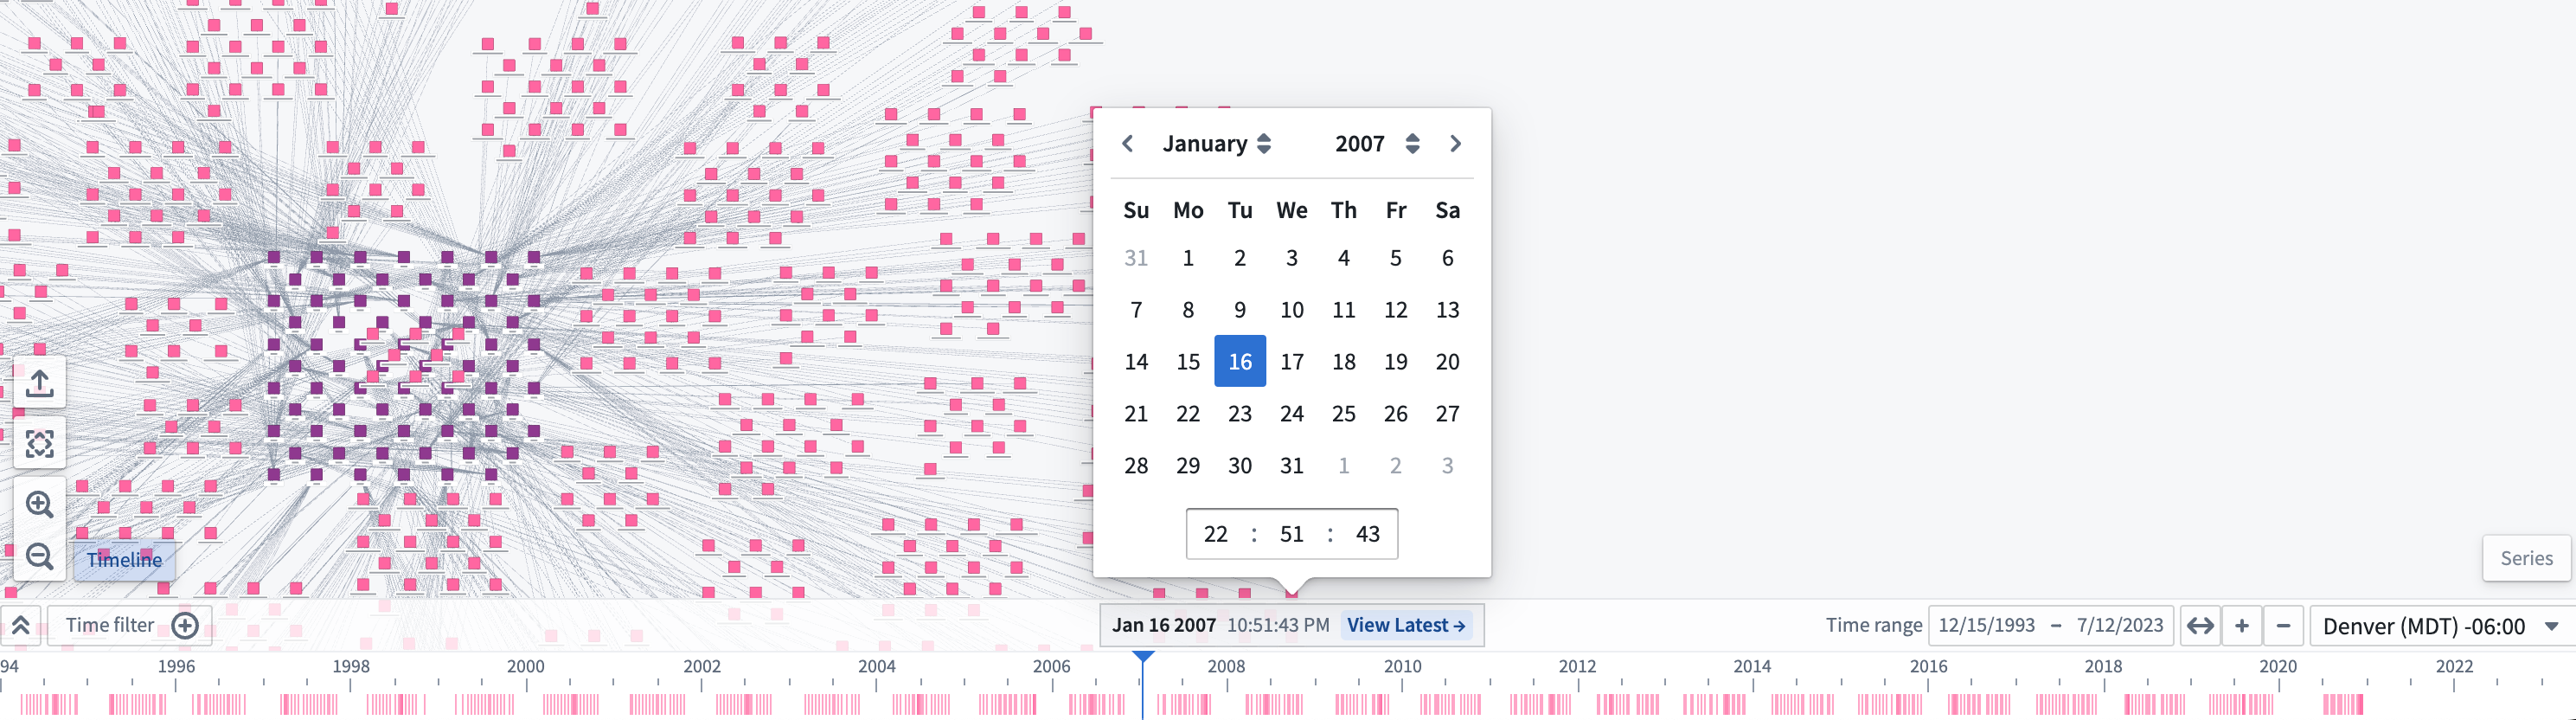
To get a more specific date for the cursor, you can click the cursor form to input a specific date and time.
Expand the timeline
To show each object type on its own timeline row, click the "expand" button (![]() ) in the control bar of the timeline.
) in the control bar of the timeline.
Style the timeline
To change how objects appear on the timeline, select the brush icon next to the object node in the Layers panel to the left of your screen. Then, expand the Timeline shape section.
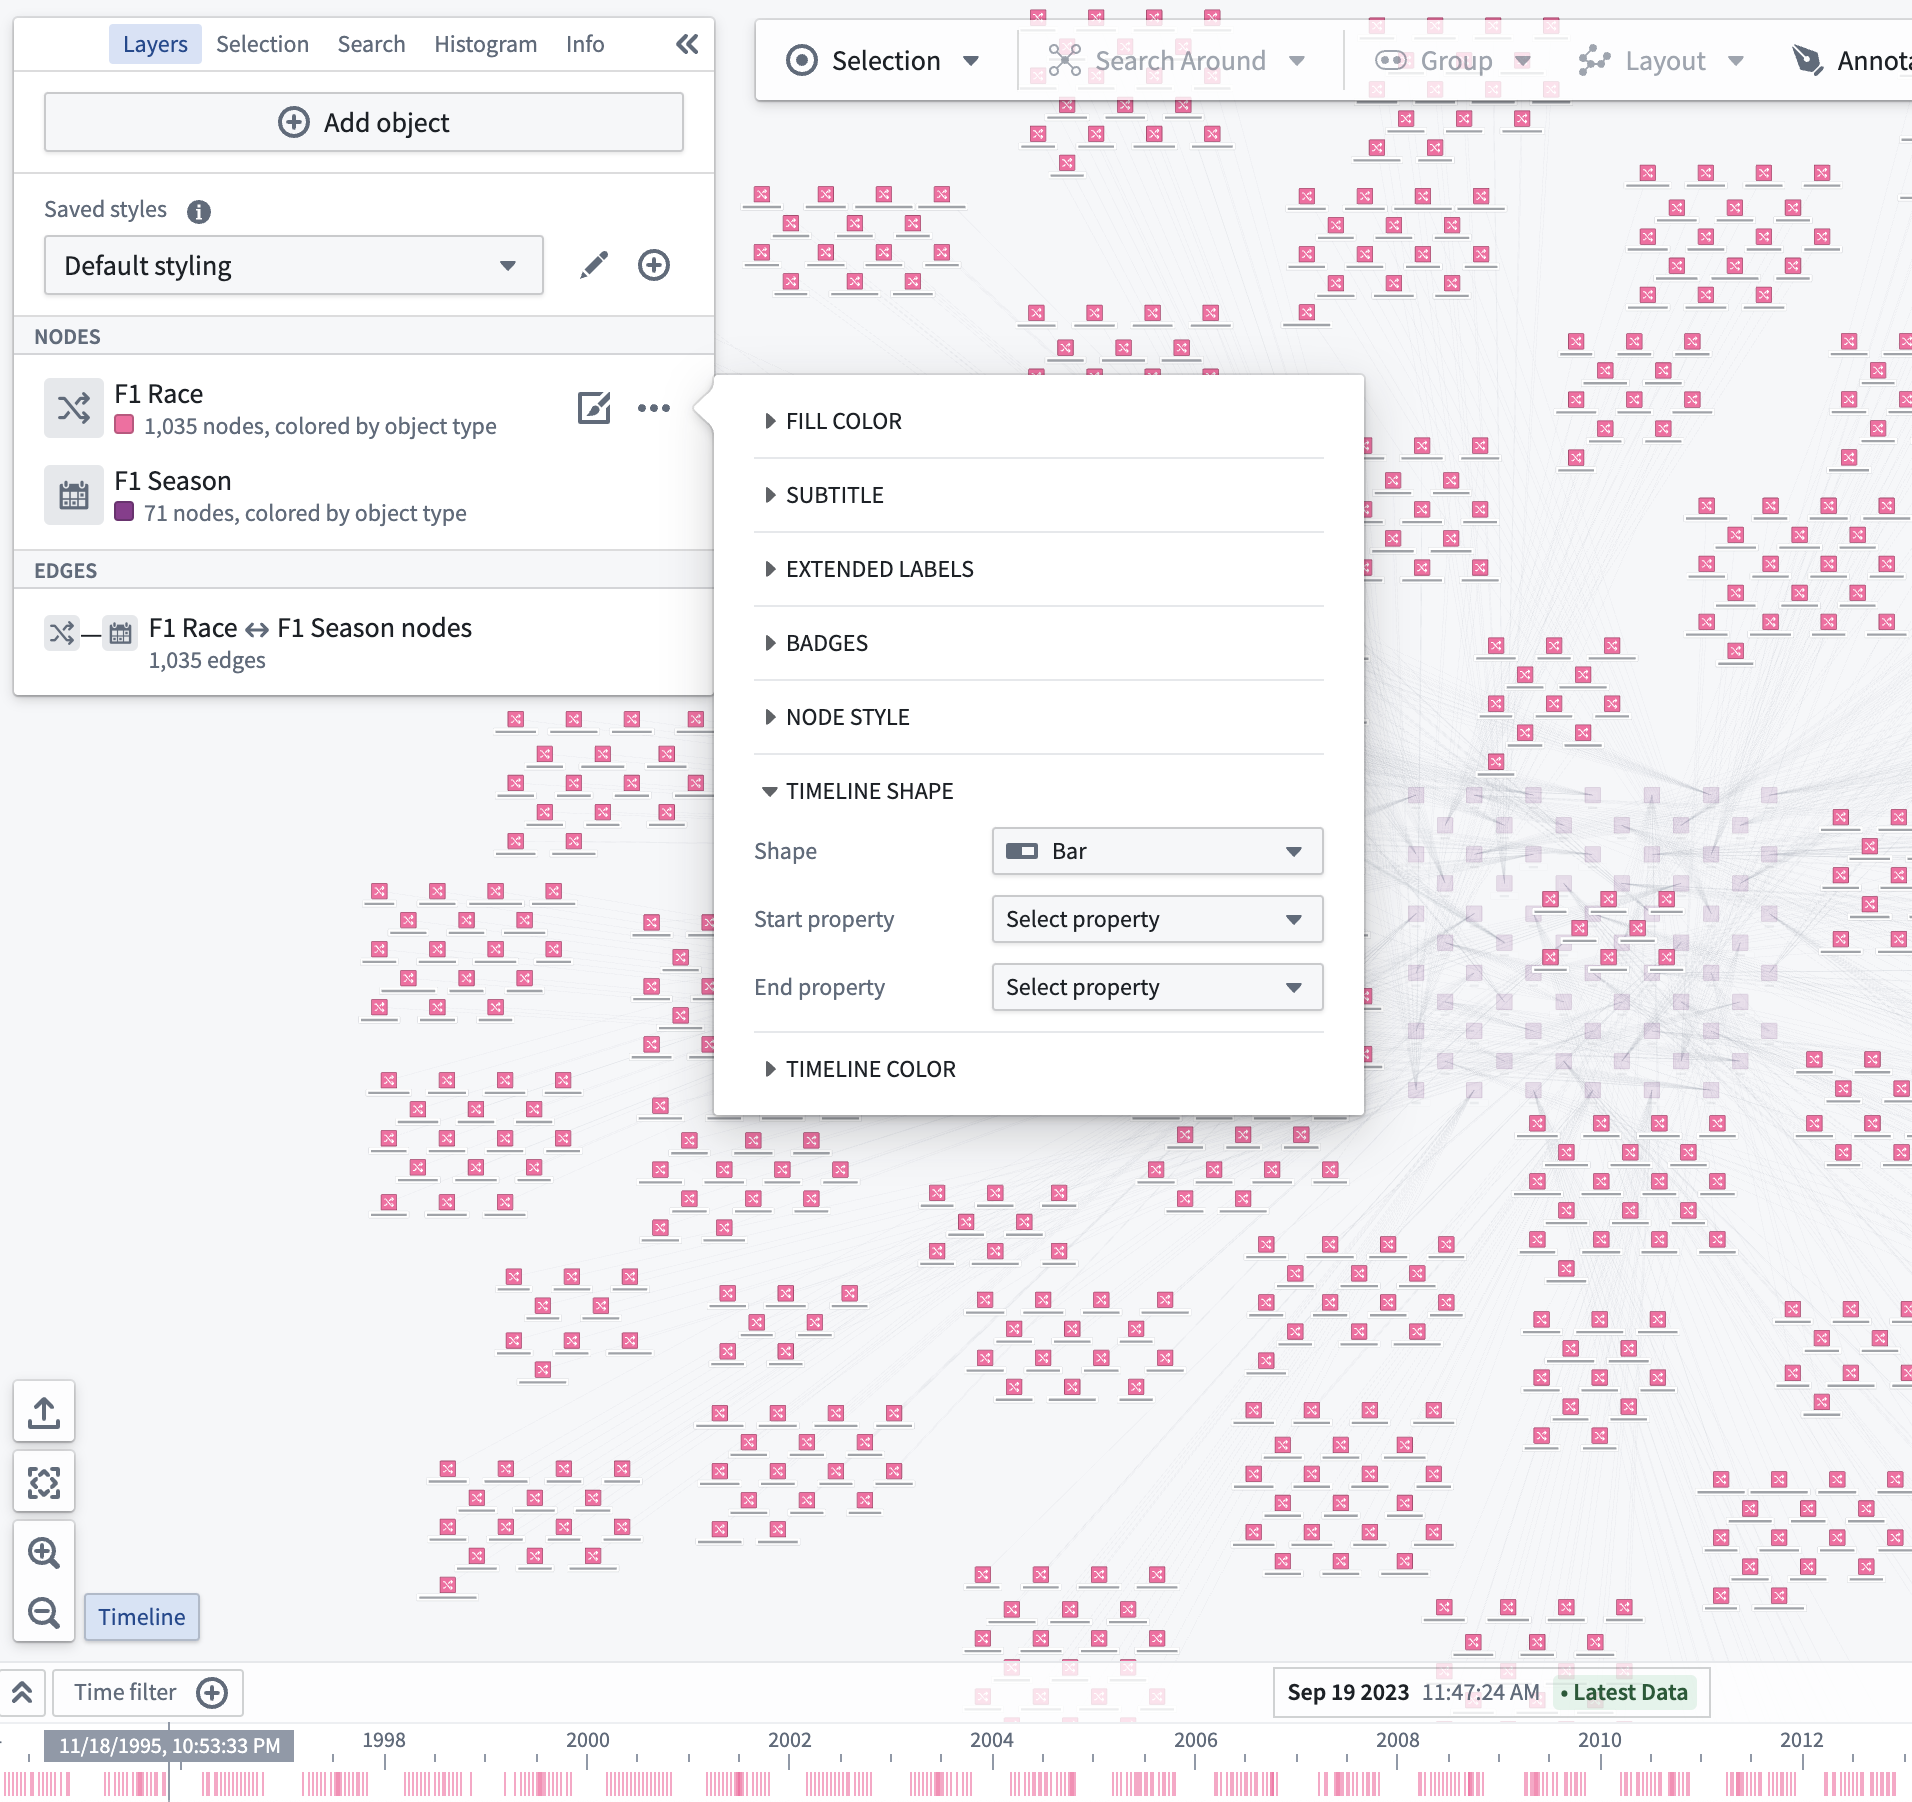
You can change the properties used when drawing the selected shape on the timeline; select the Start property and End property dropdown menus for shapes that use two time properties, or select Time property for shapes that use a single property.
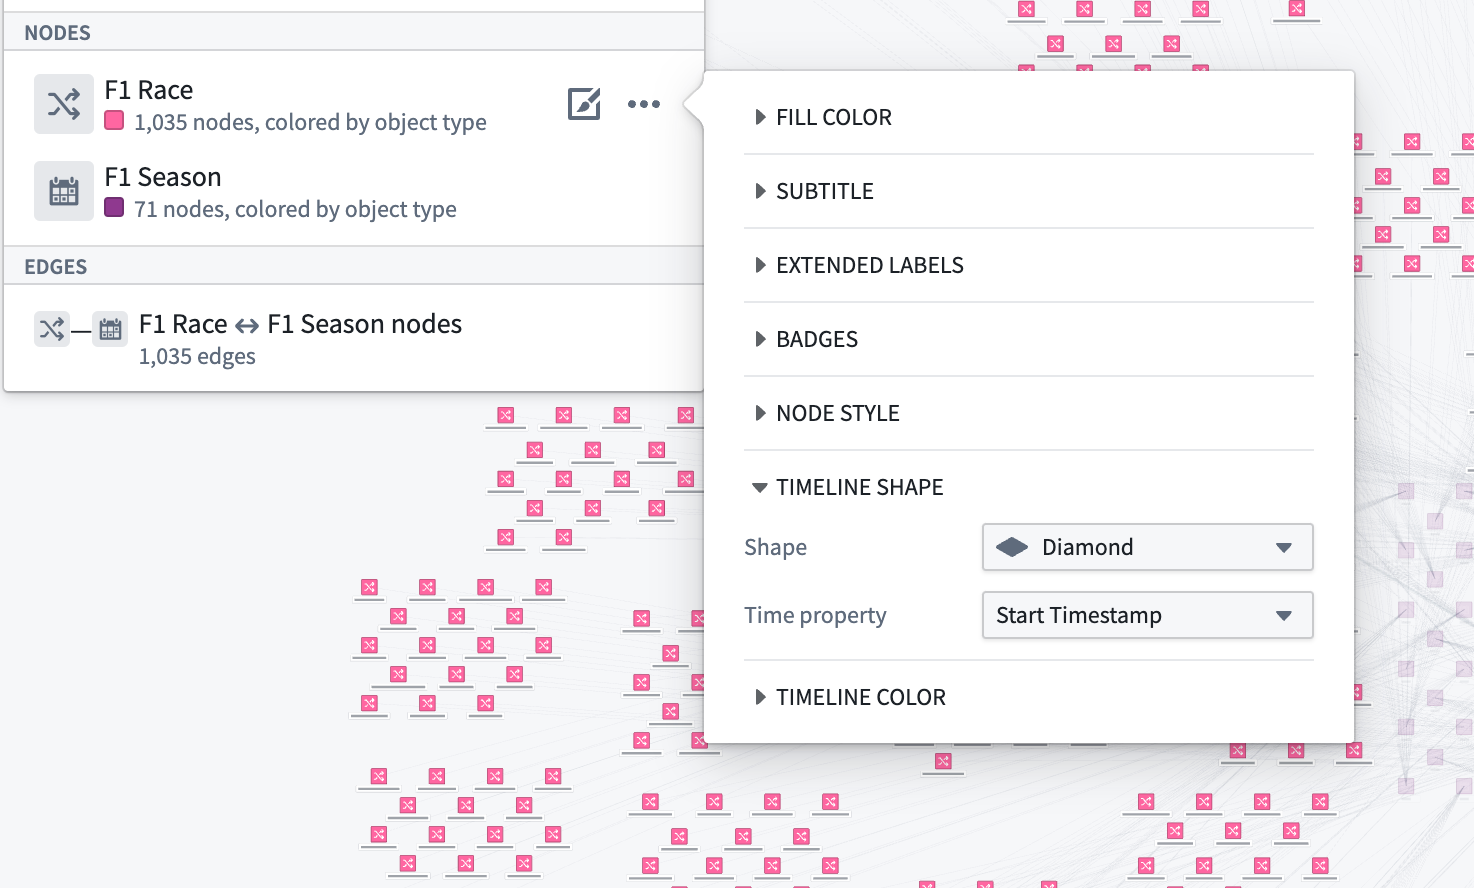
The shape chosen in the timeline style configuration will appear for every instance of the object type in the timeline.
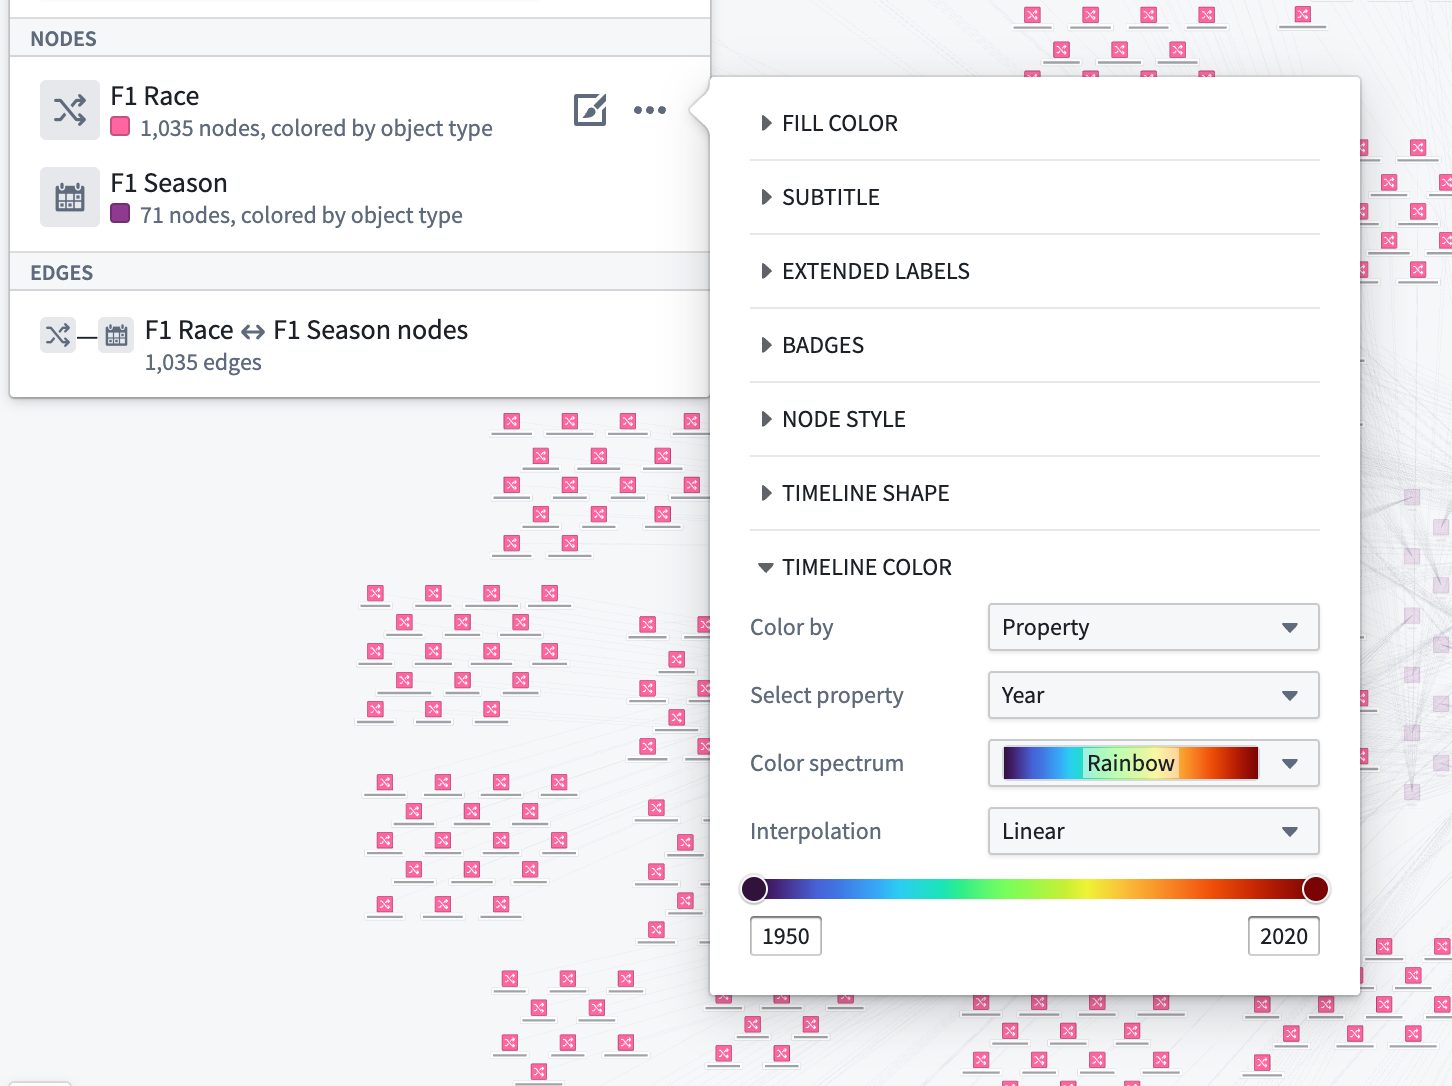
Select the Timeline Color menu to configure how shape colors are represented on your timeline.
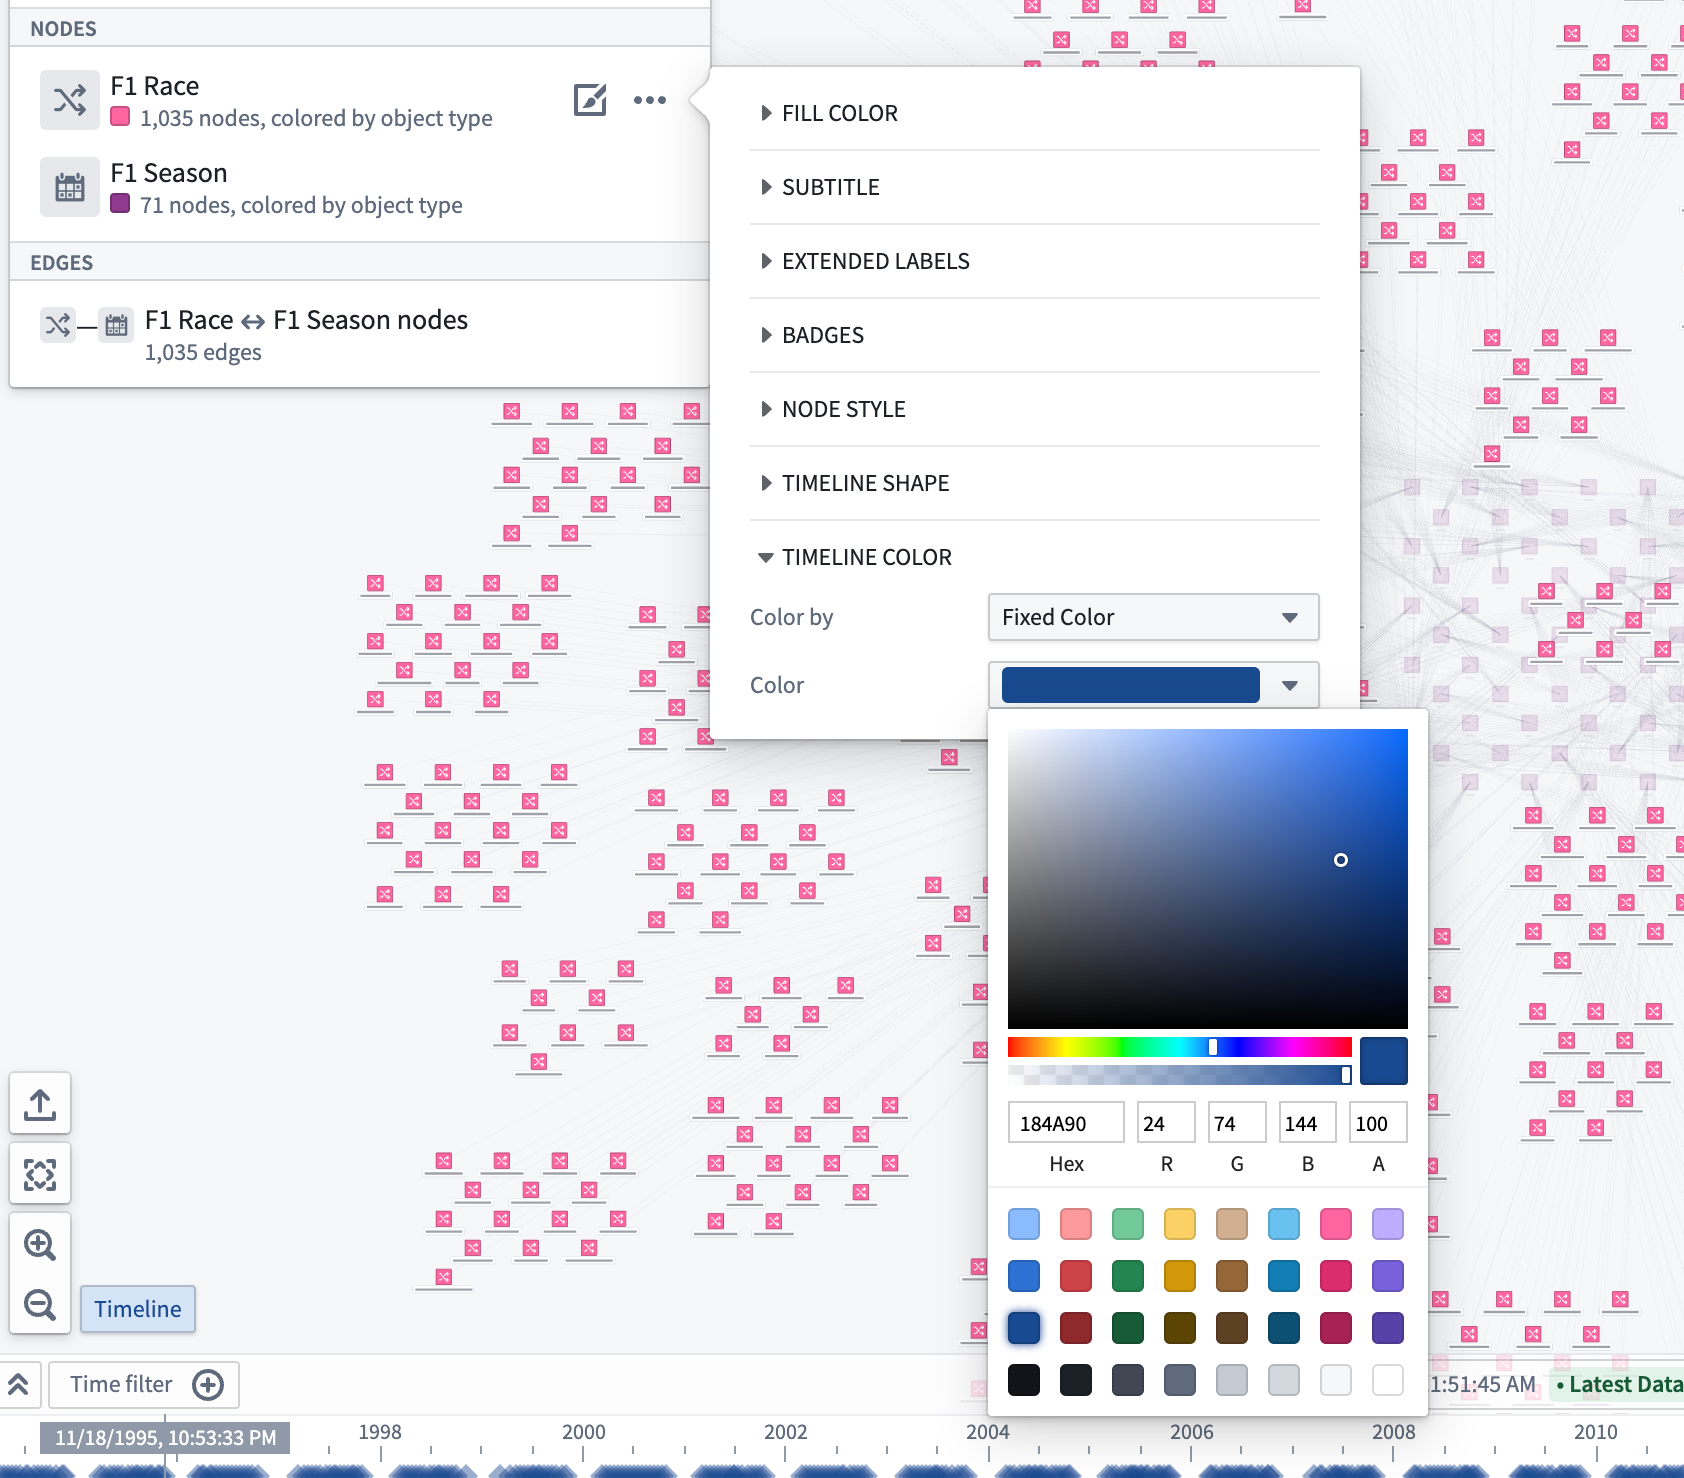
You can also use properties and measures to configure timeline color styling by changing the selected option in the Color by dropdown menu. For example, the image below is configured to color by the Year property with a rainbow color spectrum:
Timeline playback
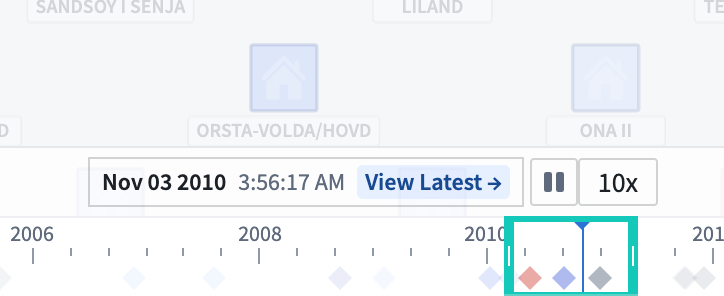
You can use the play button (⏵) to move the time cursor automatically; playback speed can be adjusted with the speed presets (1x, 2x, 5x, 10x, 100x, and so on).
The cursor will loop automatically through the time window on the timeline or a time filter if it exists.
中文翻译
在时间轴上查看和筛选事件
时间轴可用于查看对象的时间属性,并筛选出特定时间范围内的事件。
查看时间事件
界面左下角的时间轴按钮可用于显示或隐藏时间轴。
如果时间轴上没有任何显示,可使用缩放至合适按钮,将图上的时间事件显示在时间轴的时间范围内。
显示时,时间轴会以线条形式展示对象的时间属性,以条形形式展示对象属性中的时间范围。
筛选时间事件
可通过以下两种方式在图(graph)上筛选事件:按住 Shift 键并在时间轴上左键拖拽以创建时间筛选窗口,或使用时间轴控制栏中的时间筛选按钮。
应用程序顶部的时间筛选功能同样可用。图中与筛选条件匹配的节点将完全显示,而不匹配的节点则会淡出。
更改光标位置
可通过在时间轴上双击左键、拖拽光标至新位置,或使用控制栏中间的输入框来更改时间轴上的光标位置。
如需为光标设置更精确的日期,可点击光标表单输入具体的日期和时间。
展开时间轴
如需将每种对象类型显示在独立的时间轴行中,可点击时间轴控制栏中的"展开"按钮(![]() )。
)。
设置时间轴样式
如需更改对象在时间轴上的显示方式,请选择屏幕左侧图层面板中对象节点旁的画笔图标,然后展开时间轴形状部分。
您可以更改在时间轴上绘制所选形状时使用的属性:对于使用两个时间属性的形状,请选择起始属性和结束属性下拉菜单;对于使用单个属性的形状,请选择时间属性。
在时间轴样式配置中选择的形状将应用于该对象类型在时间轴上的所有实例。
选择时间轴颜色菜单,可配置形状颜色在时间轴上的显示方式。
您还可以通过更改颜色依据下拉菜单中的选项,使用属性和度量来配置时间轴的颜色样式。例如,下图配置为使用彩虹色谱根据 Year 属性着色:
时间轴播放
您可以使用播放按钮(⏵)自动移动时间光标;播放速度可通过速度预设(1x、2x、5x、10x、100x 等)进行调整。
光标将在时间轴的时间窗口内自动循环,如果存在时间筛选,则在该筛选范围内循环。