Visualize geospatial time series objects on a map(在地图上可视化地理空间时序对象)
Now that the Ship object type has time series properties and geospatial track capabilities configured in Ontology Manager, you can visualize ship tracks on a map. The map you create will contain your Ship object type's objects as well as their location history as track geometries.
Part I: Add Ship objects to a new map
- Navigate to your project folder and create a new map.
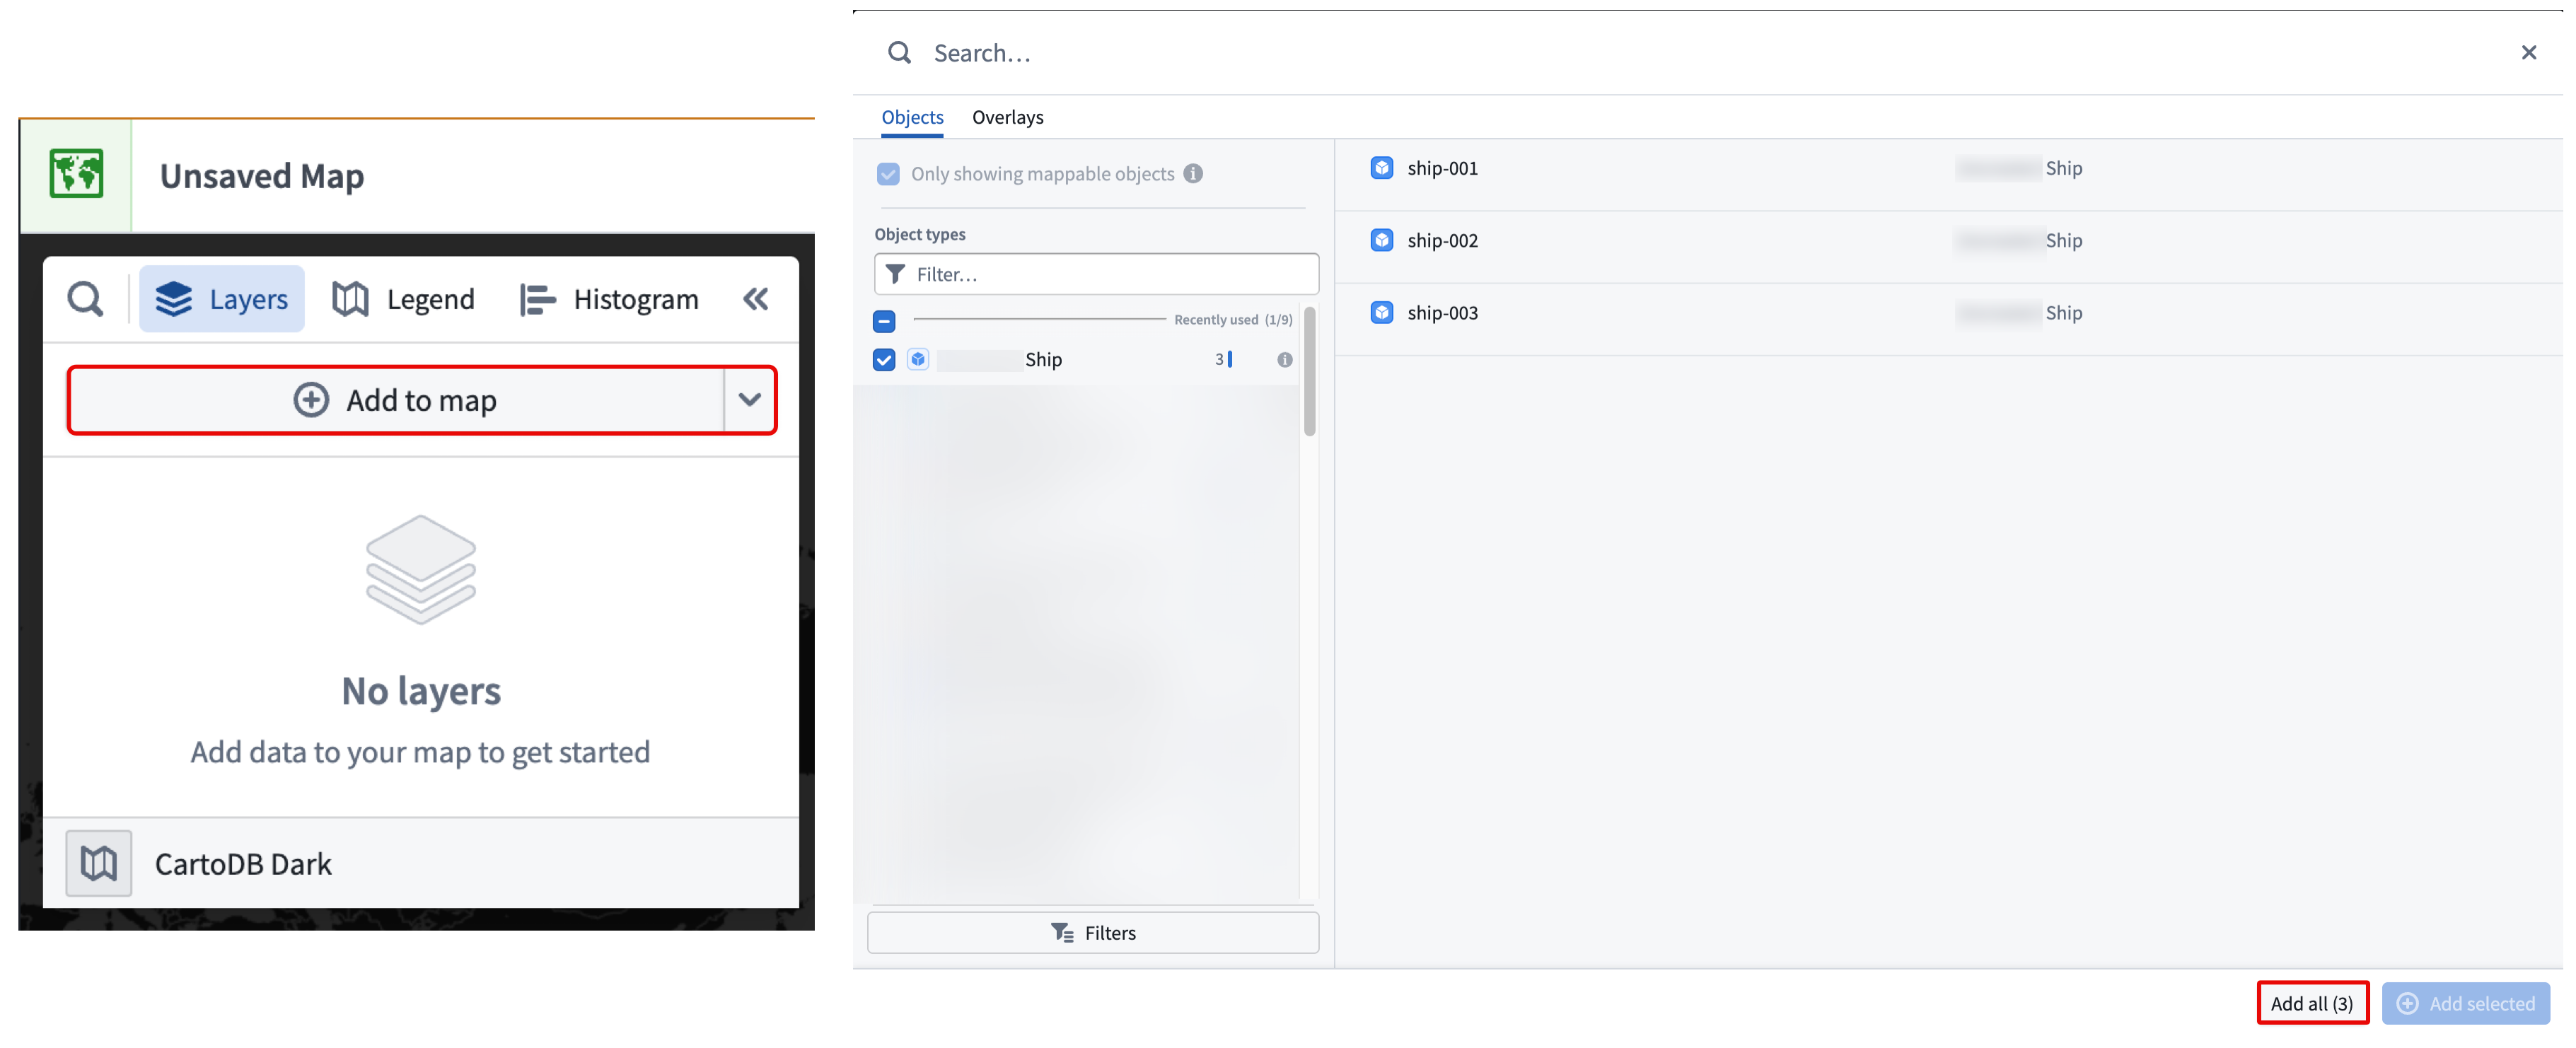
- Select Add to map in the Layers tab of the left panel.
- Search for your
Shipobject type in the search bar or select it from the Object types list in the Objects panel. - Choose to Add all objects to your map from the bottom right corner.
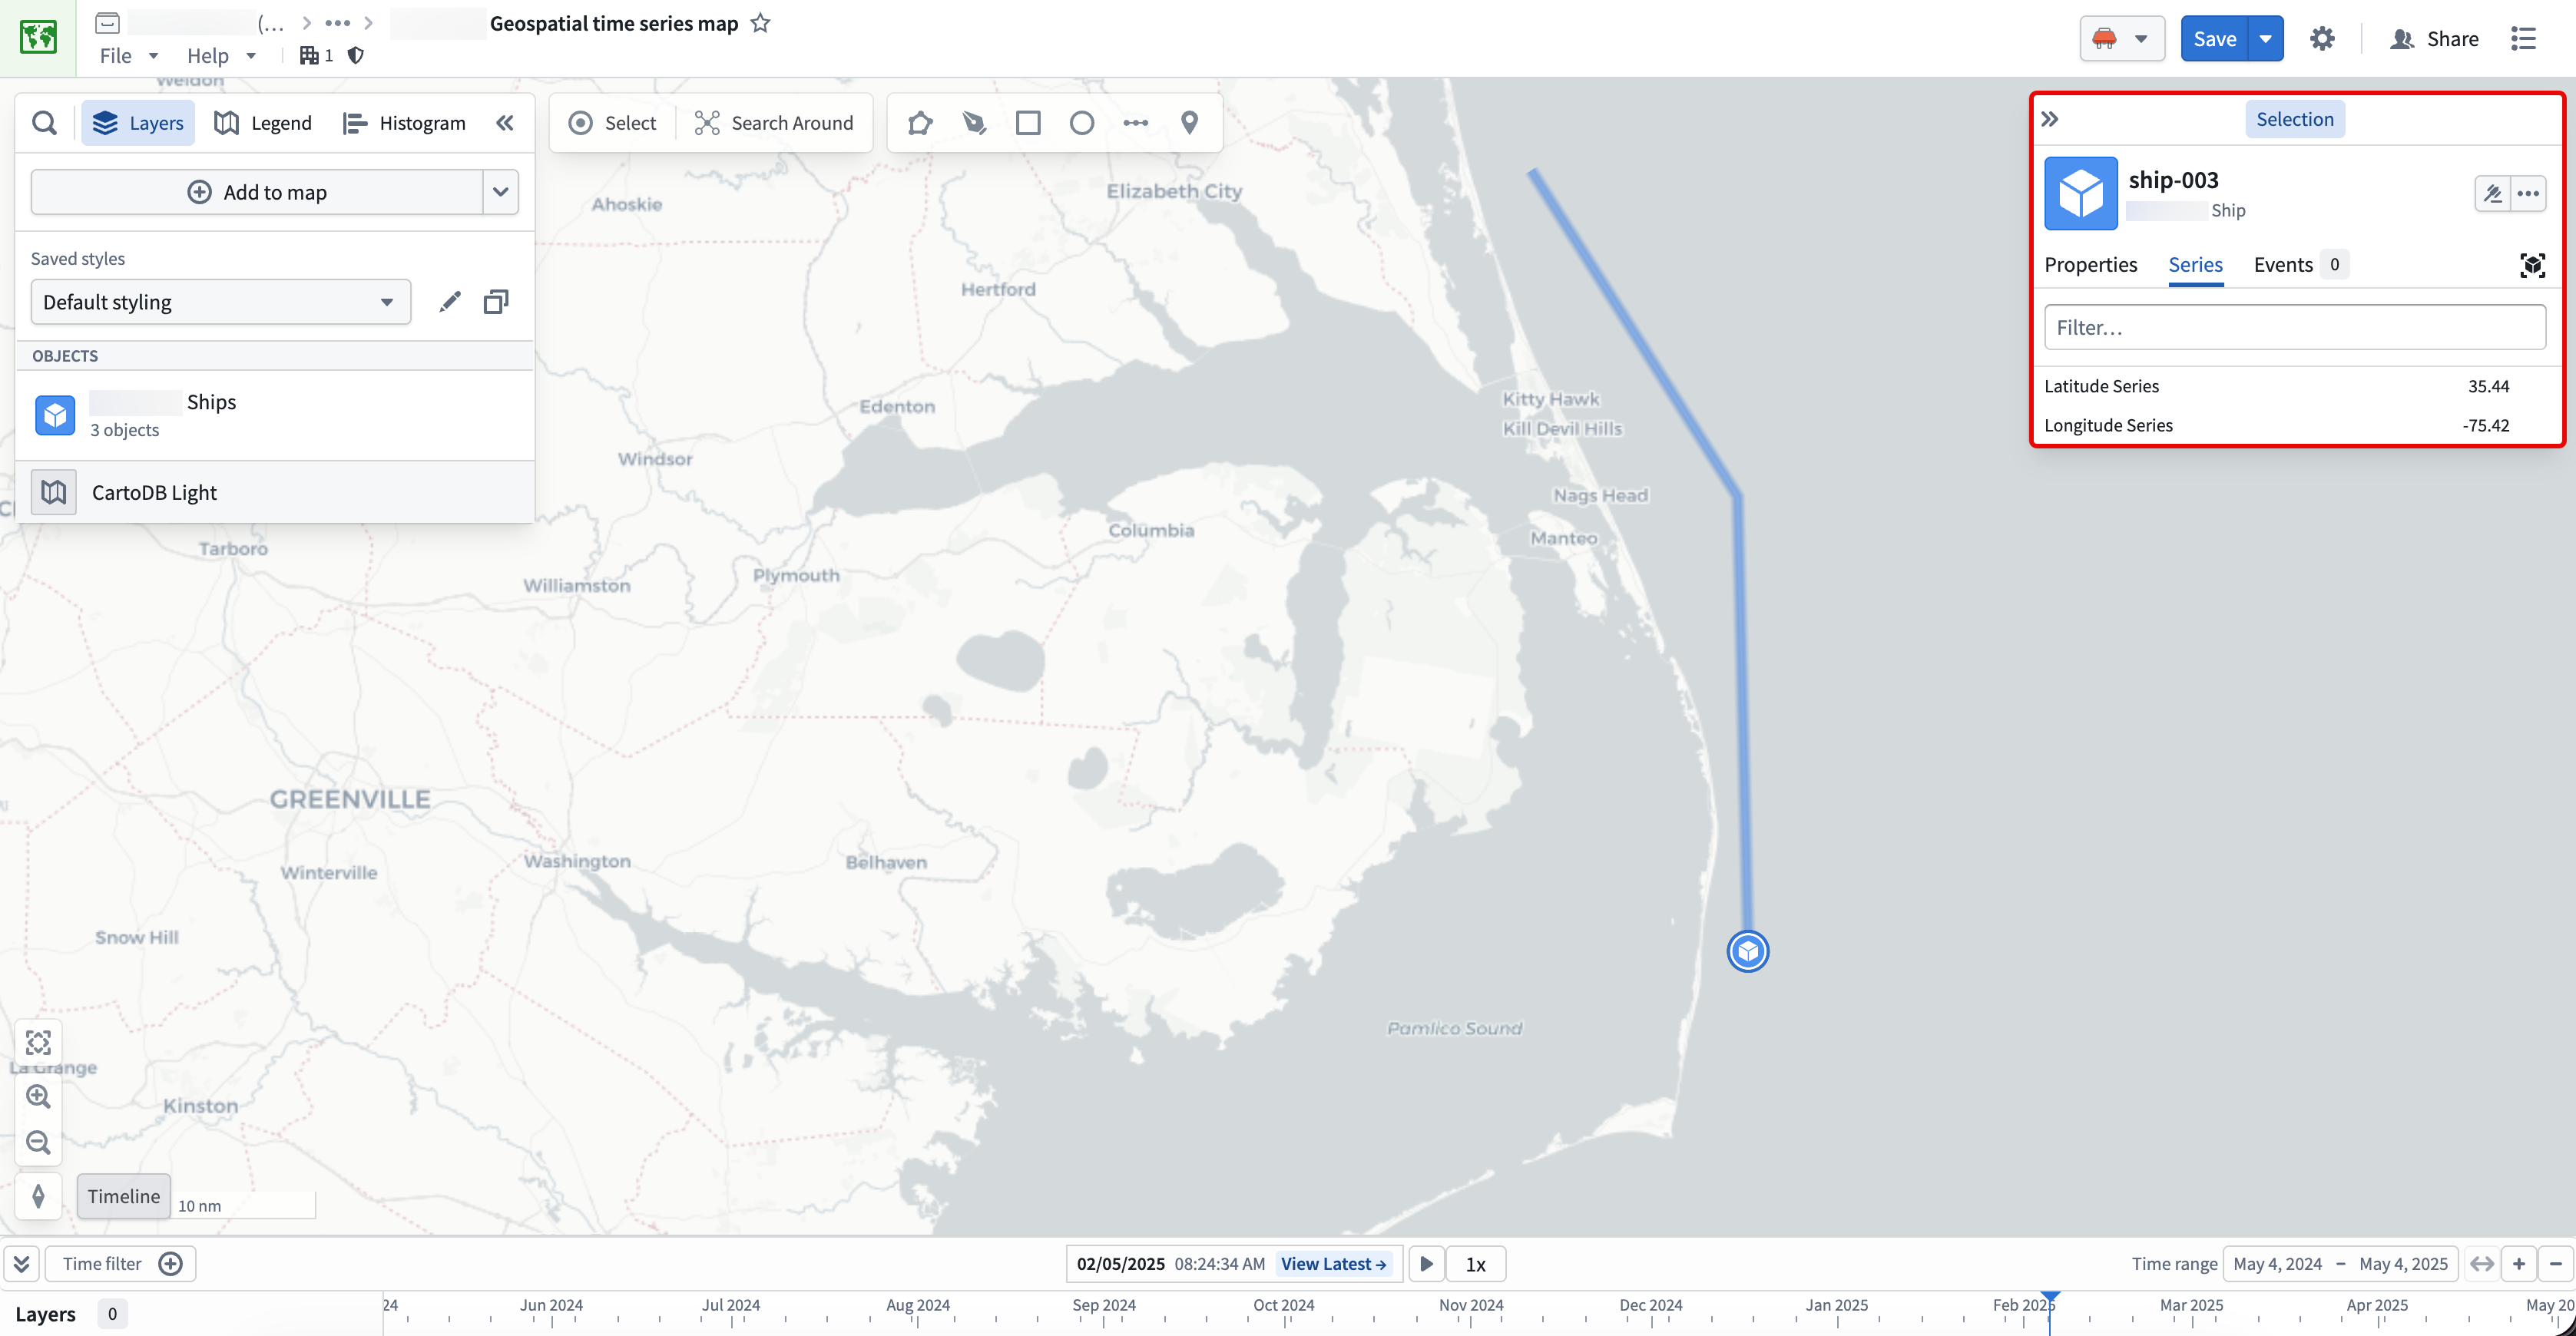
Your ship objects with geospatial data will render on the map, displaying their track geometry. Choose an object to launch the Selection panel on the right side of your map, where you can take actions on the object and configure its styling.
:::callout{theme="neutral"} You can learn more about visualizing tracks and configuring track geometry in the Map application's existing documentation. :::
Part II: Add an object's time series properties to the map's timeline
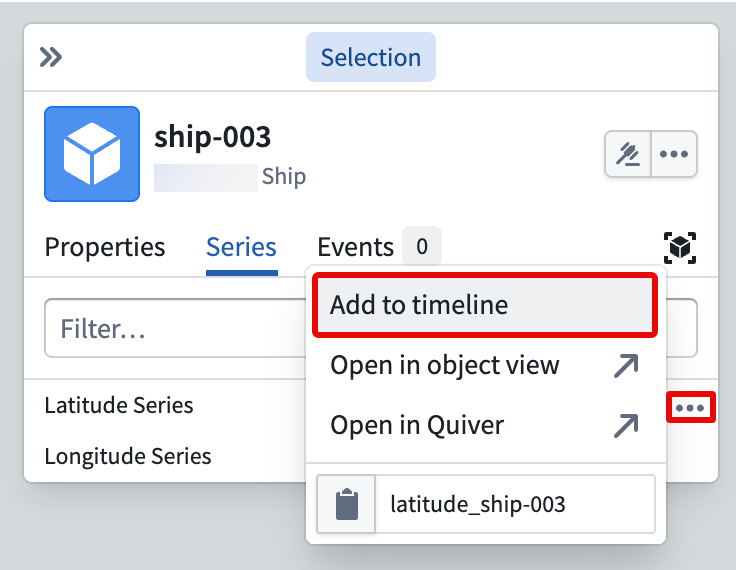
With a Ship object open in the Series tab of the Selection panel, hover over and select the ellipsis (...) icon on the right side of your Latitude Series and Longitude Series properties and choose Add to timeline. This enables you to view your time series properties on your map's timeline.
Select, hold, and drag your cursor along the timeline to observe the ship's position update on the map in real time.
Learn more about interacting with time and temporal data on your map.
中文翻译
在地图上可视化地理空间时序对象
在Ontology Manager中为Ship对象类型配置好时序属性(time series properties)和地理空间轨迹(geospatial track)功能后,您就可以在地图上可视化船舶轨迹了。您创建的地图将包含Ship对象类型的对象及其以轨迹几何图形(track geometries)形式呈现的位置历史记录。
第一部分:将Ship对象添加到新地图
- 导航至项目文件夹并创建新地图。
- 在左侧面板的图层(Layers)选项卡中选择添加到地图(Add to map)。
- 在搜索栏中搜索您的
Ship对象类型,或从对象(Objects)面板的对象类型(Object types)列表中选择。 - 点击右下角的添加全部(Add all)将对象全部添加到地图。
包含地理空间数据的船舶对象将在地图上渲染,并显示其轨迹几何图形。选择某个对象可打开地图右侧的选择(Selection)面板,您可以在其中对对象执行操作并配置其样式。
:::callout{theme="neutral"} 您可以在Map应用程序的现有文档中了解更多关于可视化轨迹和配置轨迹几何图形的信息。 :::
第二部分:将对象的时序属性添加到地图时间轴
在选择(Selection)面板的序列(Series)选项卡中打开Ship对象后,将鼠标悬停在Latitude Series和Longitude Series属性右侧的省略号(...)图标上并选择添加到时间轴(Add to timeline)。这样您就可以在地图的时间轴(timeline)上查看时序属性。
按住并沿时间轴拖动光标,即可实时观察船舶在地图上的位置更新。