Use sensor object type time series data in Workshop and Quiver(在 Workshop 和 Quiver 中使用传感器对象类型时间序列数据)
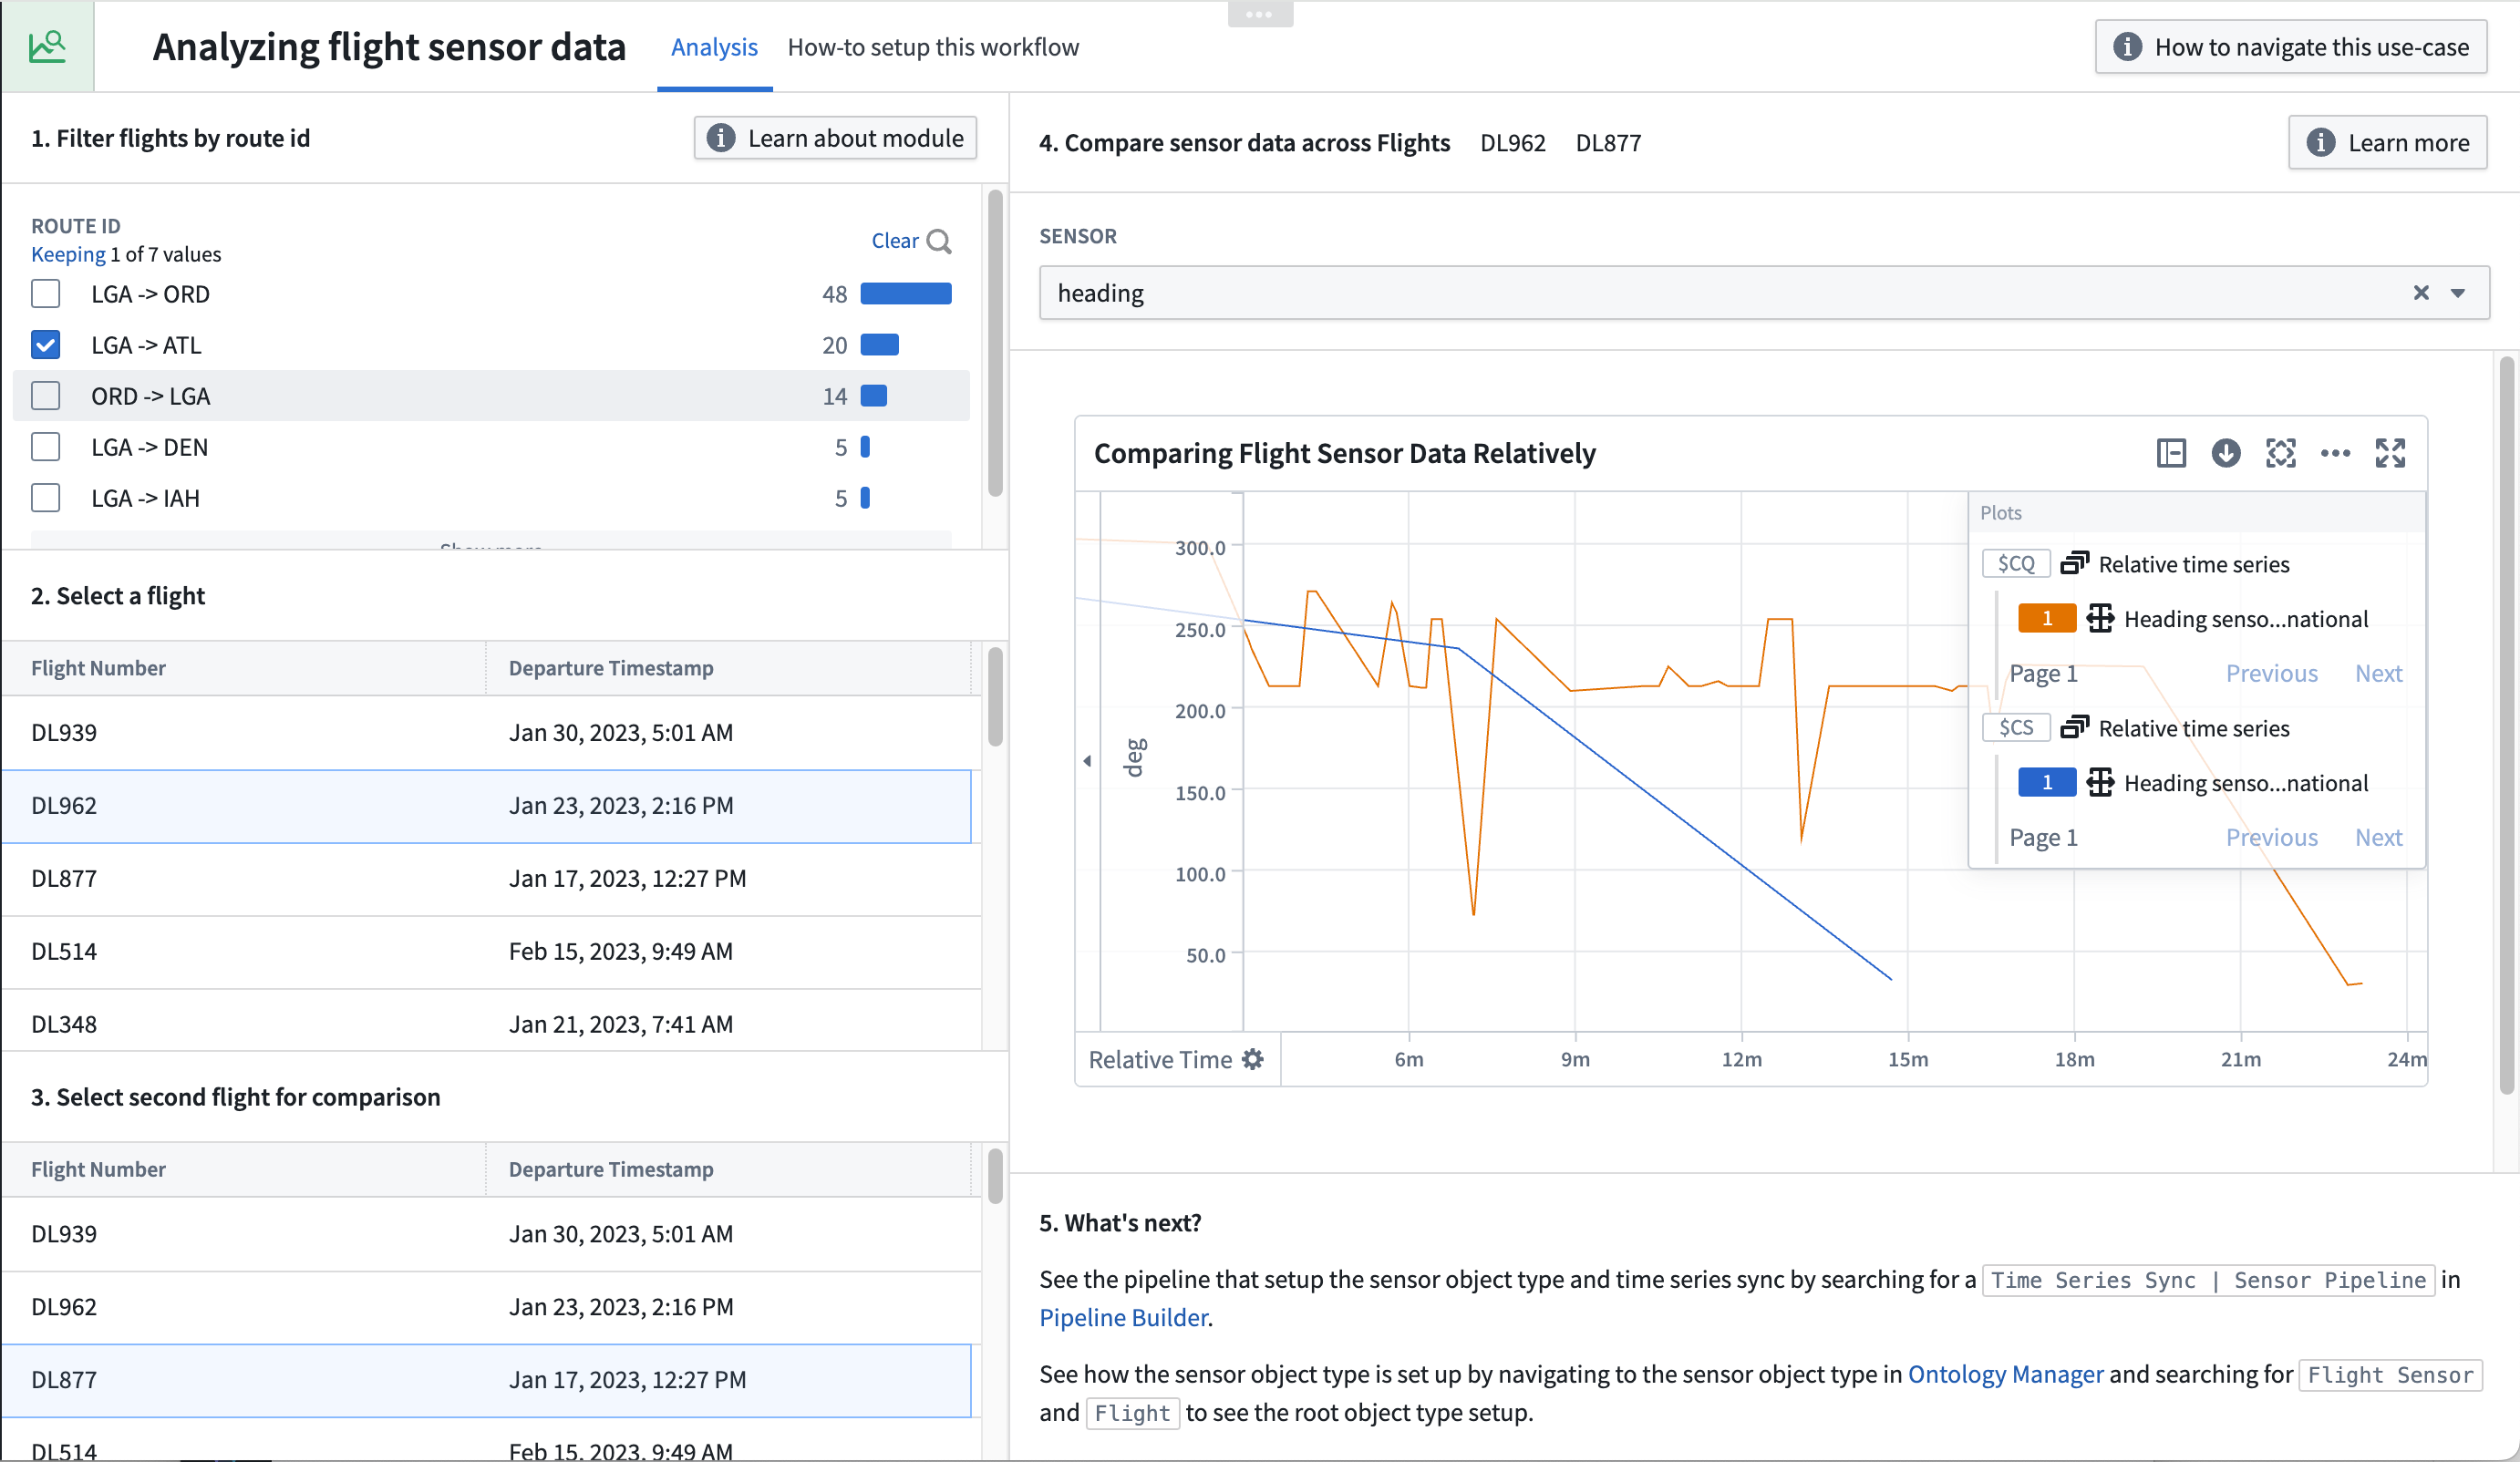
To start using sensor object type time series data, open the Flight Sensor Data module in Workshop. You can find the module using the platform Quicksearch feature. This example module will be a reference for you as you configure your own Workshop module using sensor object type time series data.
By the end of this guide, our module will enable you to filter down flights by departure time and airport. From there, the Object Table widget will display a list of flights you can select to view the linked sensor object time series data.
Part I: Set up initial widgets in a Workshop module
The Map, Object Table, and Filter widgets of the module are standard Workshop features. Follow the steps below to configure these widgets before adding time series-specific widgets to the module.
Filter flights by route ID
The Filter List widget should take the Flight object set and apply filters based on route id.
- In your Workshop module, choose to + Add widget, then select the Filter List widget.
- In the right side configuration of the Filter List widget, create a new variable for the Object set Input and name it "Filter flights by route id". The Starting object set should should use the
Flights with linked flight sensorsobject type variable.
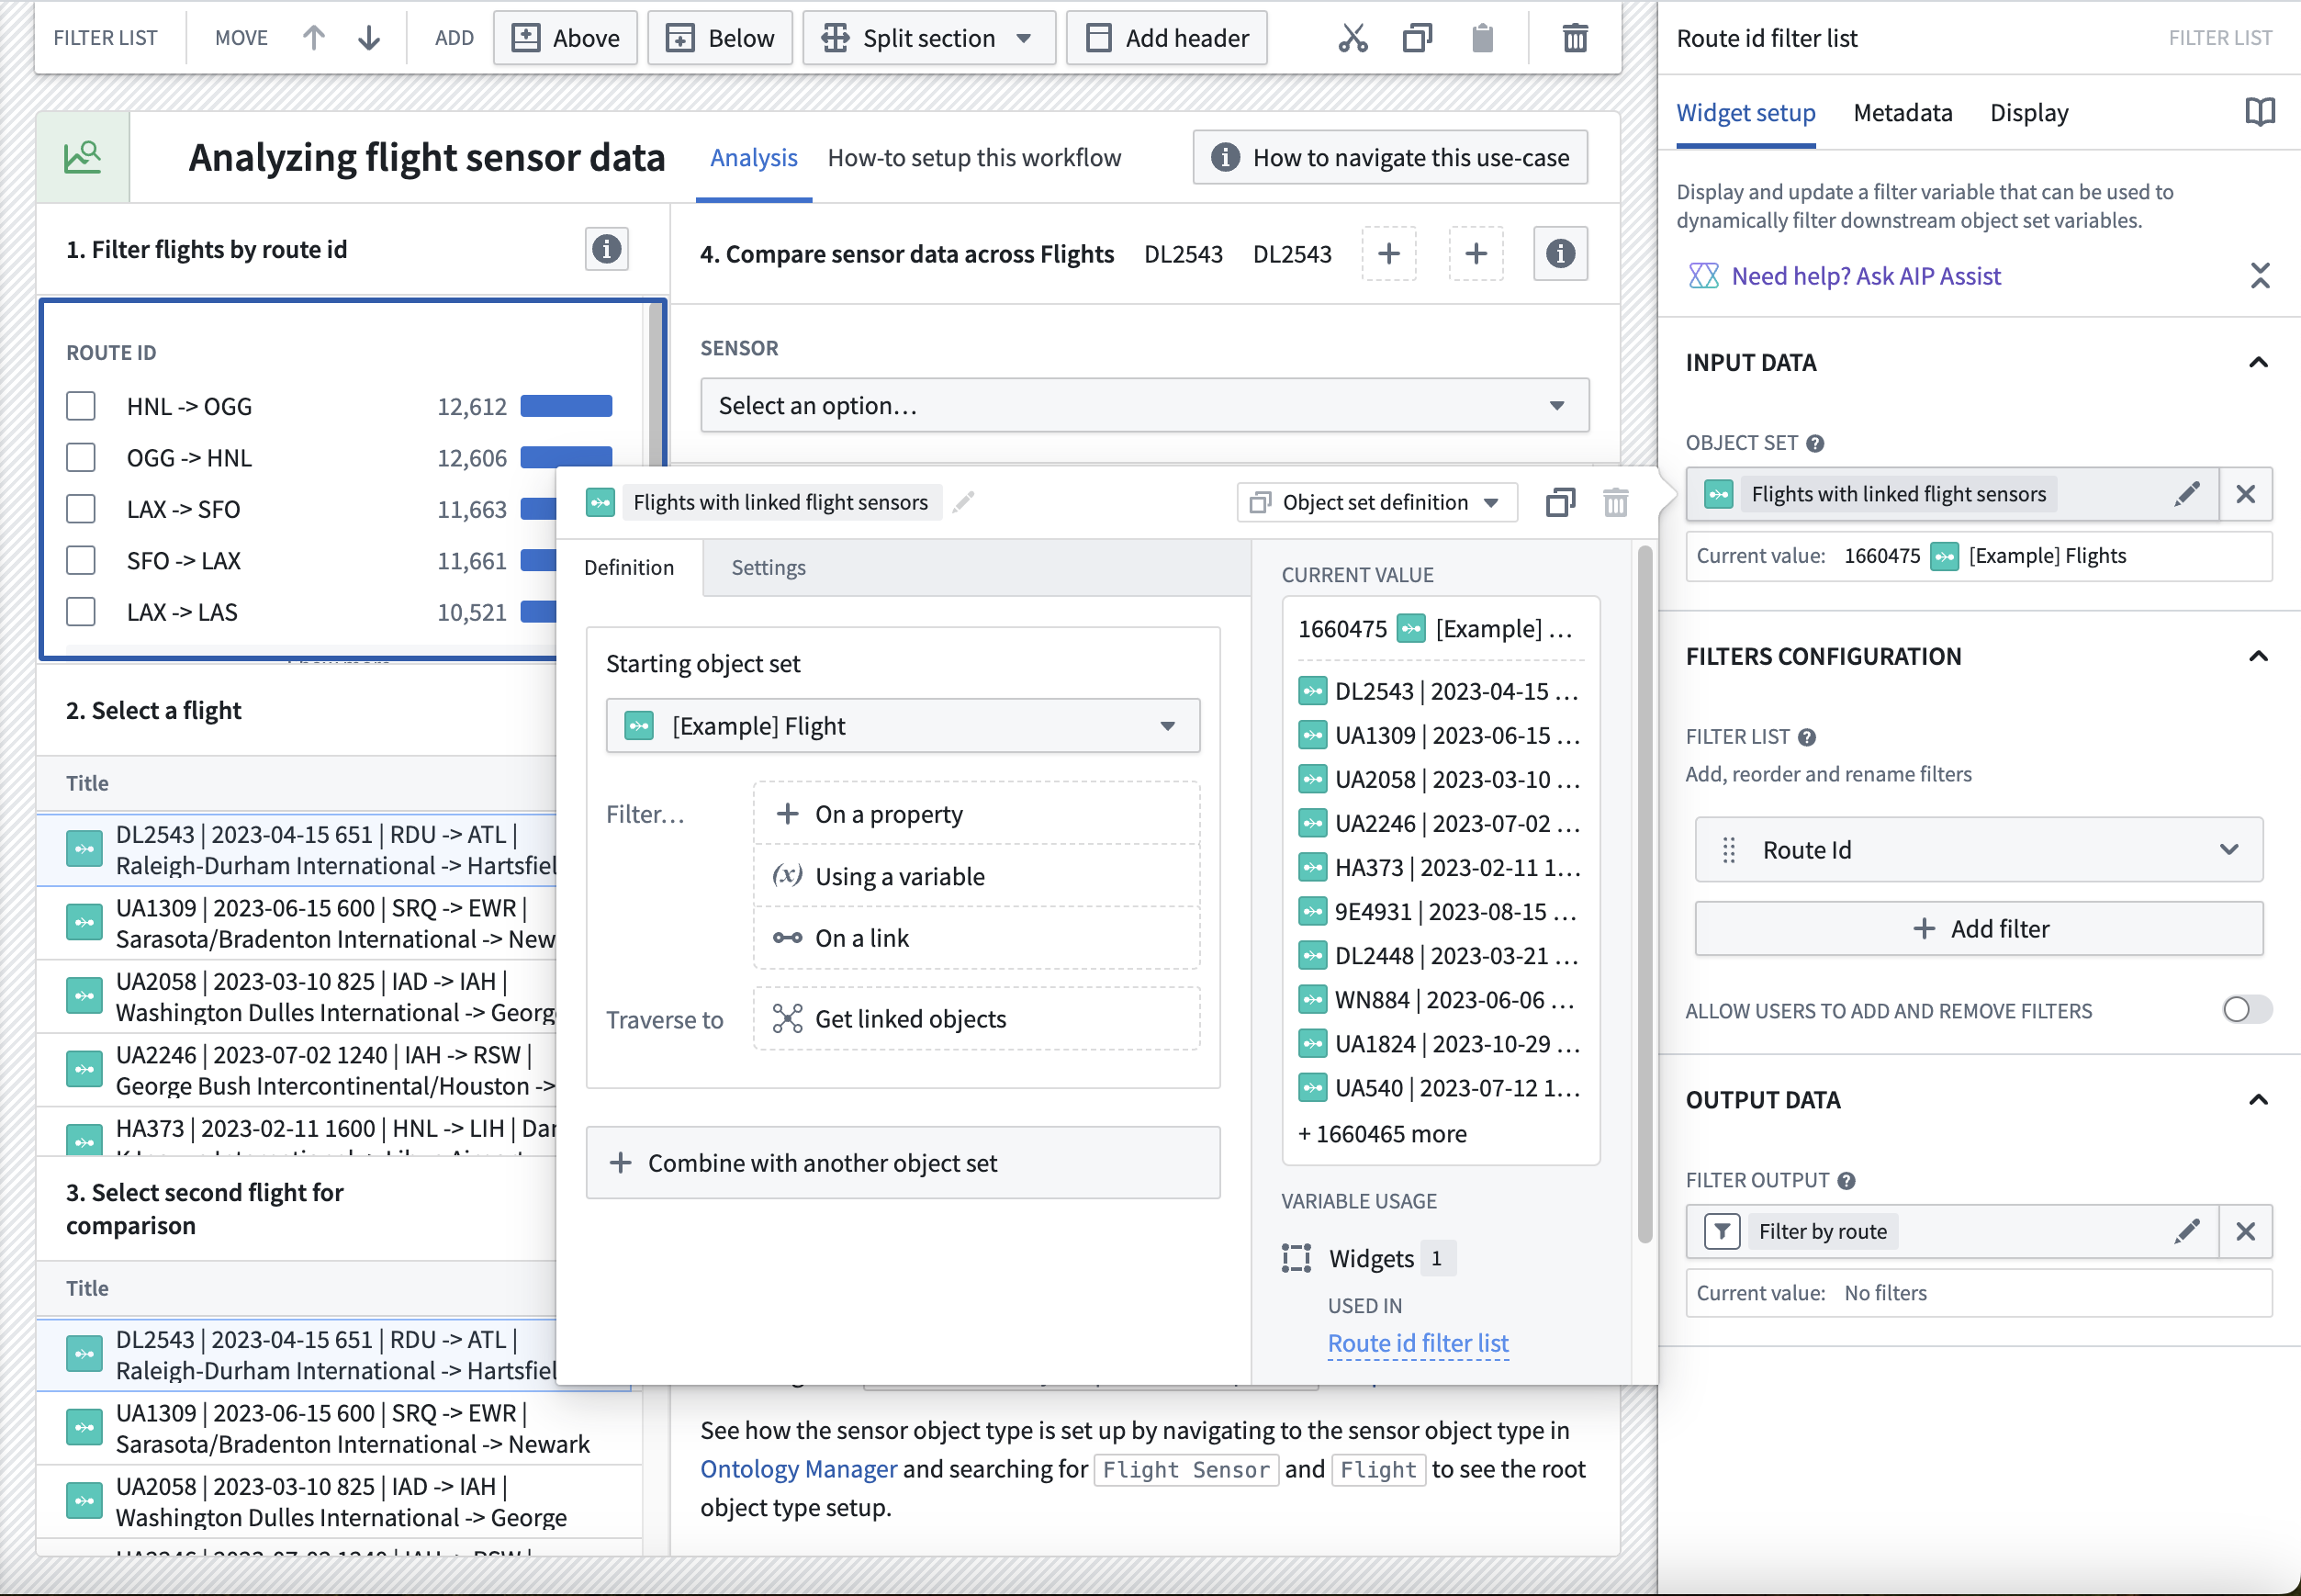
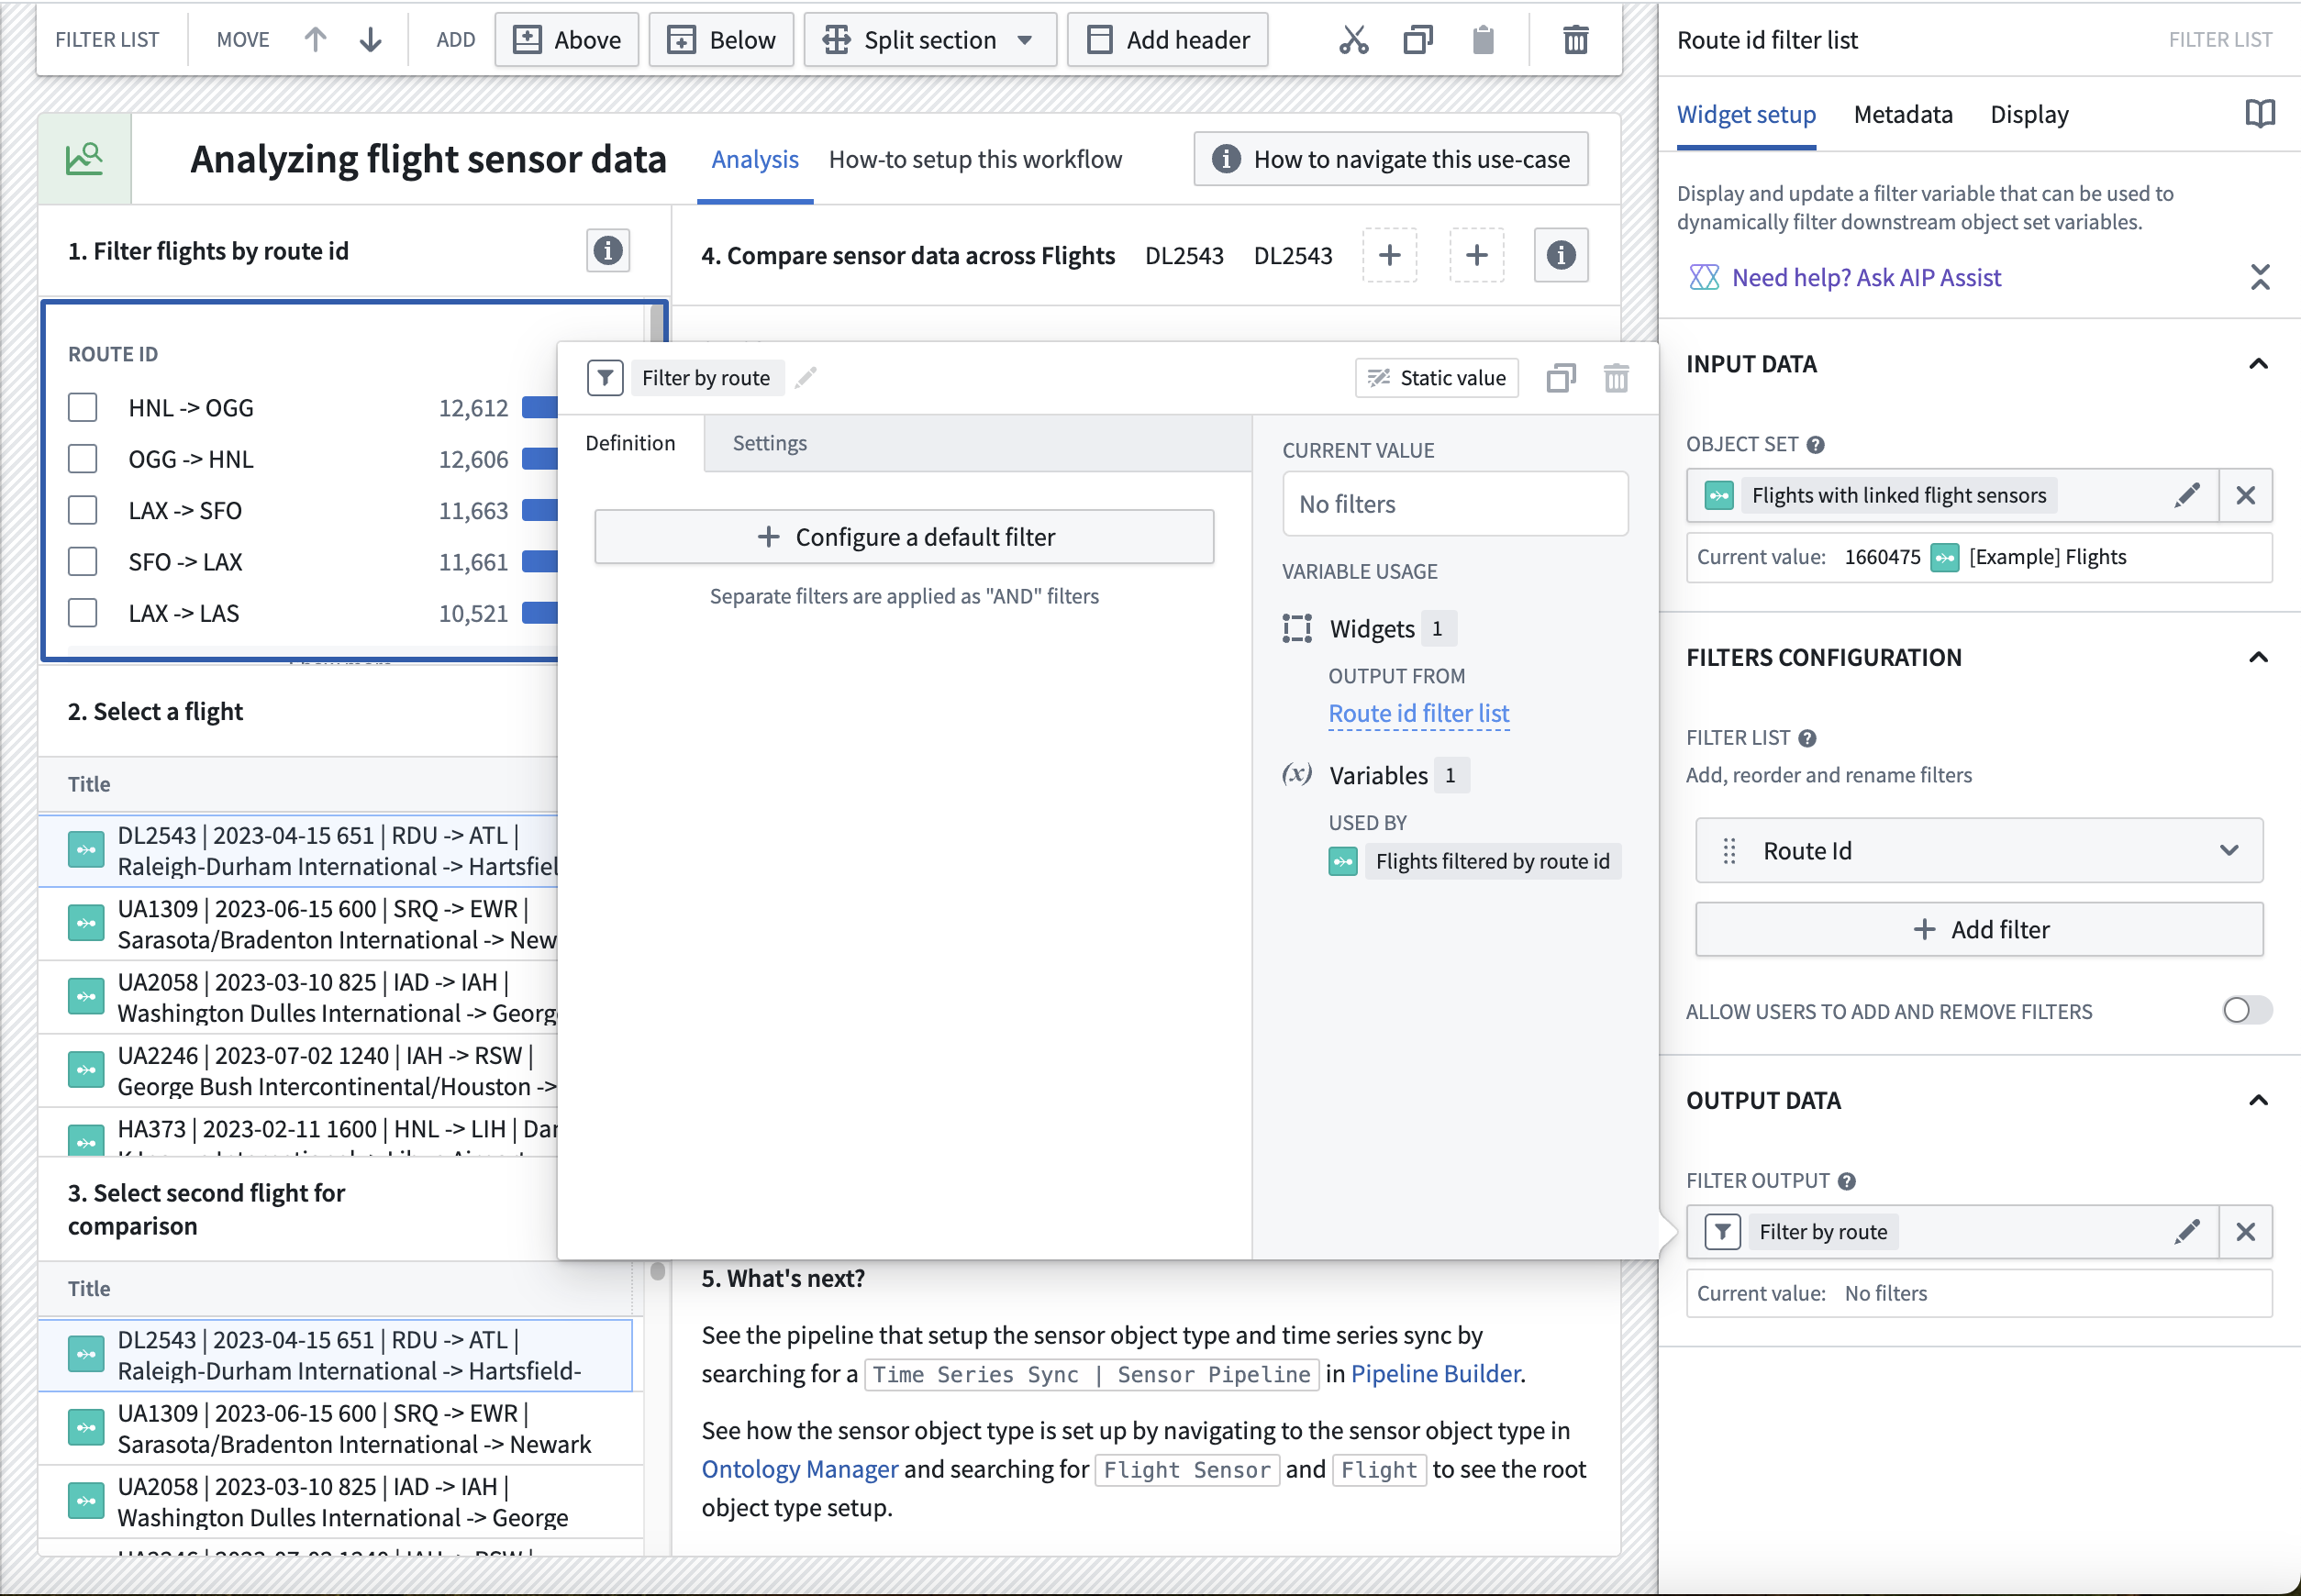
- Add the
Route Idproperty by selecting + Add filter. - Move down to the Filter output field to find a filter output that was already created for you. Give it a descriptive name like "Flights filtered by route id"; no other configuration is required.
Configure Object Table widgets to select flights for comparison
- In your Workshop module, choose to + Add widget, then select the Object Table widget.
- In the configuration panel on the right in the Input Data dropdown menu, choose + New object set variable.
- Name the variable
Flights filtered by route id. - Select the Starting object set and choose the existing variable
Flights with linked flight sensors. - Select the filter Using a variable, and select the
Filter by routevariable.
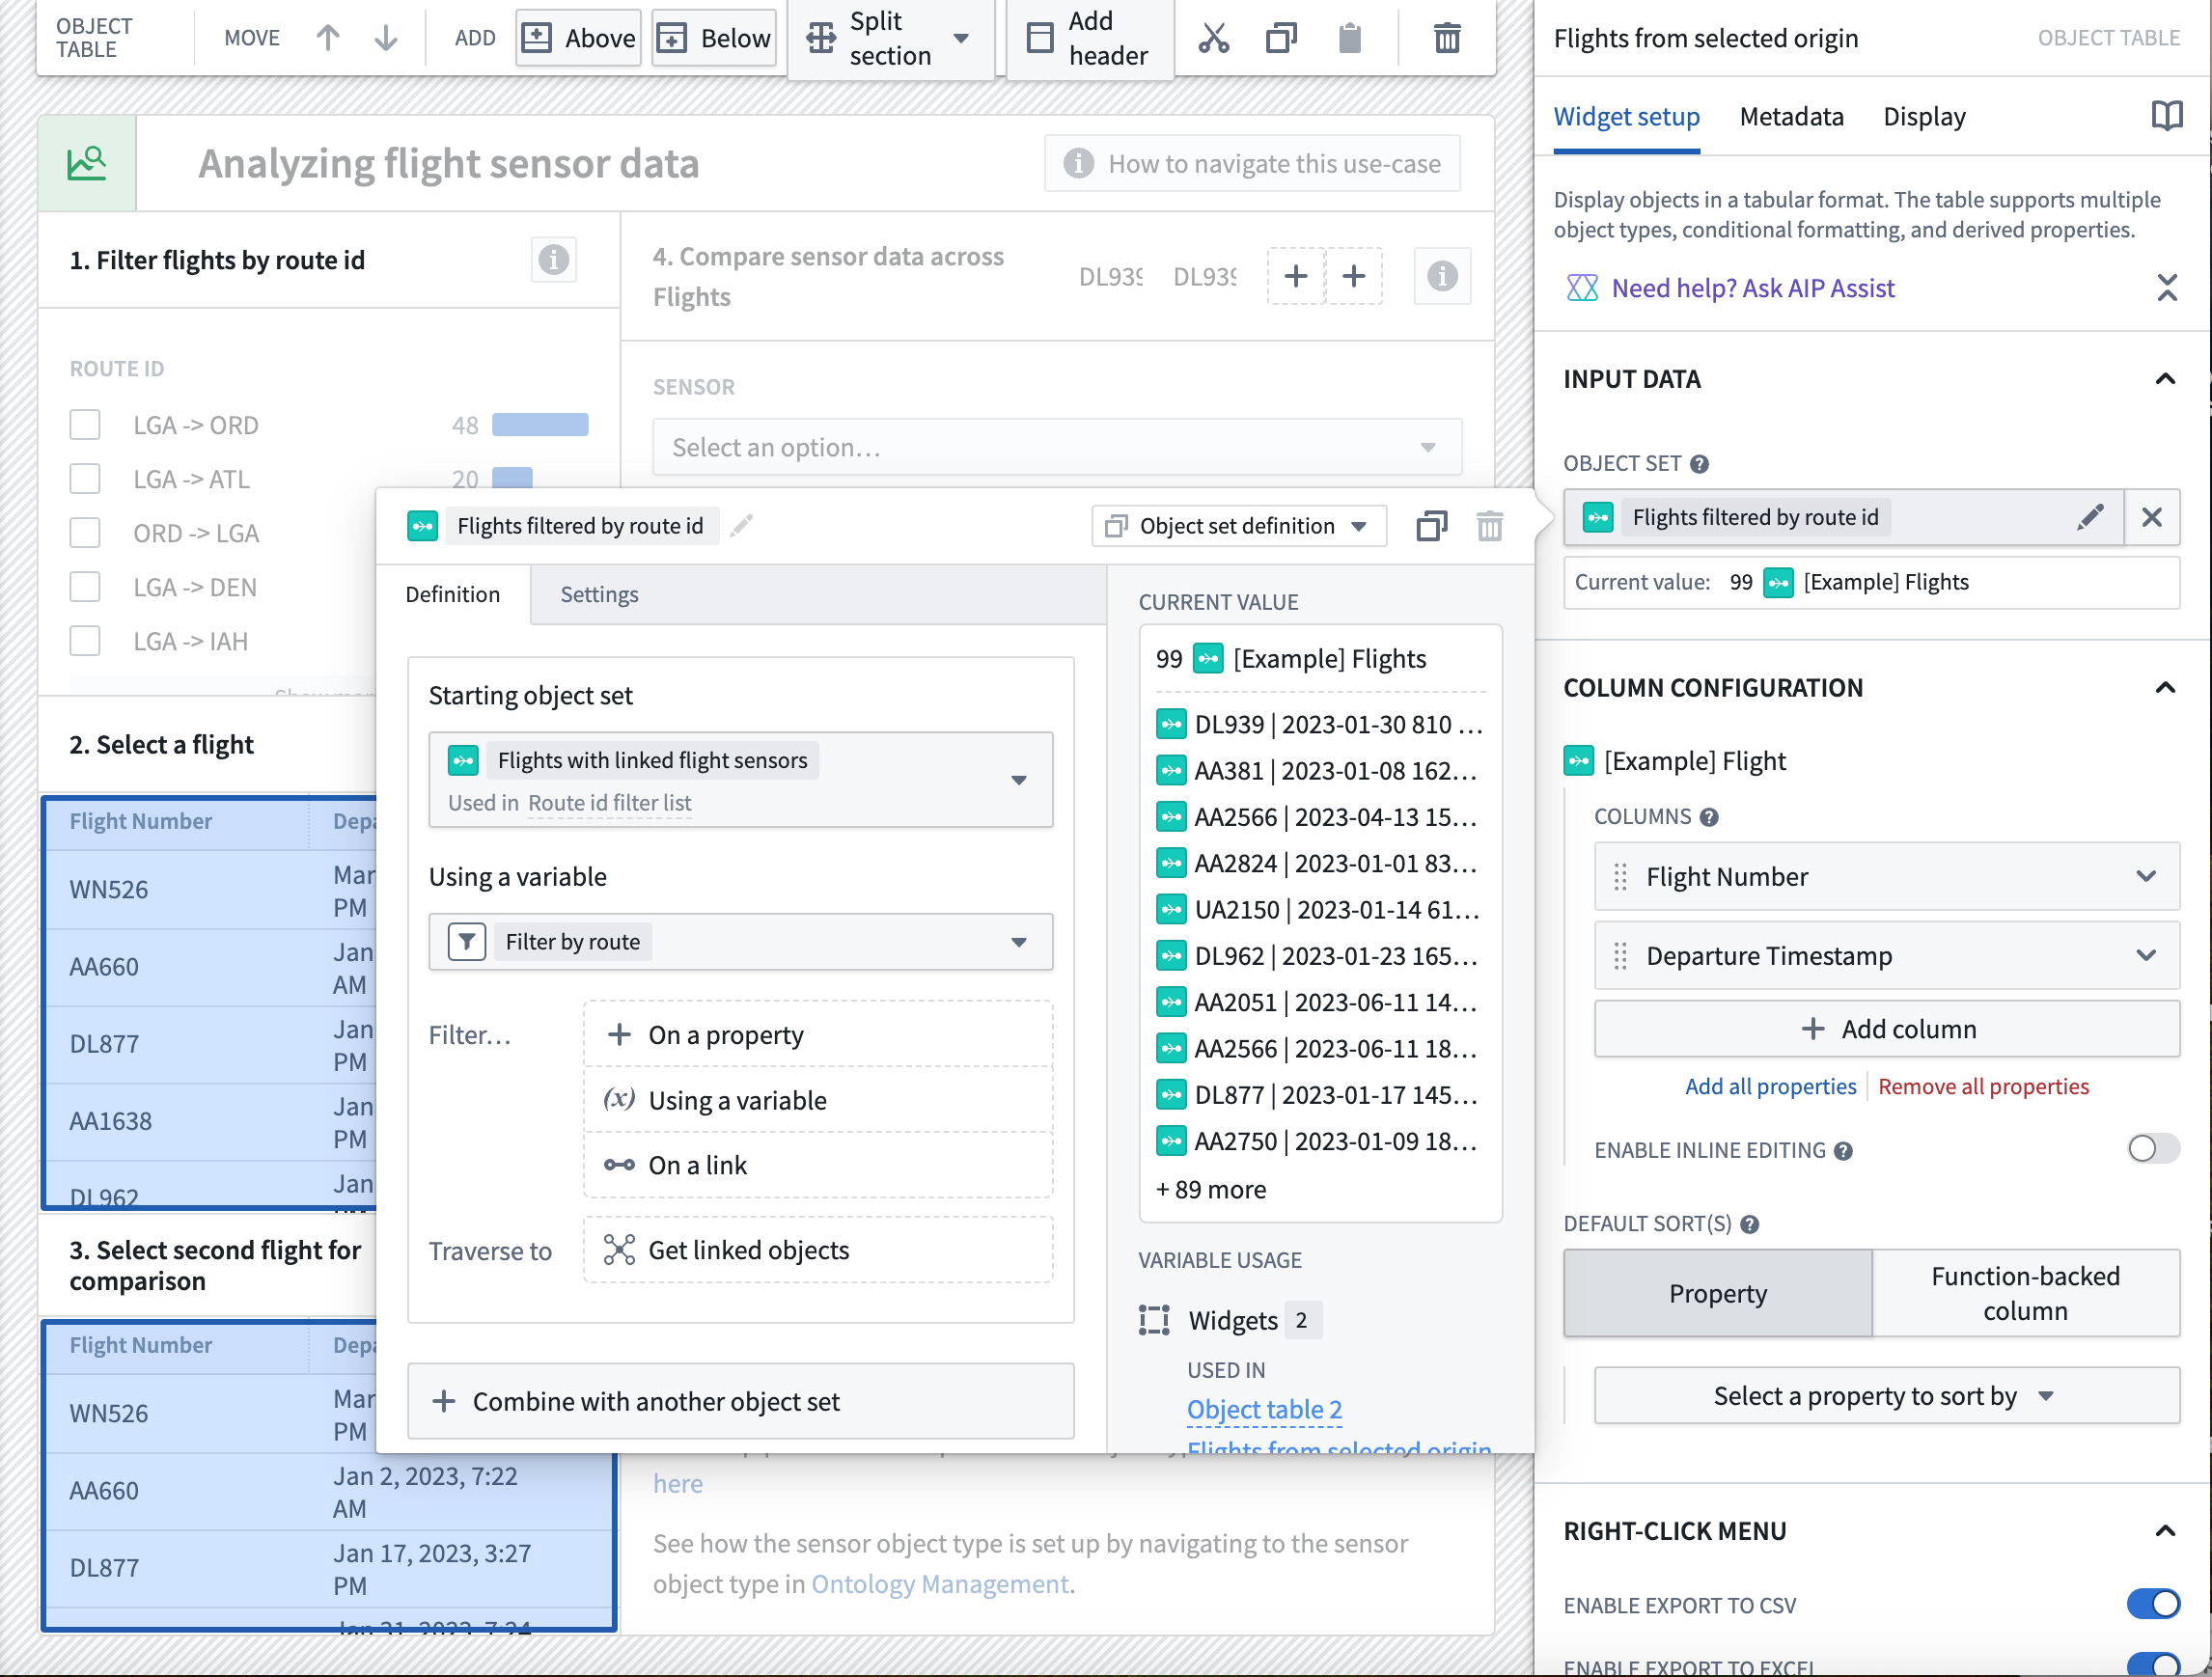
- Select + Add column, then Departure timestamp from the dropdown menu.
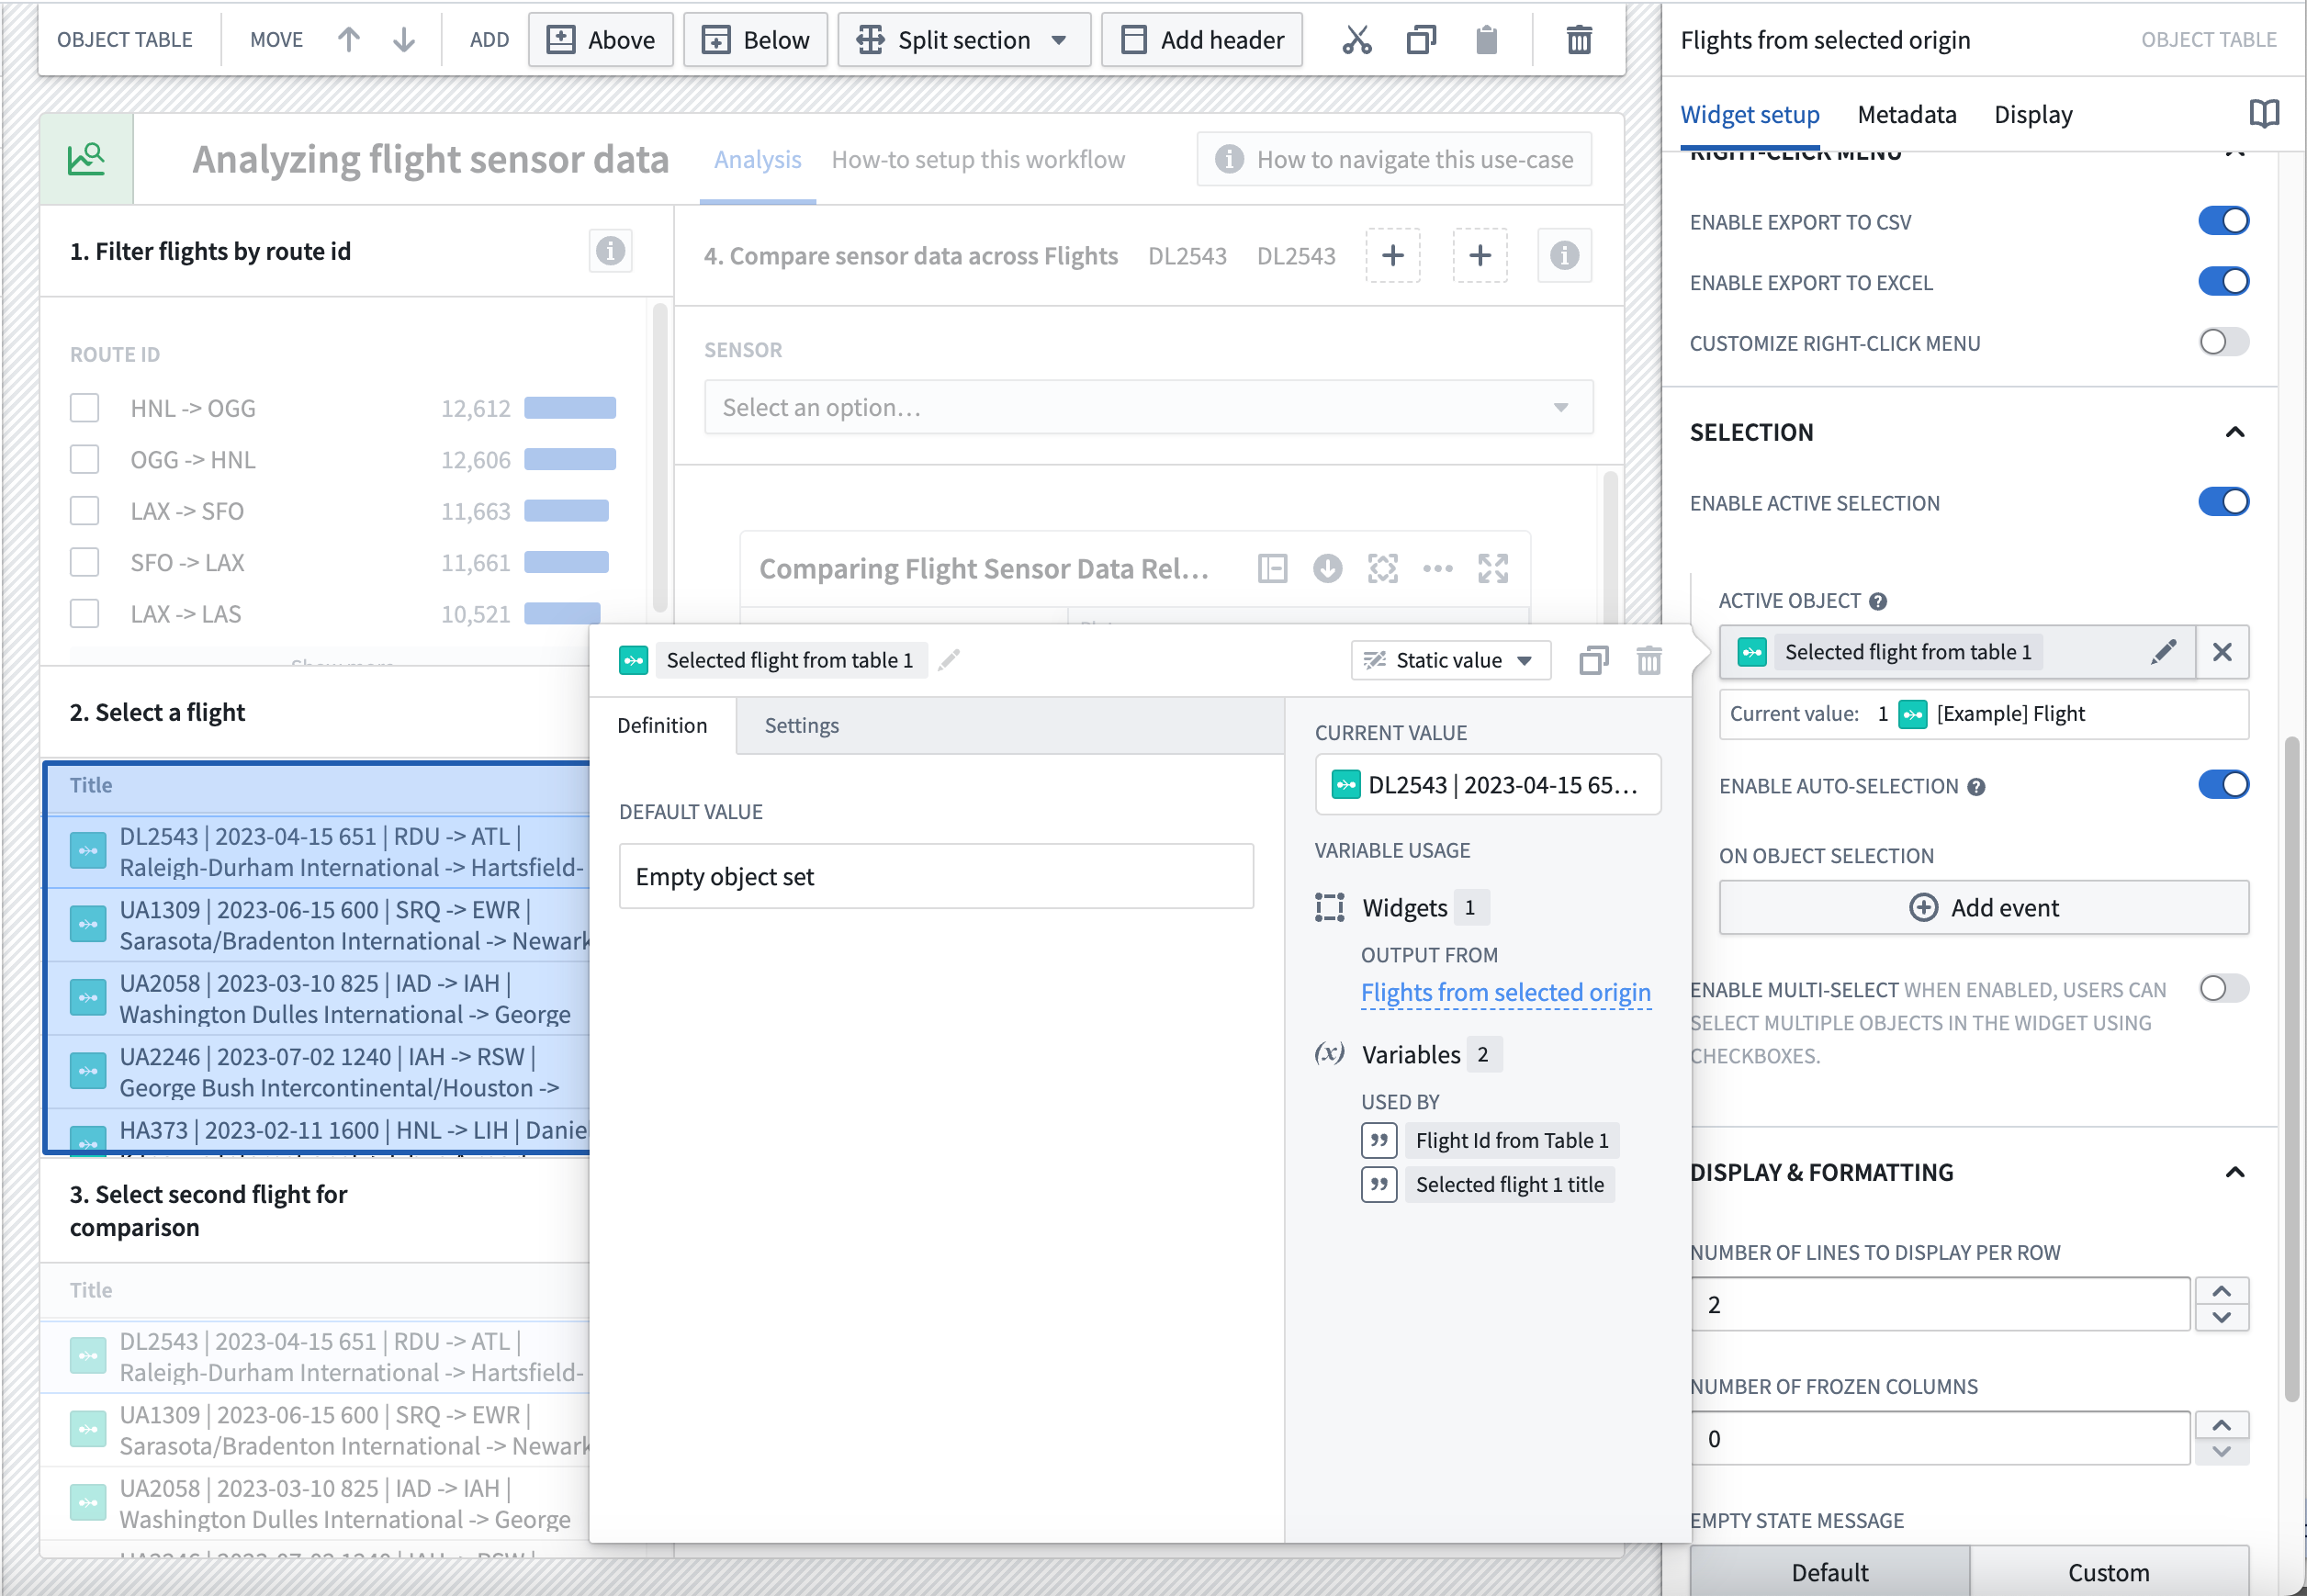
- Scroll down to the Selection section and toggle on the Enable active selection option. This will configure an output of the selected object of the table.
- Create a new variable from the Active object dropdown menu by selecting New object set variable. Rename the variable
Selected flight from table 1. No other configuration is needed.
- Repeat this process for a second table widget that takes in the
Flights filtered by route idyou created in steps 3-5 and create an output variable calledSelected flight from table 2.
Part II: Add sensor object type time series data from a root object type
Create sensor name selector
Create a dropdown menu of desired series names to pass into the Quiver dashboard that you will create in later steps.
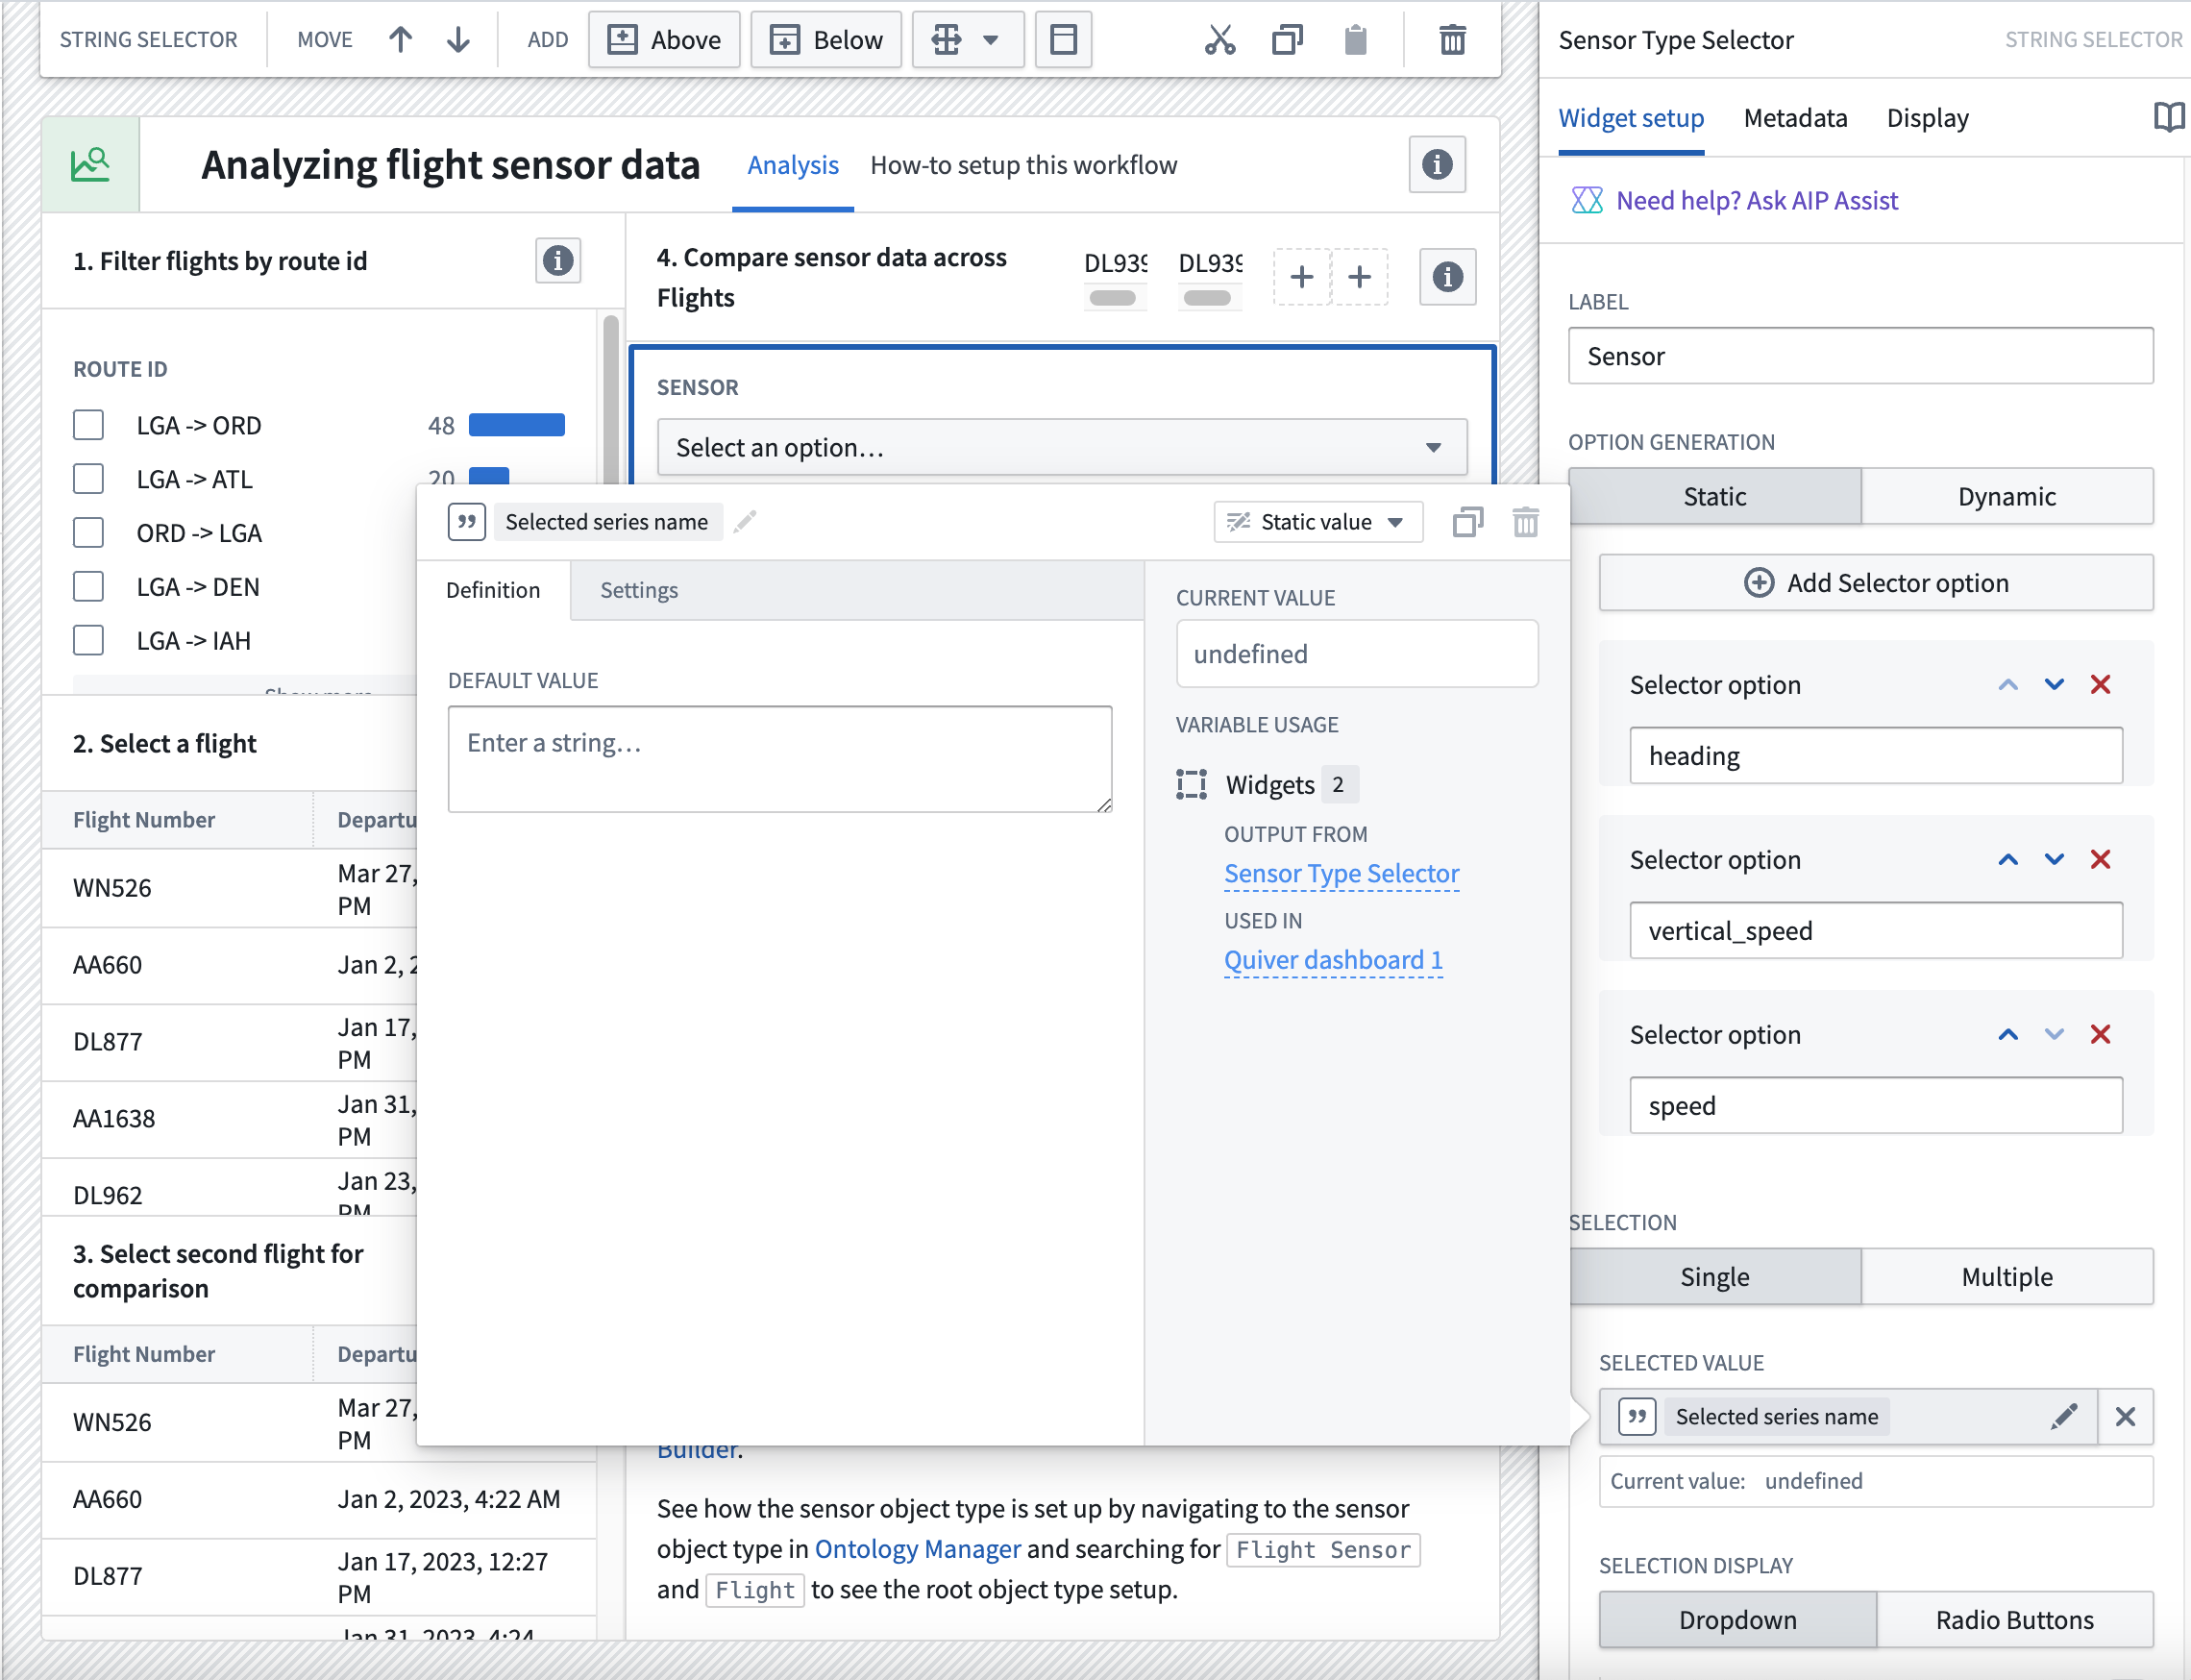
- In your Workshop module, choose to + Add widget, then select the String Selector widget.
- In the widget configuration panel under Option Generation, select + Add Selector option
- Add options for
heading,vertical_speed,speedand any other sensor name that you would like to display.
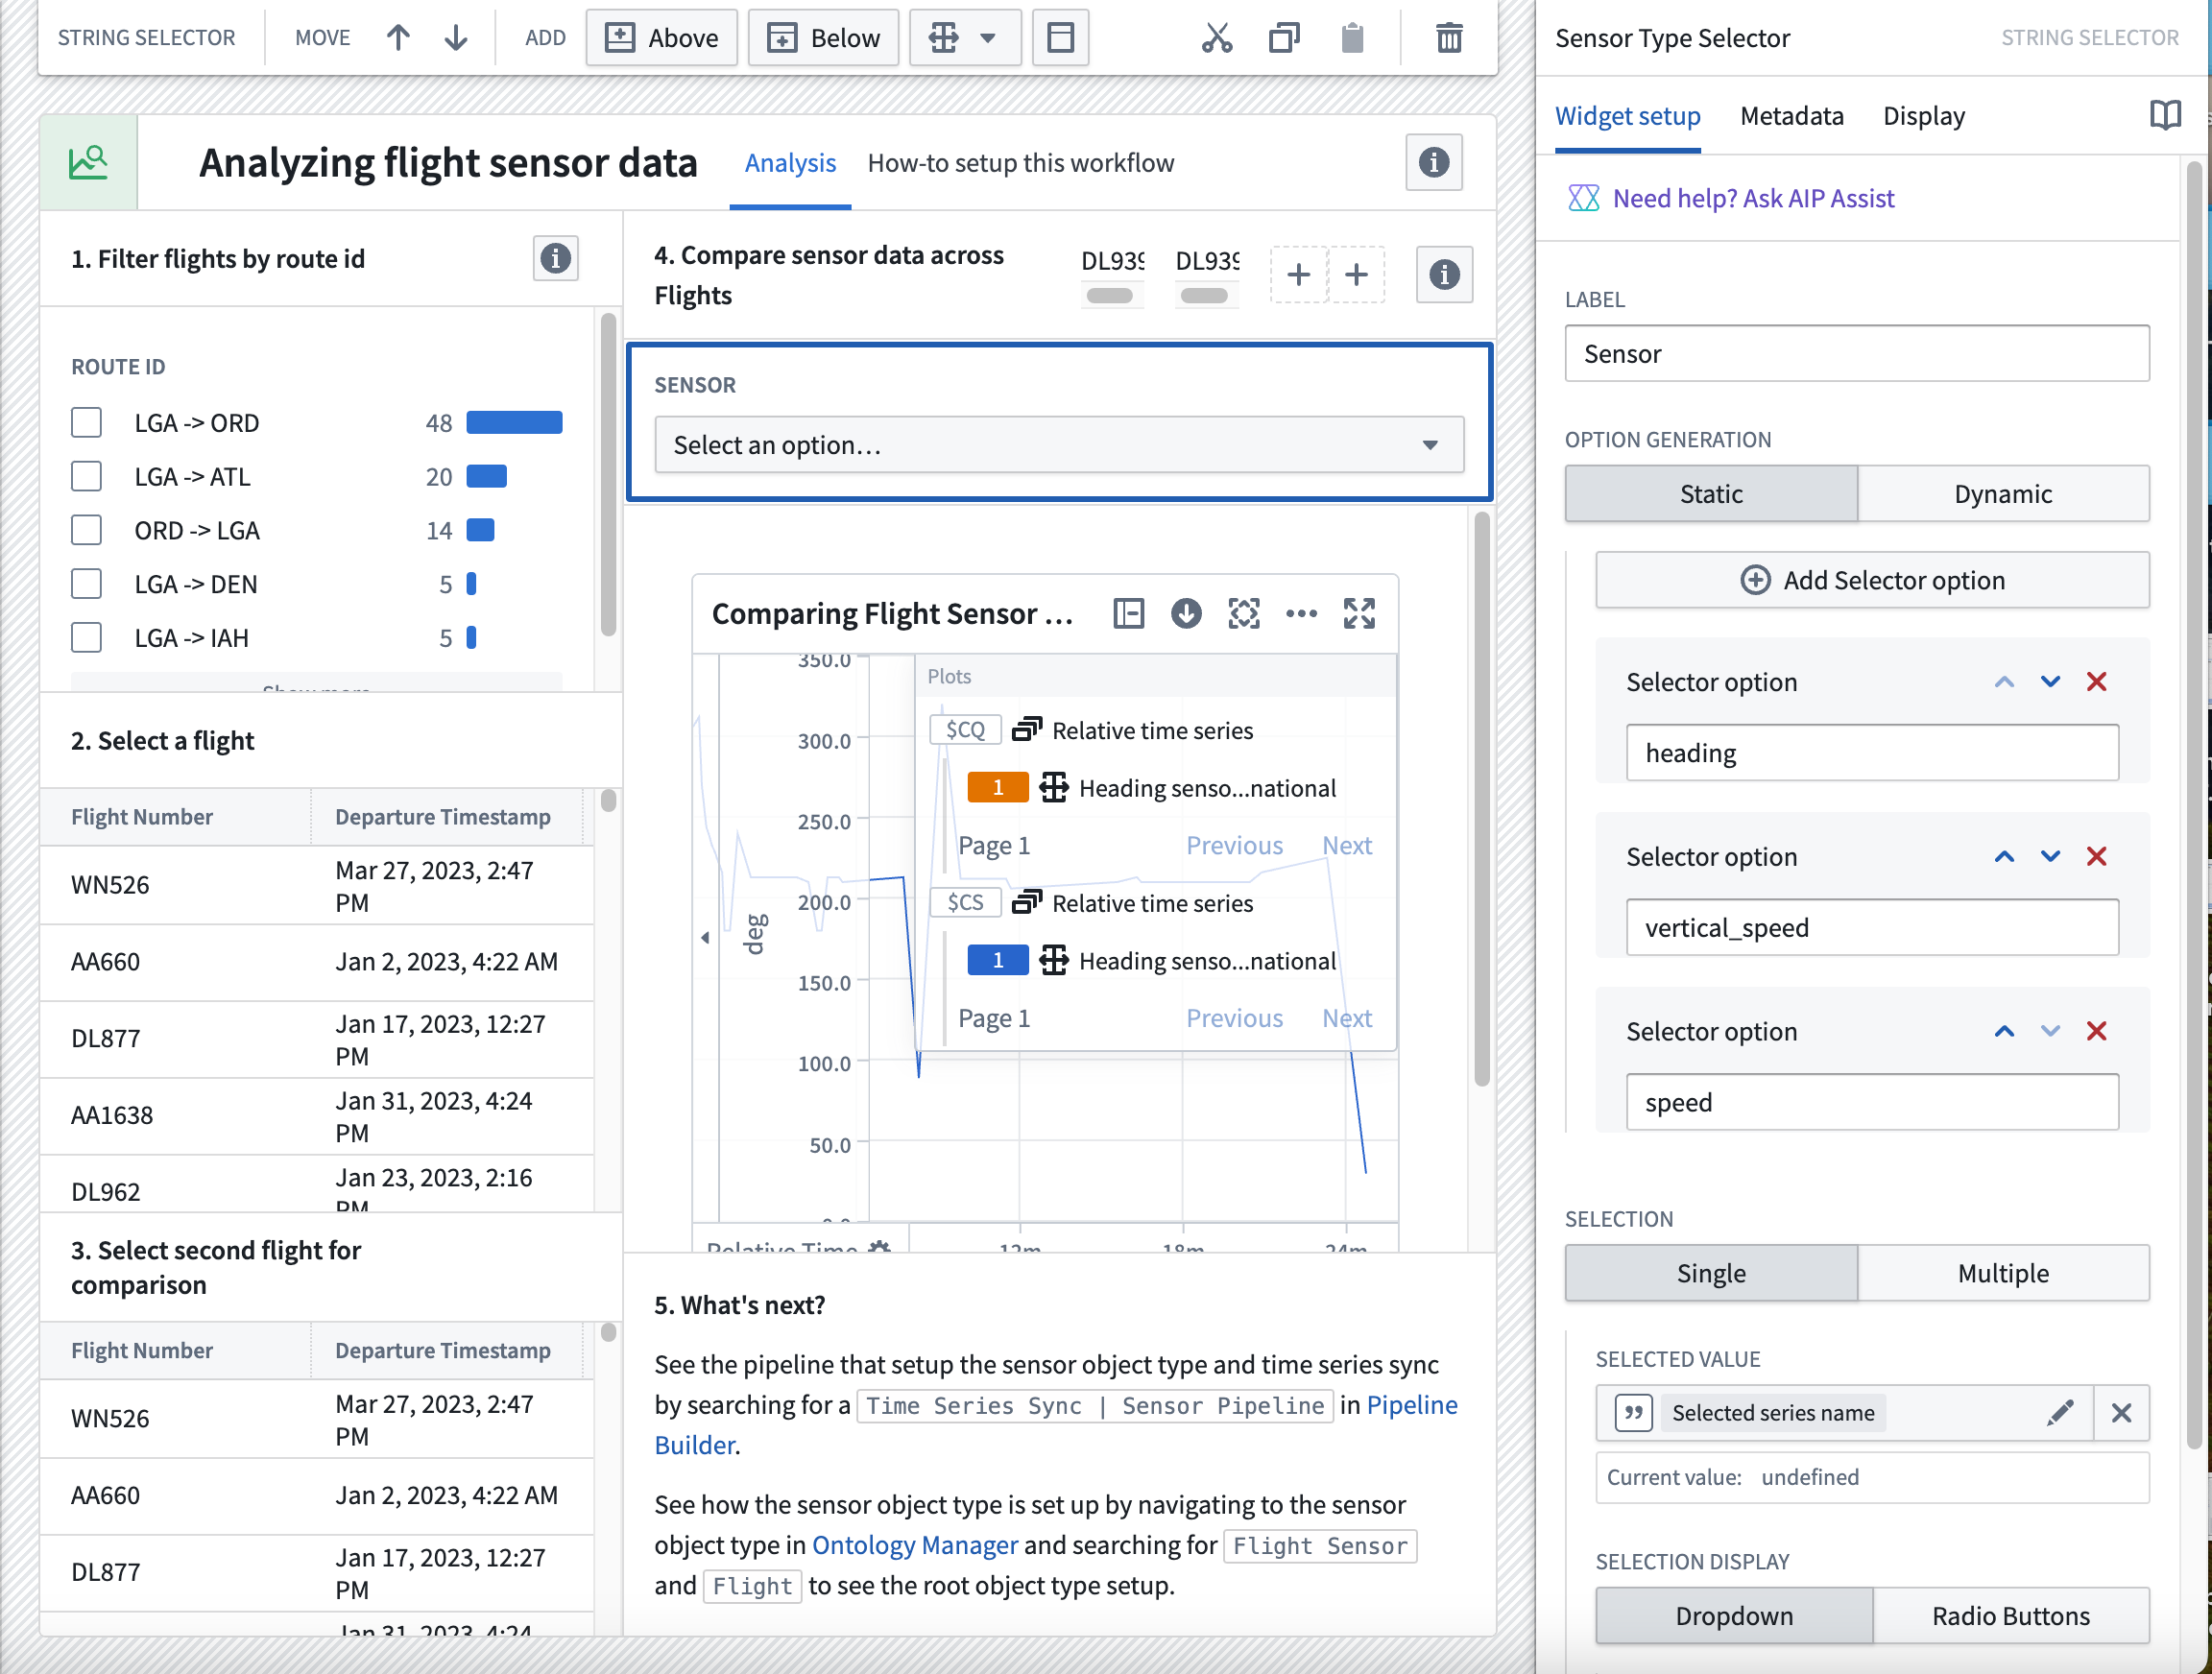
- In the Selection section dropdown menu, choose the
Selected series namevariable. - Keep the default Dropdown option for the Selection Display configuration.
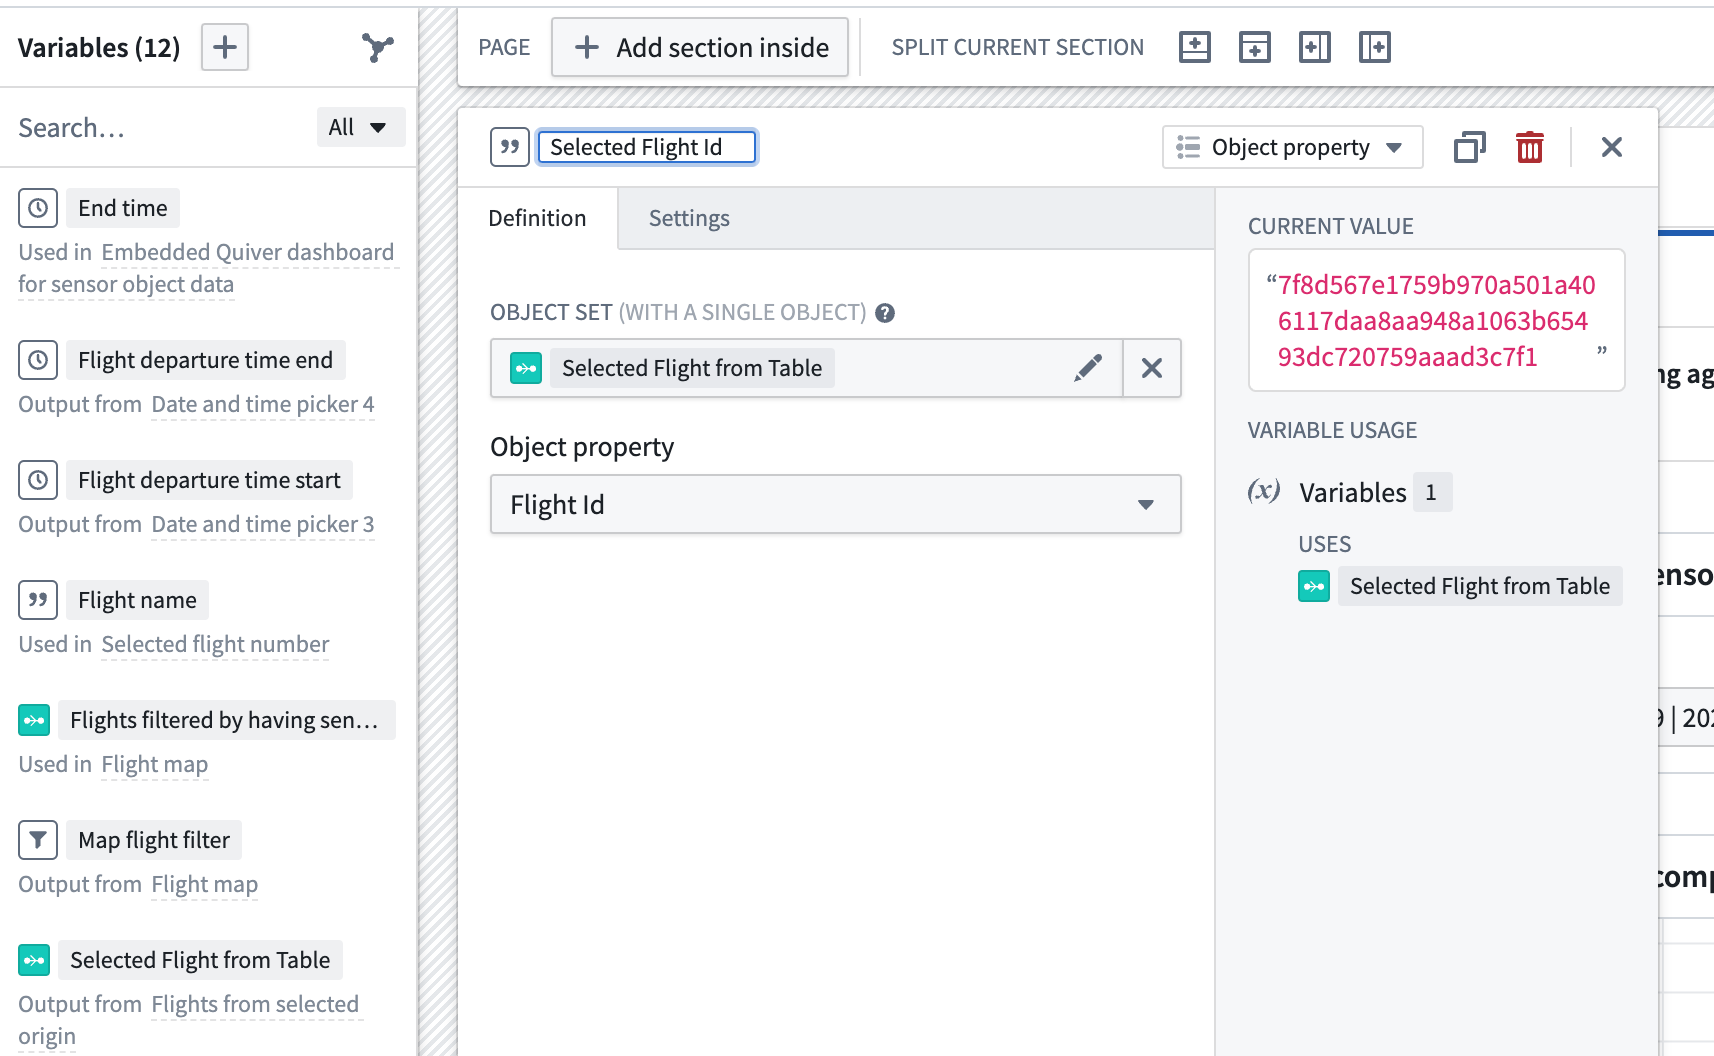
Create flight ID variables
Now, you will create two variables representing the flight IDs of the flights selected from both the left and right tables. Each variable is a string backed by the Flight Id property from both the Selected flight from table 1 and Selected flight from table 2 variables configured in the Object Table widgets. You will pass these variables into the Quiver dashboard.
- Navigate to the Variables from the left side of the Workshop module, and select + to add a new variable.
- From the dropdown menu, select String.
- From the next dropdown menu, select Object property.
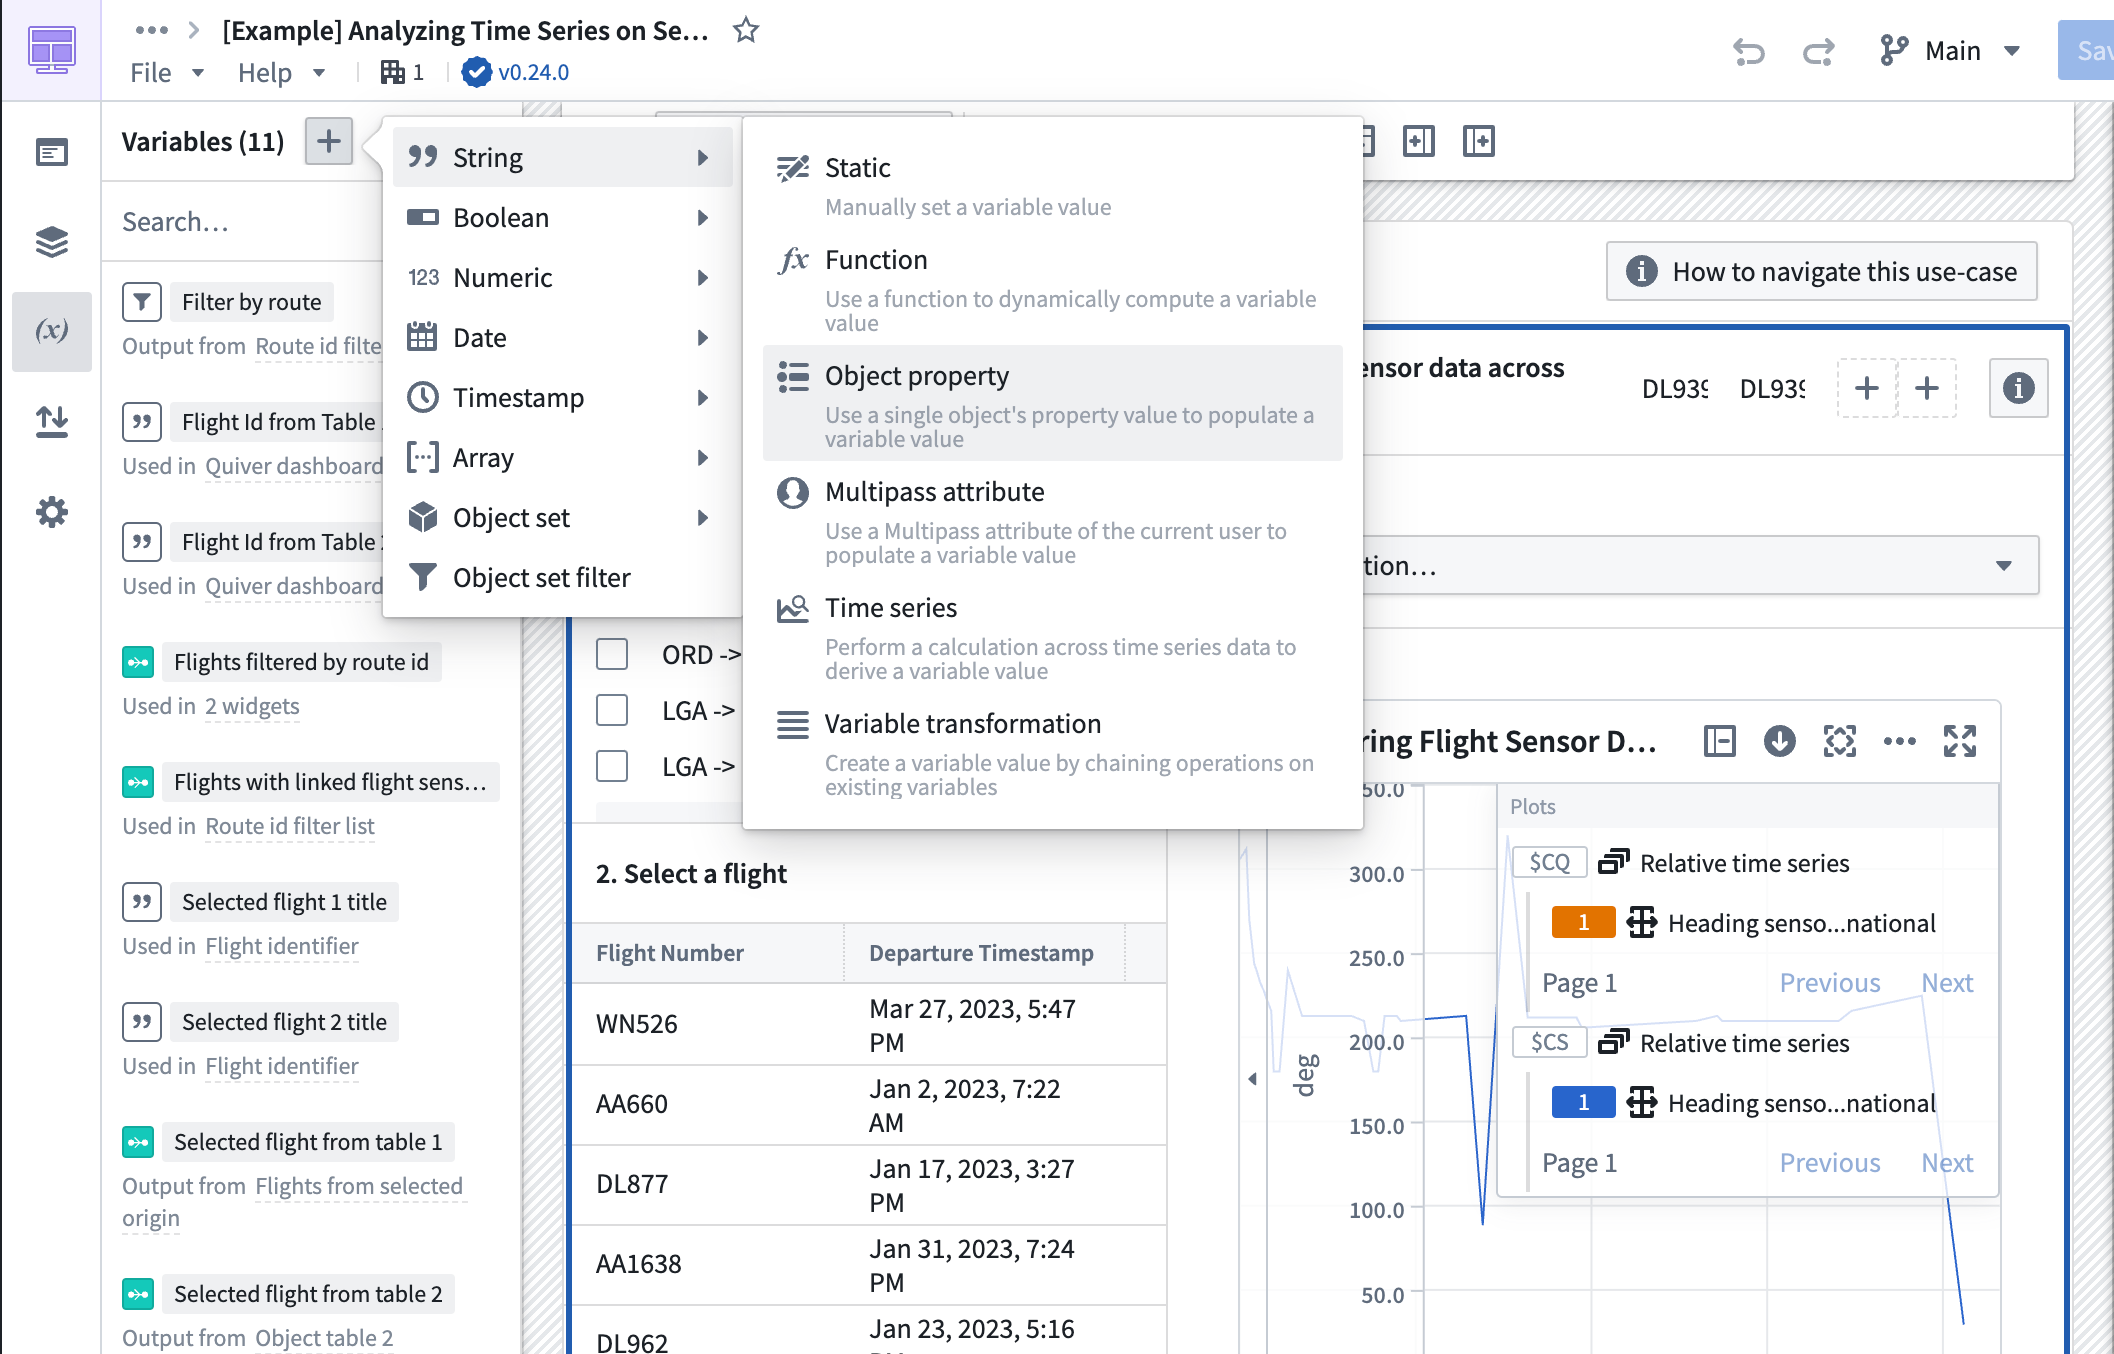
- Choose the
Selected Flight from Tablevariable as the object set with a single option, then theFlight Idas the property for theSelected Flight Idvariable.
Part III: Create a Quiver dashboard
The following guidances assumes a basic knowledge of navigating Quiver. To learn more about general Quiver functionality, review our documentation.
This Workshop module contains an embedded Quiver dashboard. Follow the instructions below to set up the time series chart and metric card shown in the dashboard.
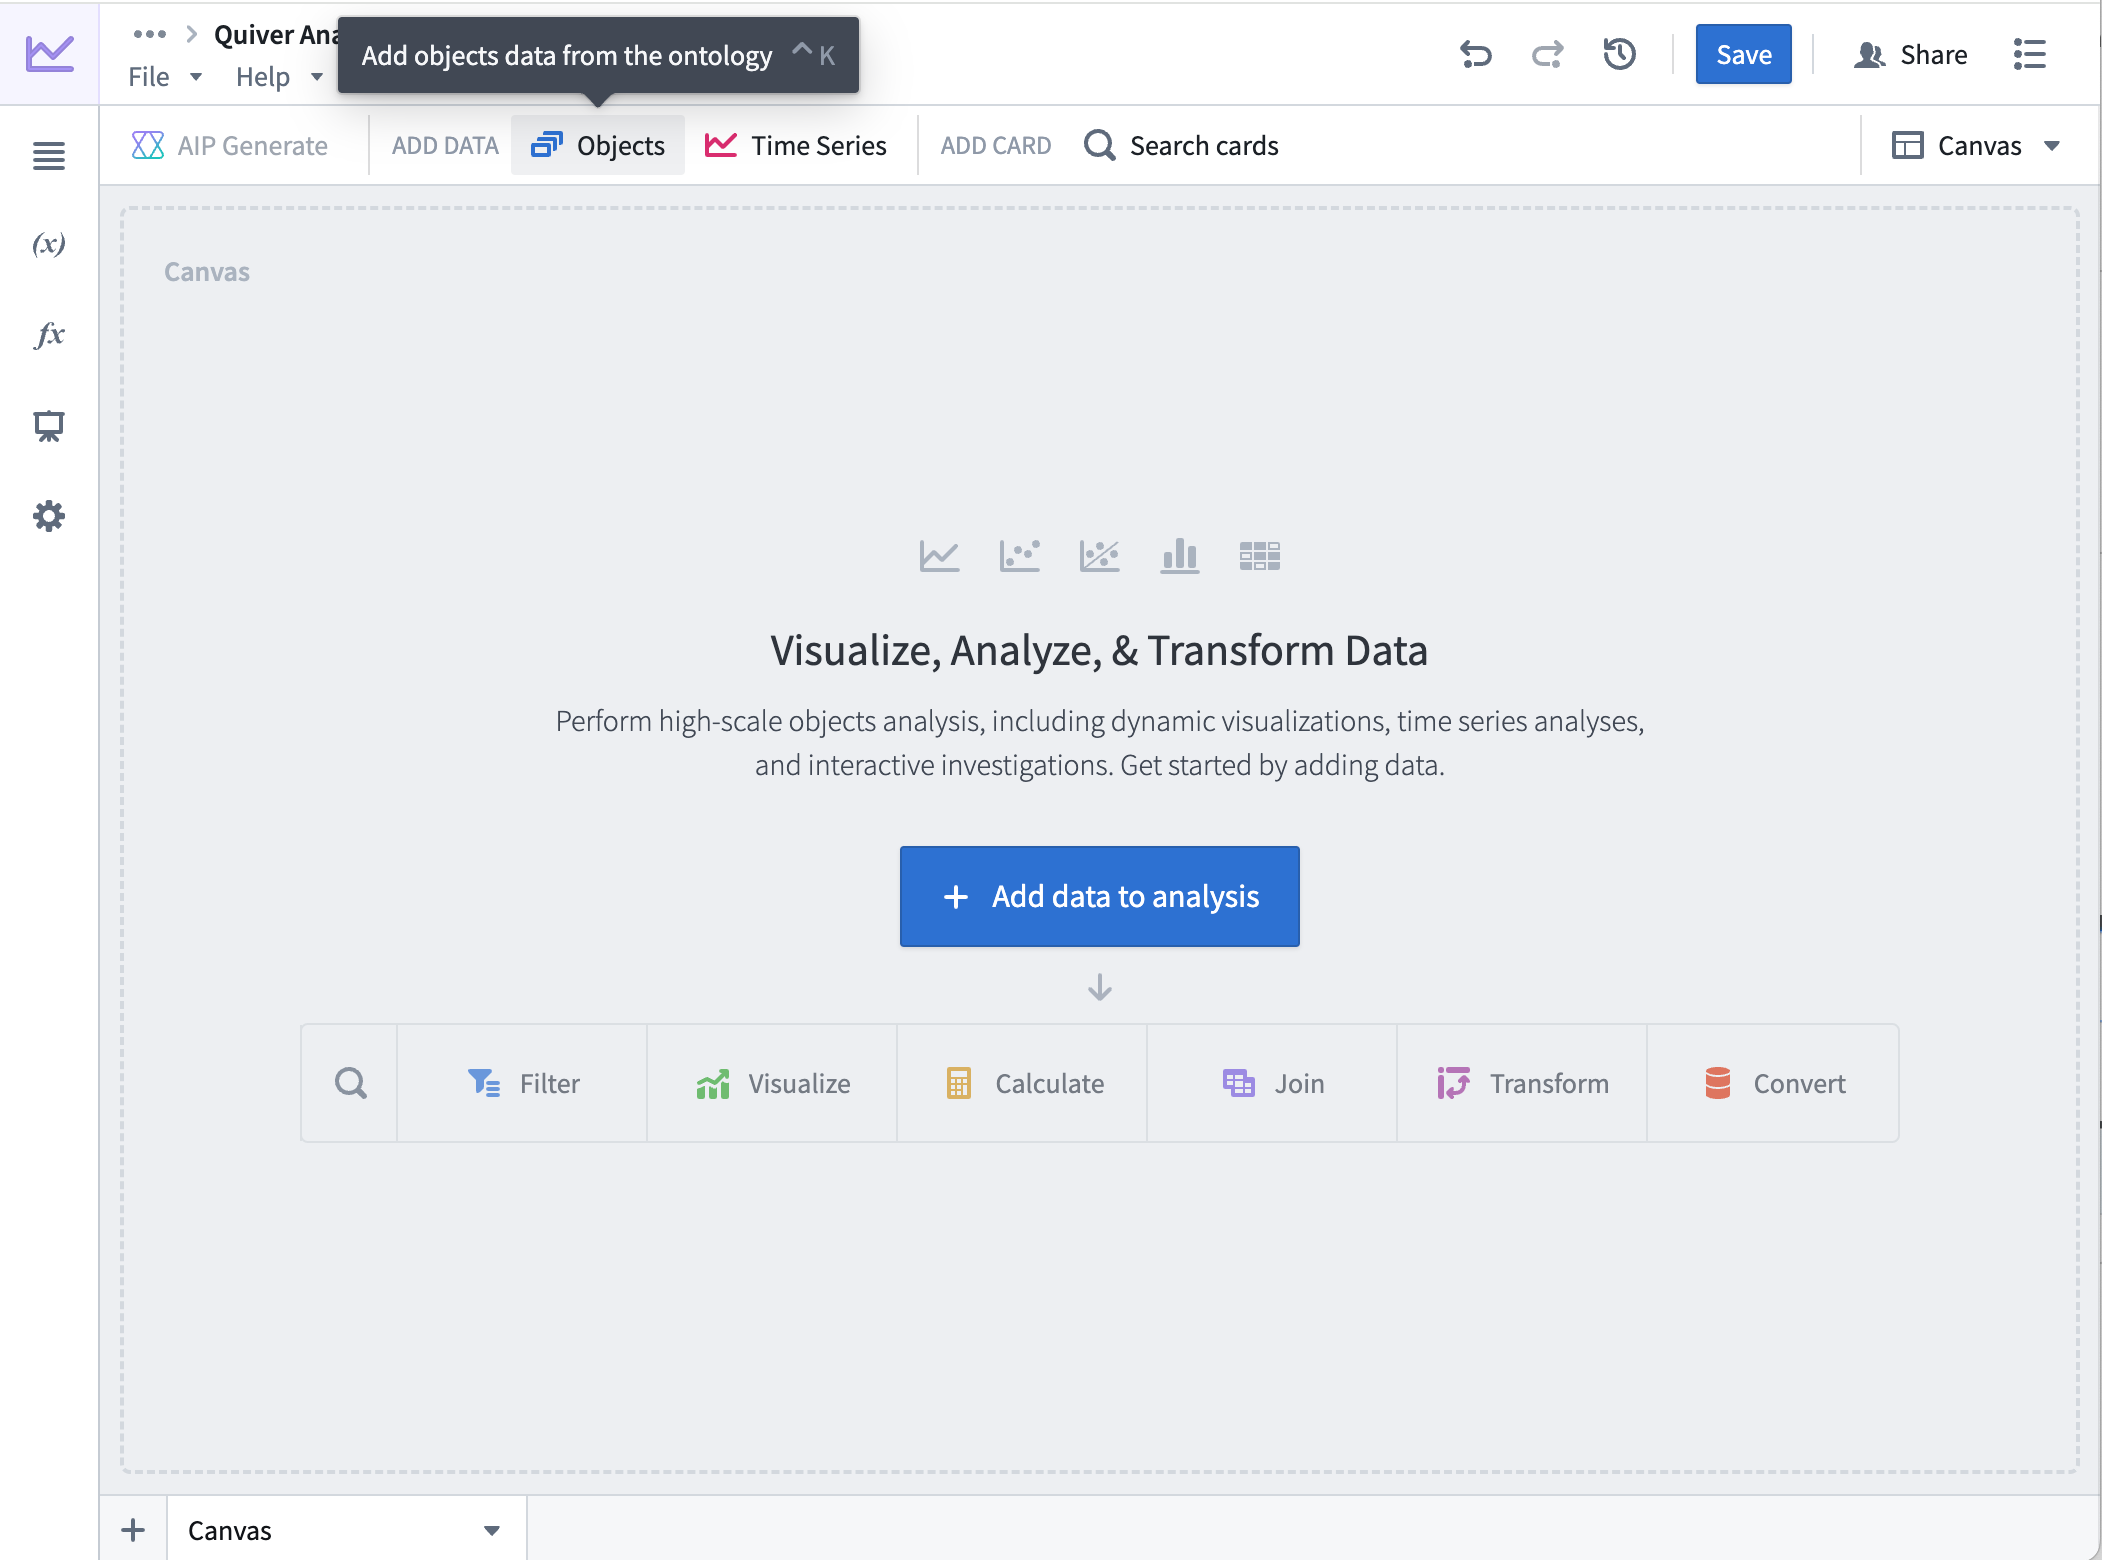
1. Create a Quiver analysis using the Flight Sensor object type
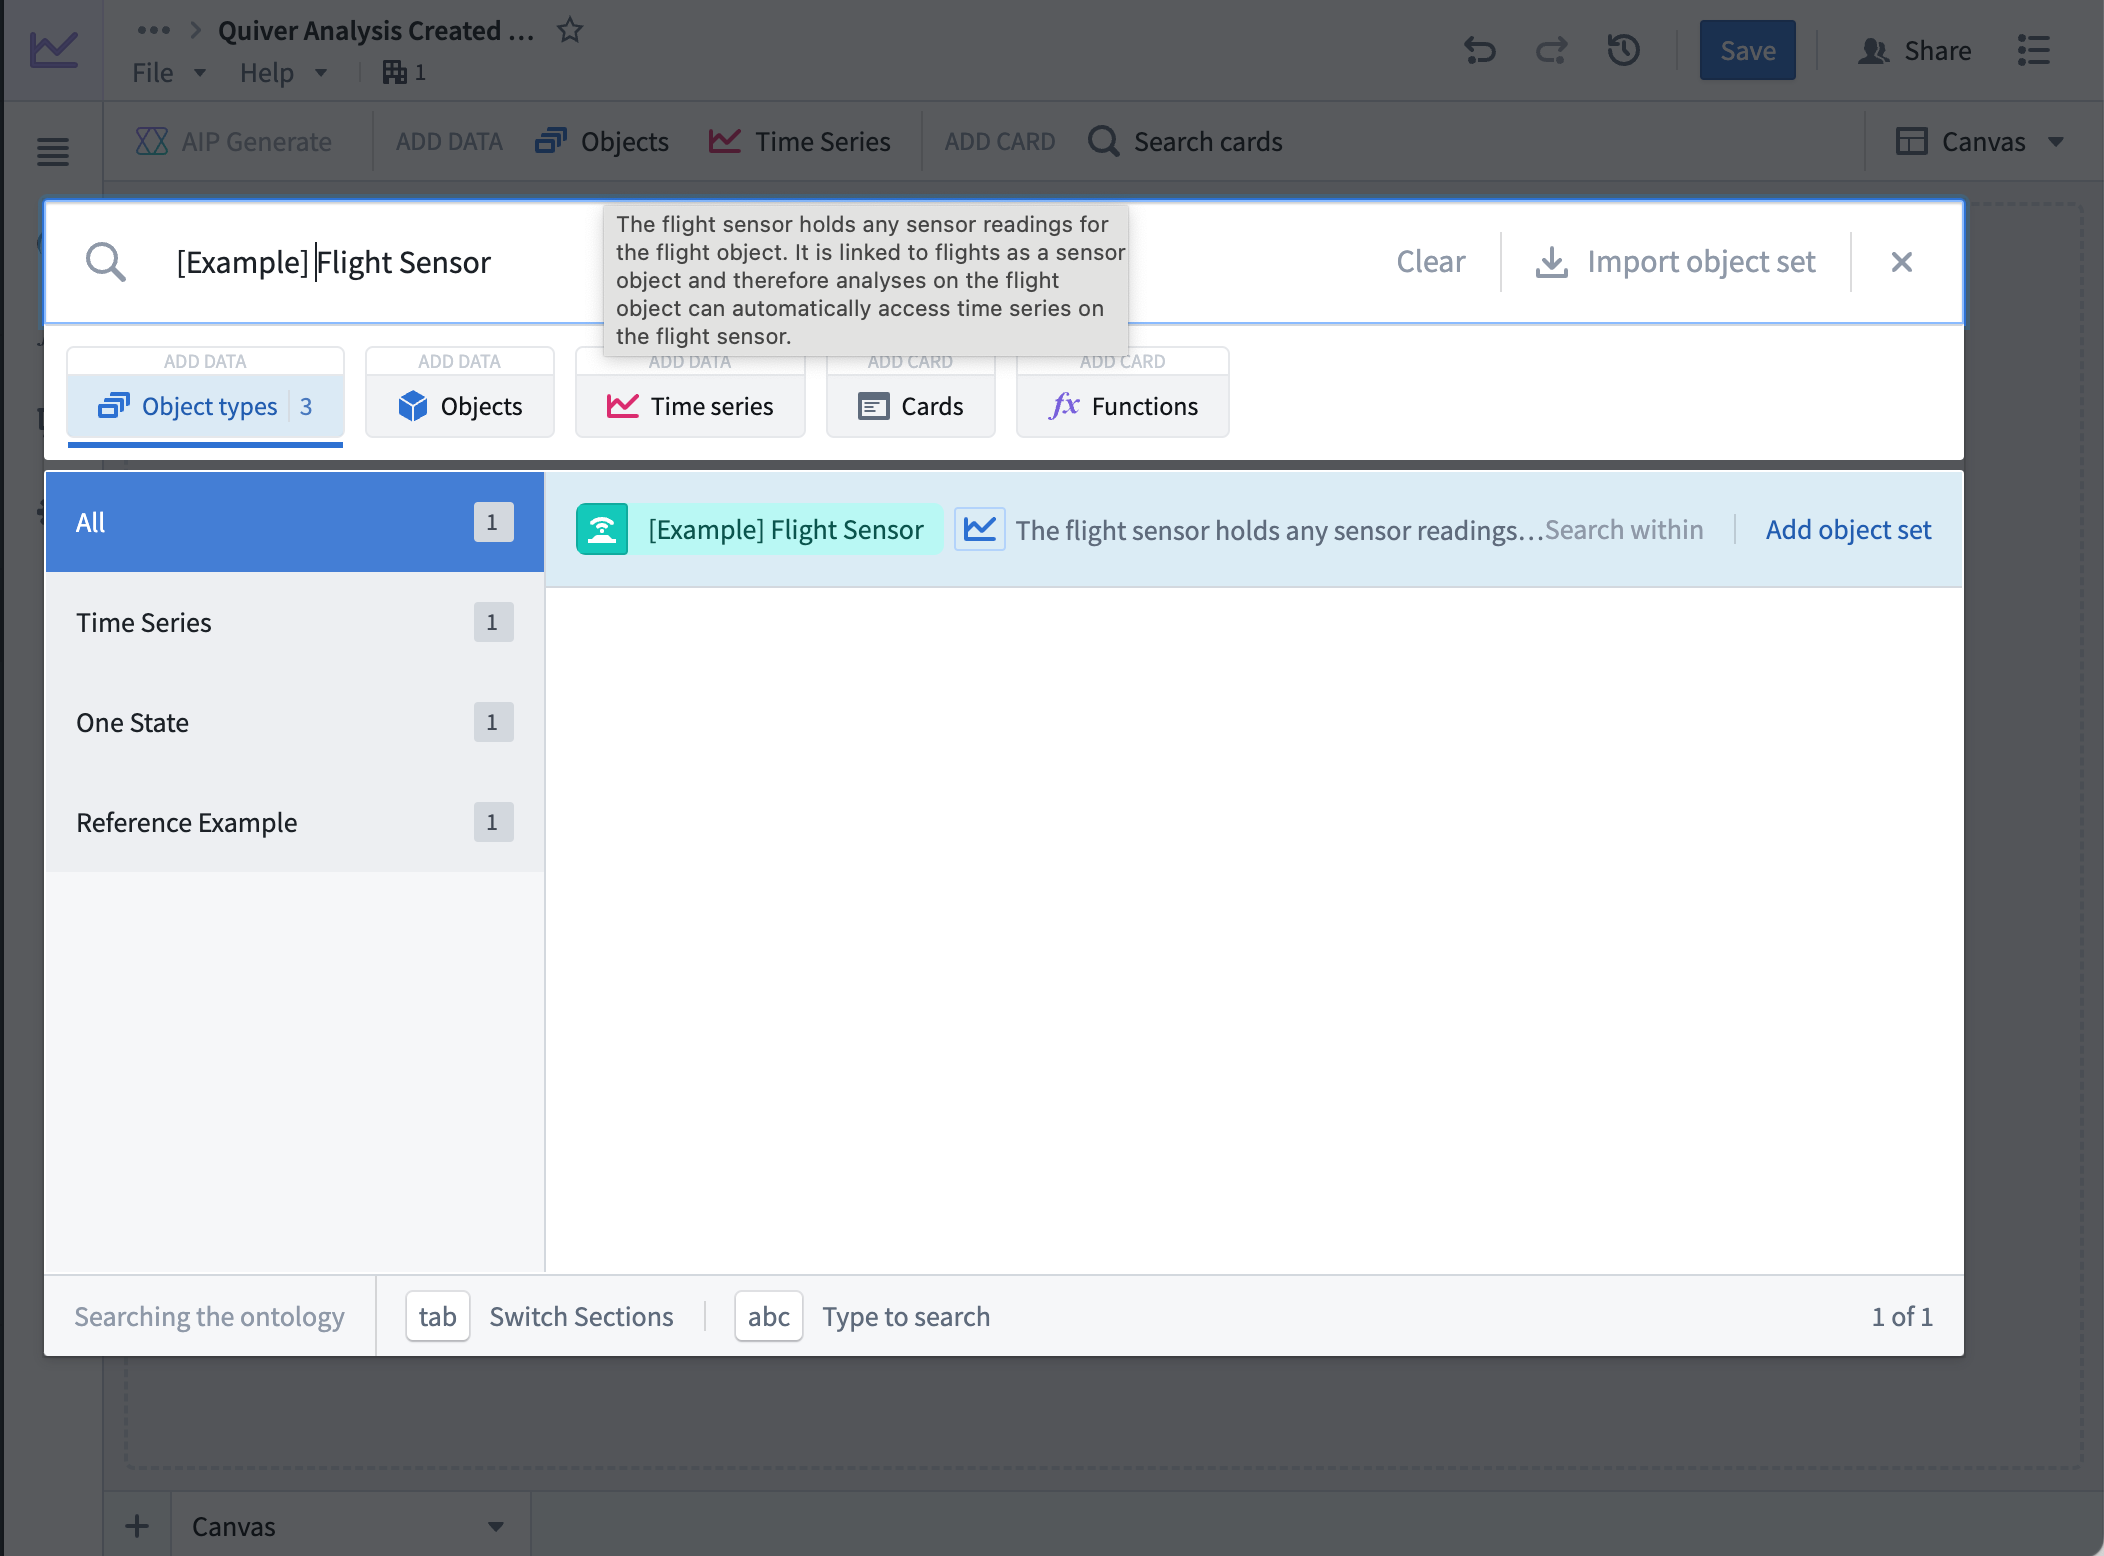
Use the Flight Sensor object set
Create a new Quiver analysis with the Flight Sensor object type set by selecting Objects from the top menu bar and searching for Flight Sensor object type. Select Add object set to add the object set table to the canvas.
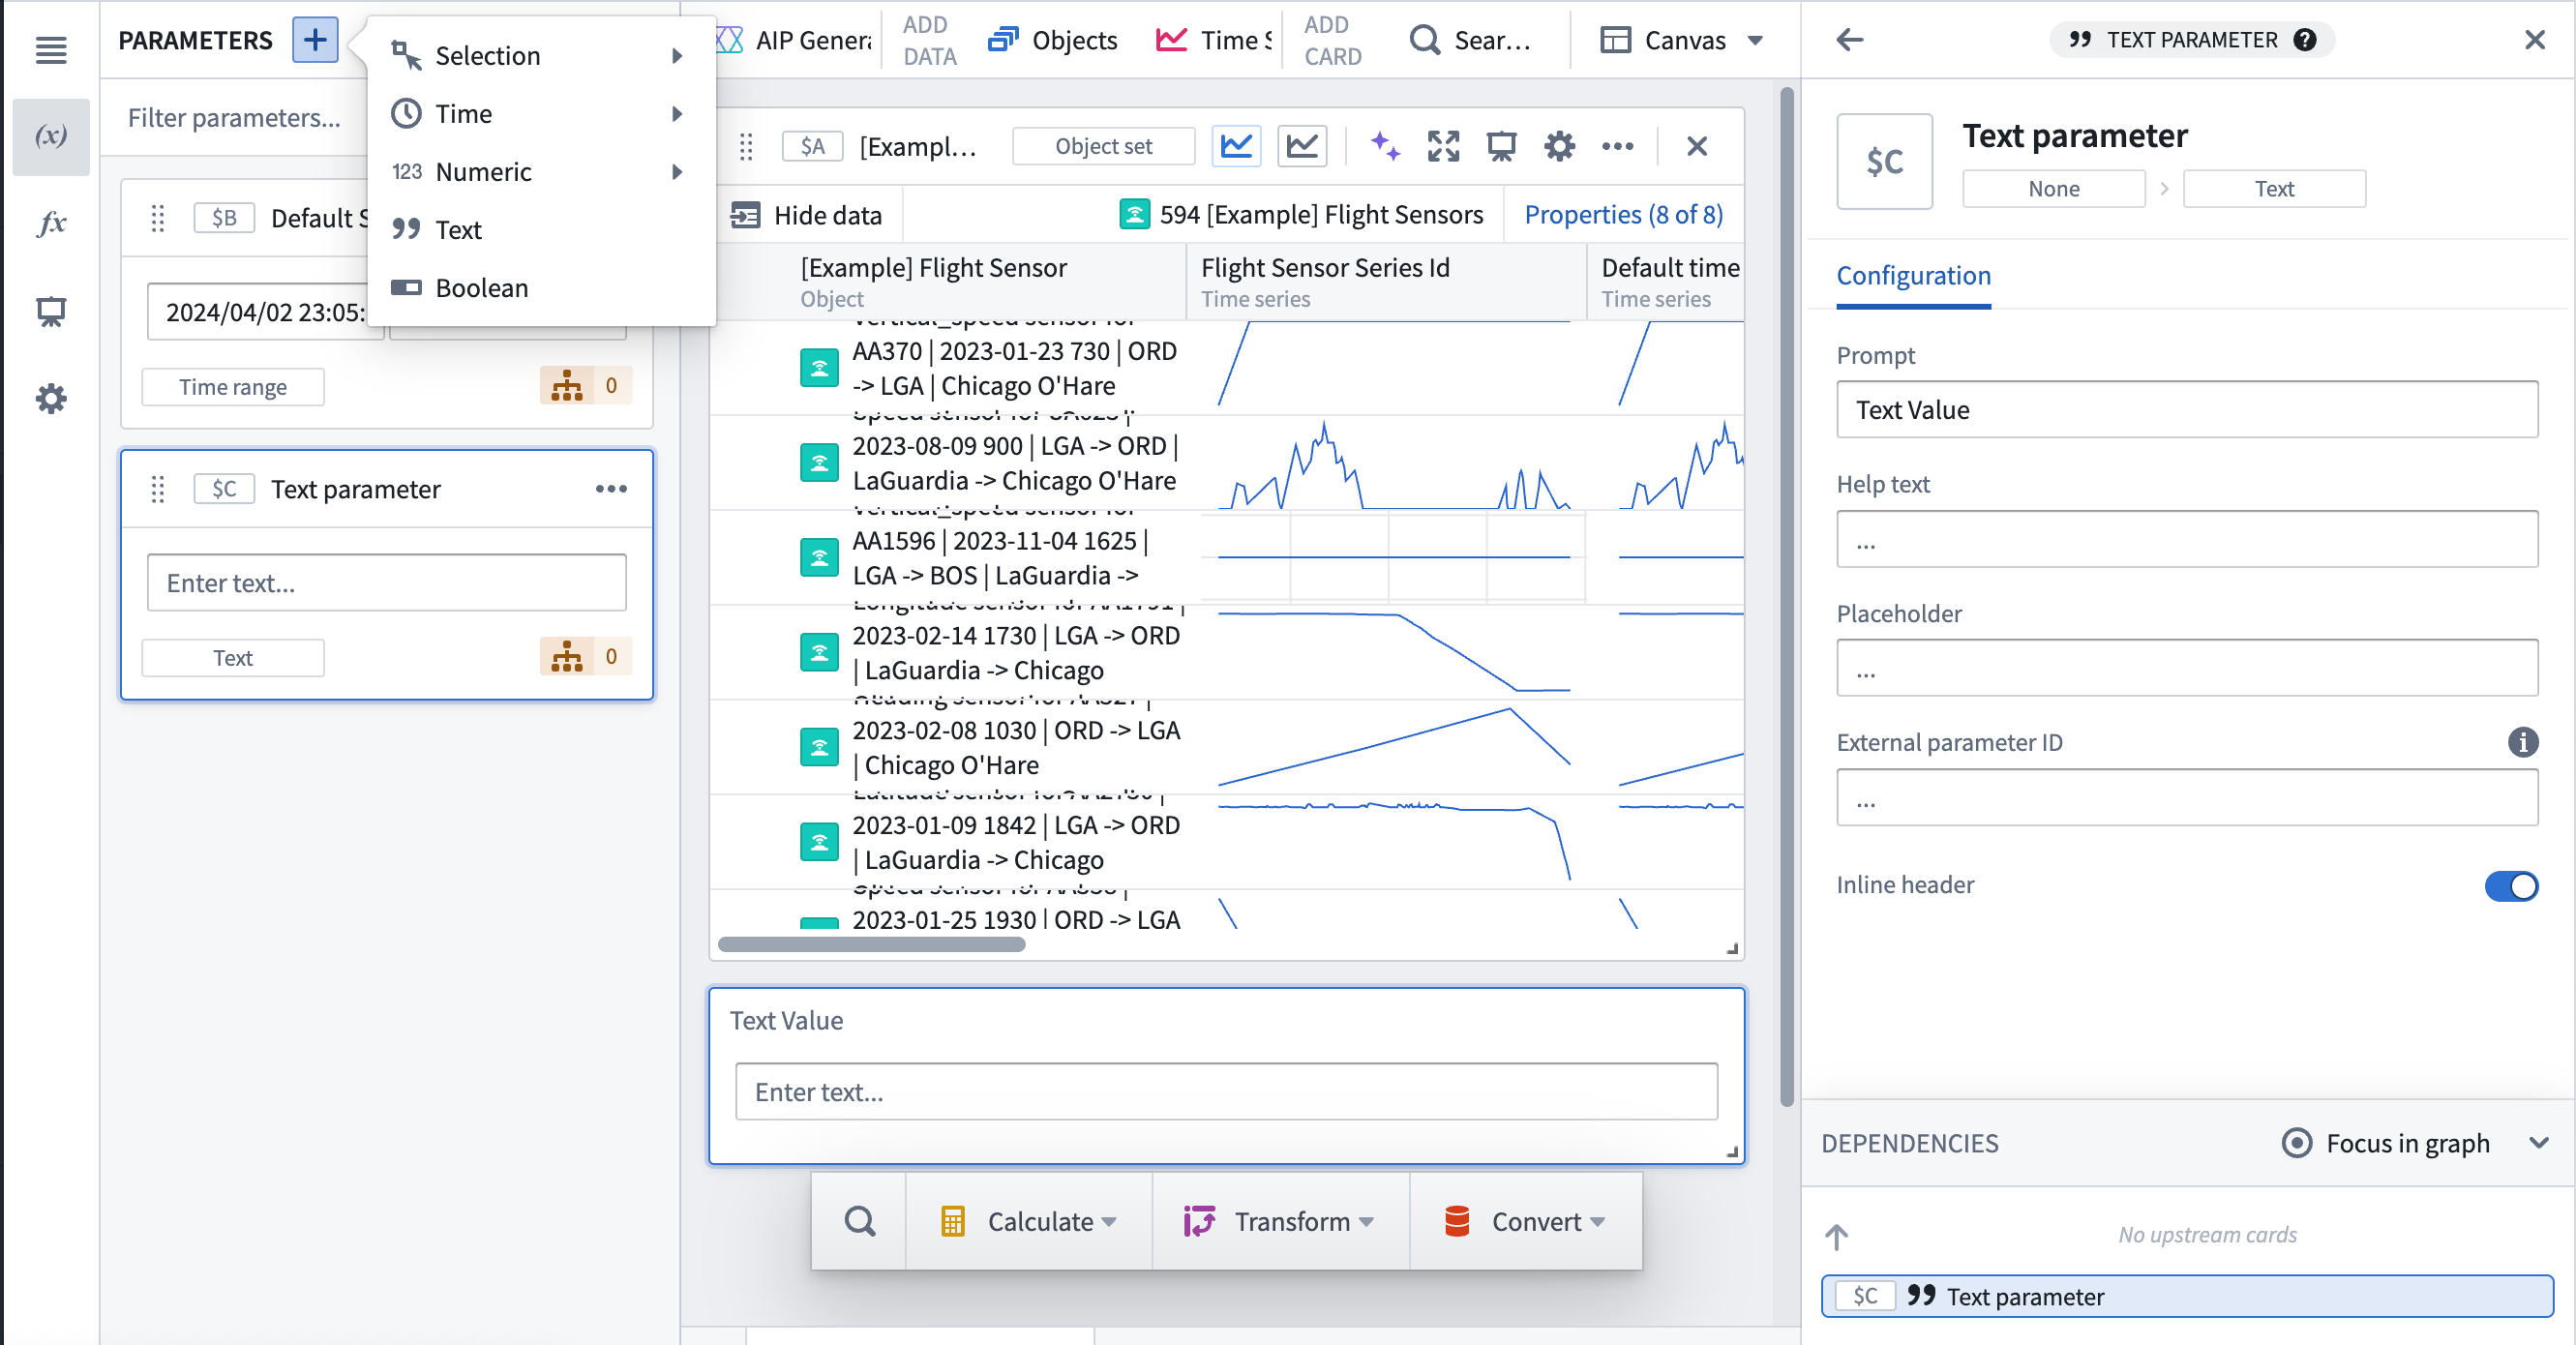
Add two string parameters for the flight IDs
- From the left side of the screen, select the (x) to open the Parameters configuration.
- Select + to add a parameter, then select String from the dropdown menu. The string parameter will represent the flight ID, and you will retrieve
Flight Sensorobjects with thatflight_idproperty. - Rename the string parameter to "Flight Id" for easier tracking.
- Repeat steps 1-3 for the second flight ID, and label it "Flight Id 2".
Add a string parameter for the sensor name
- Navigate to the left side of the screen.
- Select + to add a parameter, then select String from the dropdown menu. The string parameter will represent the sensor name, and you will filter the
Flight Sensorobjects matching the sensor name passed in from the Workshop module. - Rename the string parameter to "Sensor name" for easier tracking.
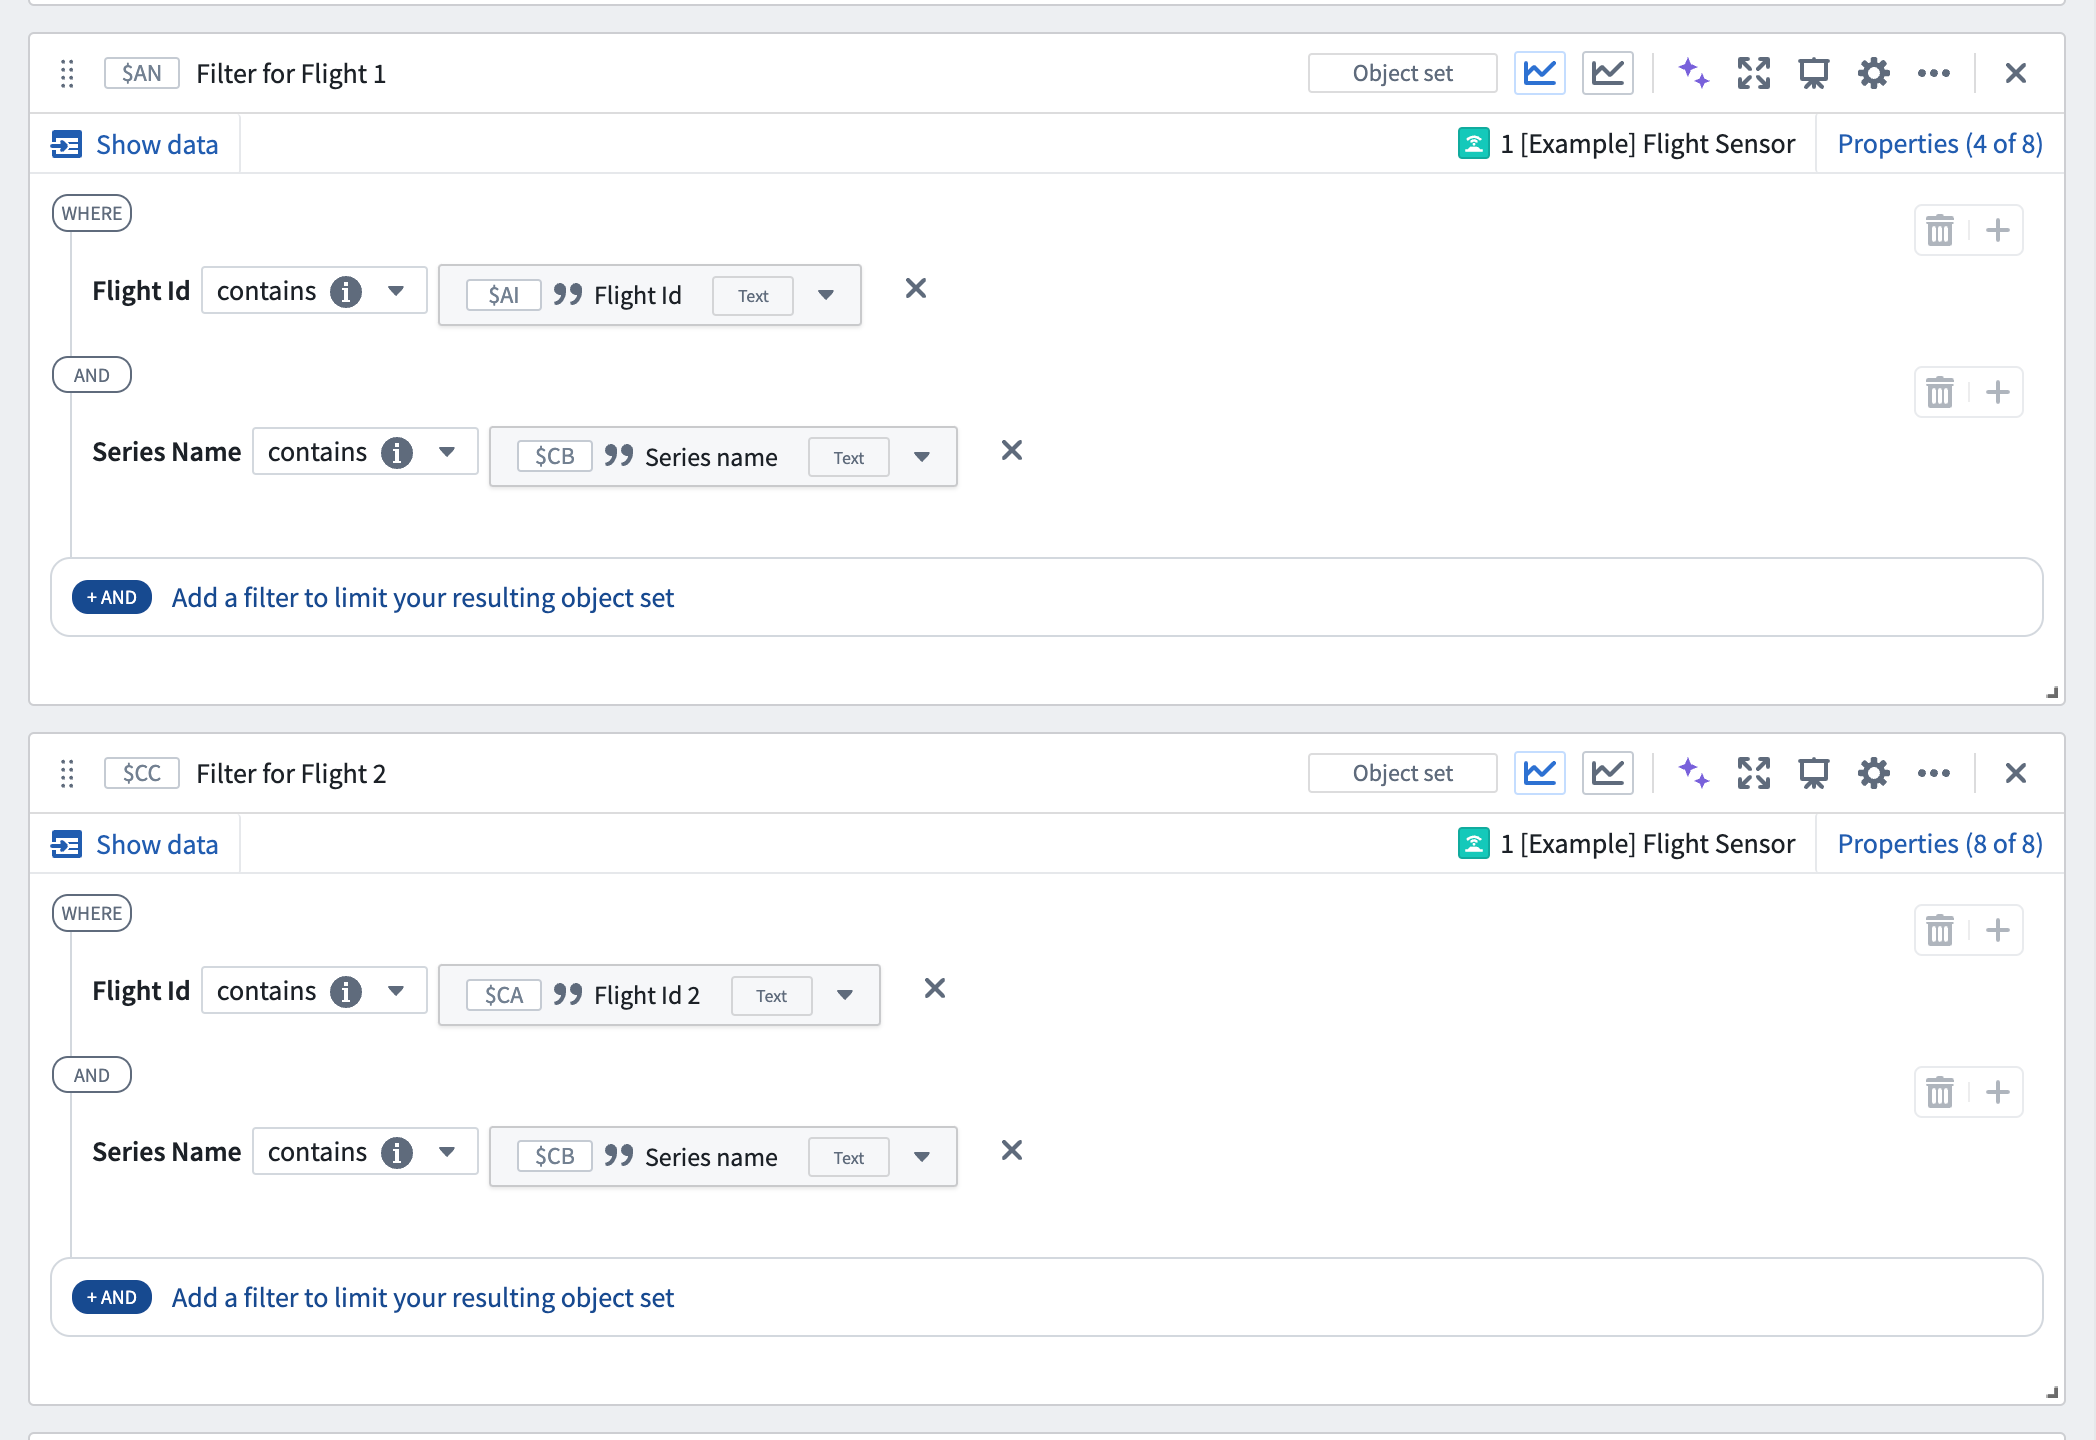
Add object set filters for all parameters
- Hover over the
Flight Sensorobject set table to show the Search menu, or select Search cards to add a filter object set card. This card will filter the sensor objects by the selectedflight id. Review our object set filters documentation for more information.
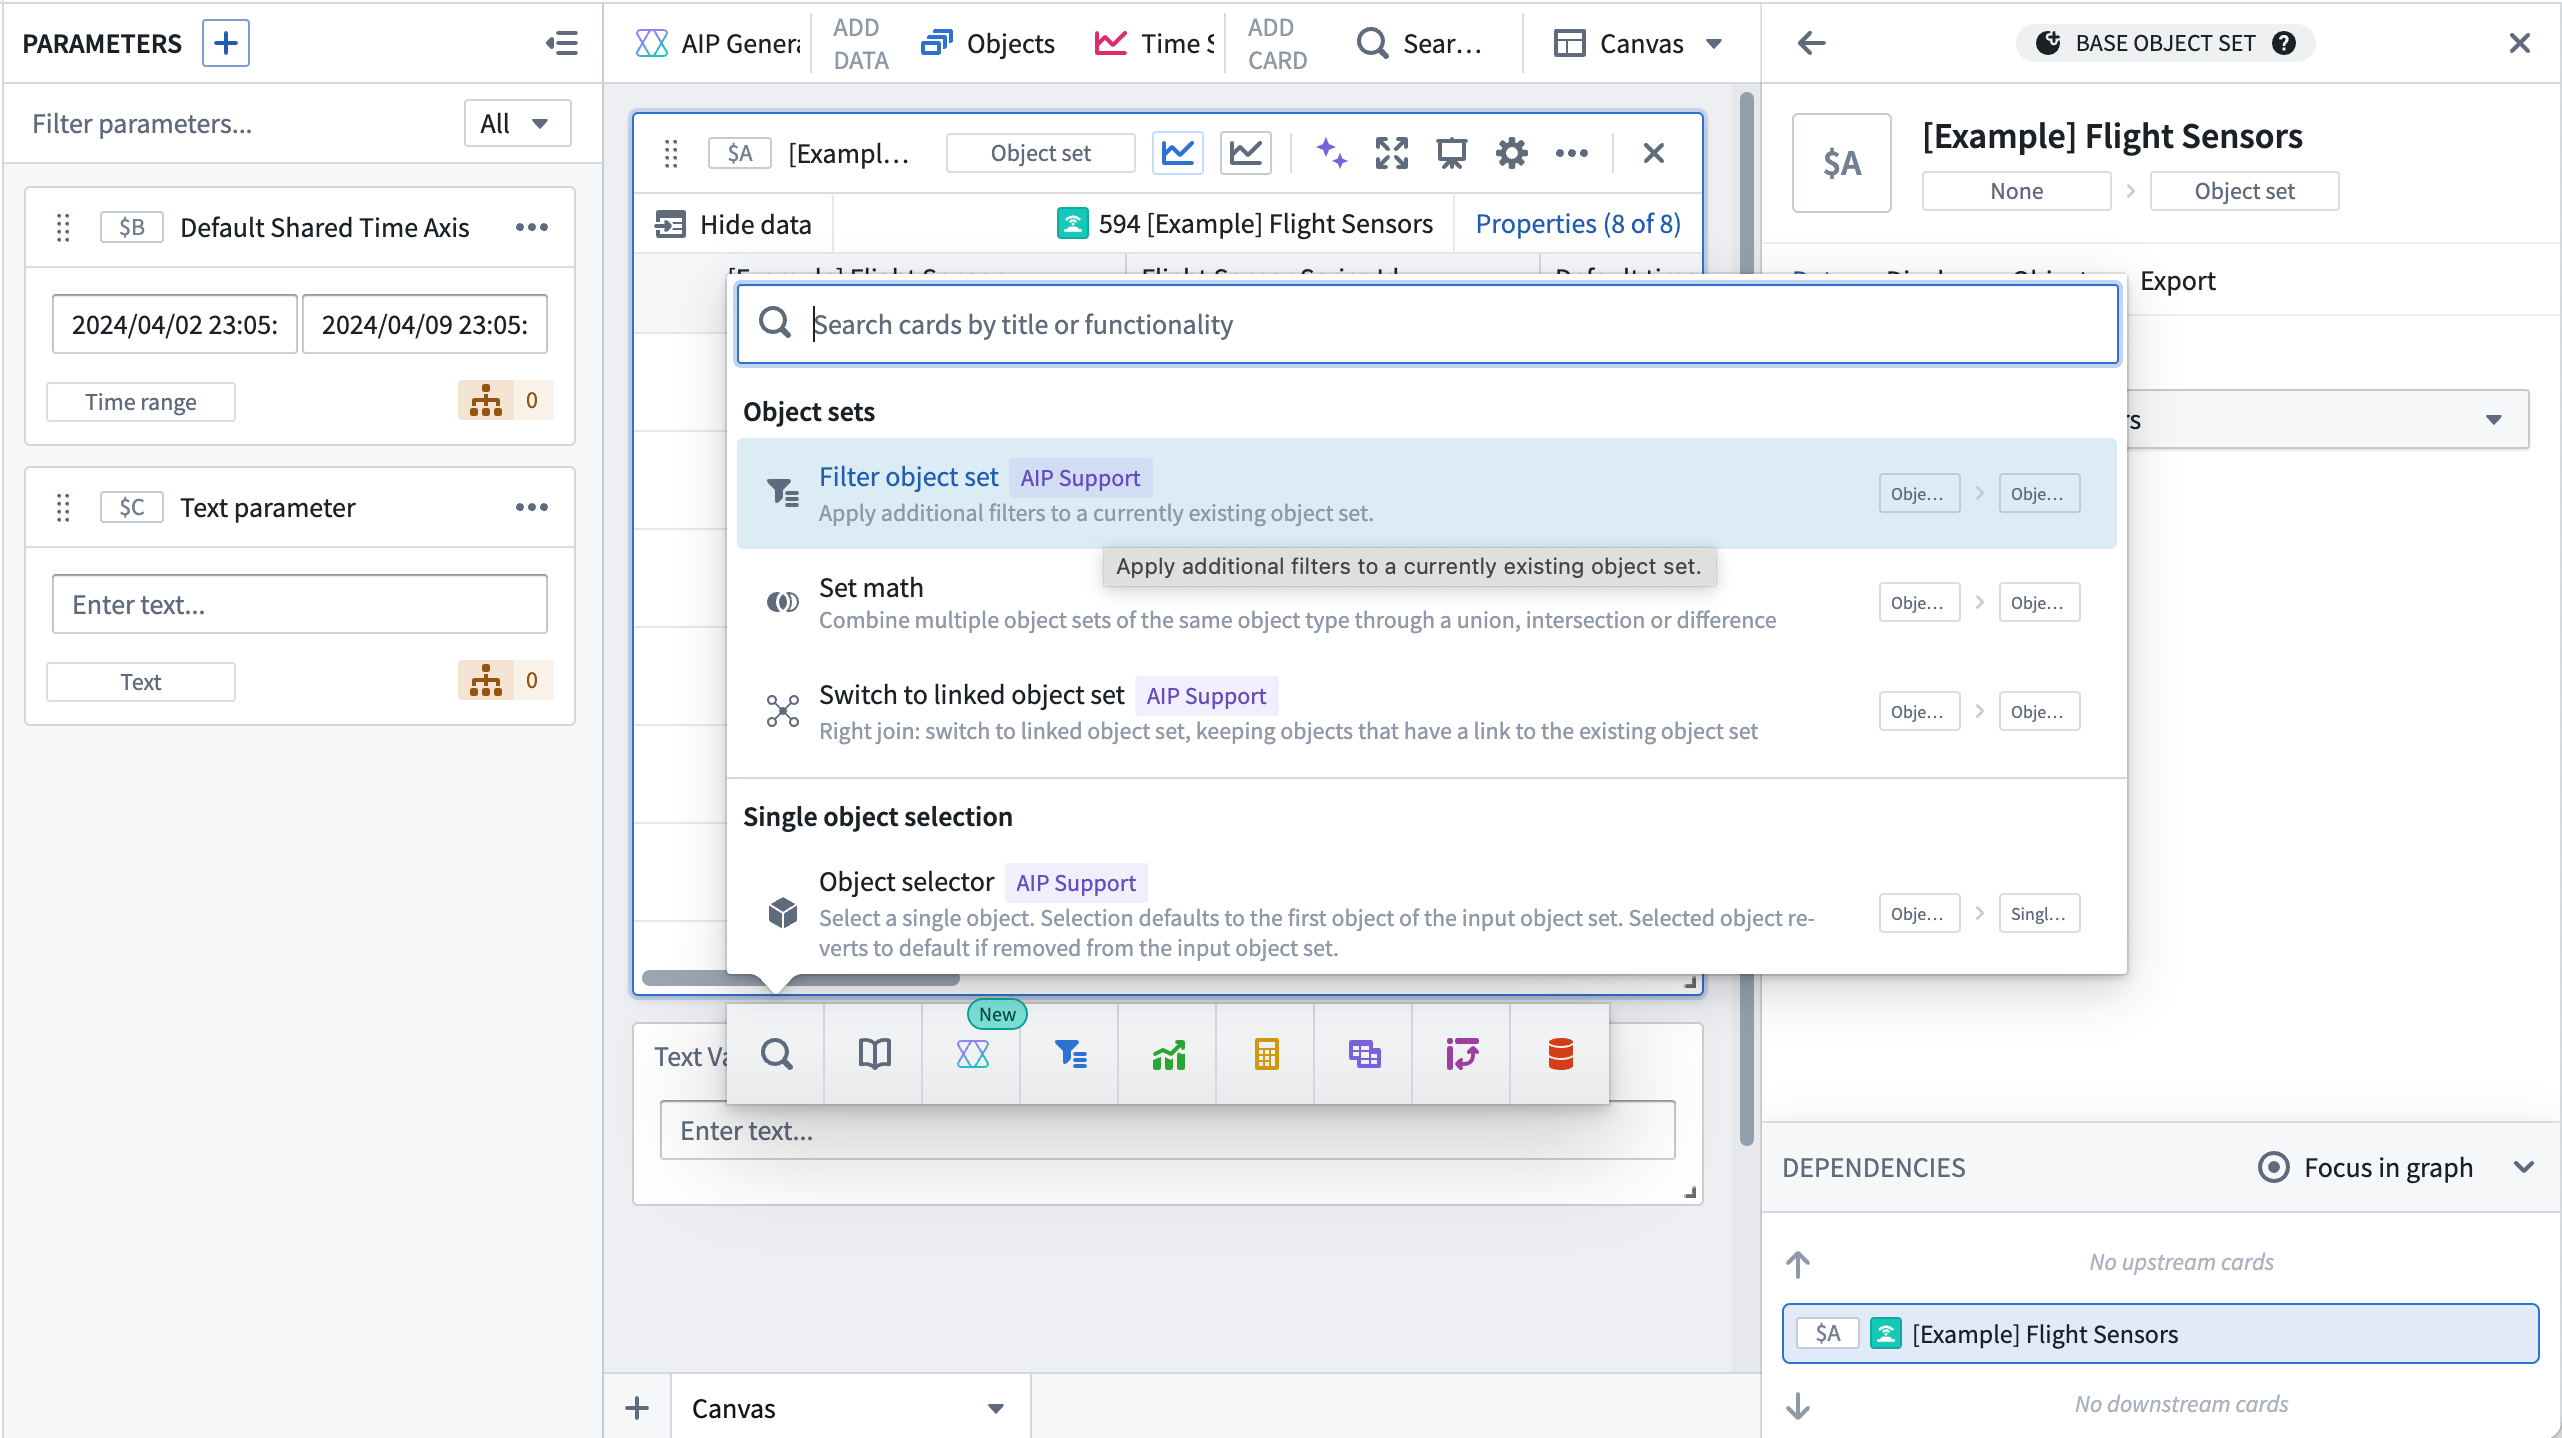
-
Add a filter by selecting Add a filter to limit your resulting object set, then selecting the option for ...where flight id is.
-
Select the String variable in the dropdown menu, and select the
Flight Id 1string parameter you made in the previous step. -
Add another filter by selecting Add a filter to limit your resulting object set, then select the option for ...where series name is.
-
Choose is(exact match) from the dropdown menu, then select the String variable.
-
Select the
Sensor namestring parameter that you created earlier.
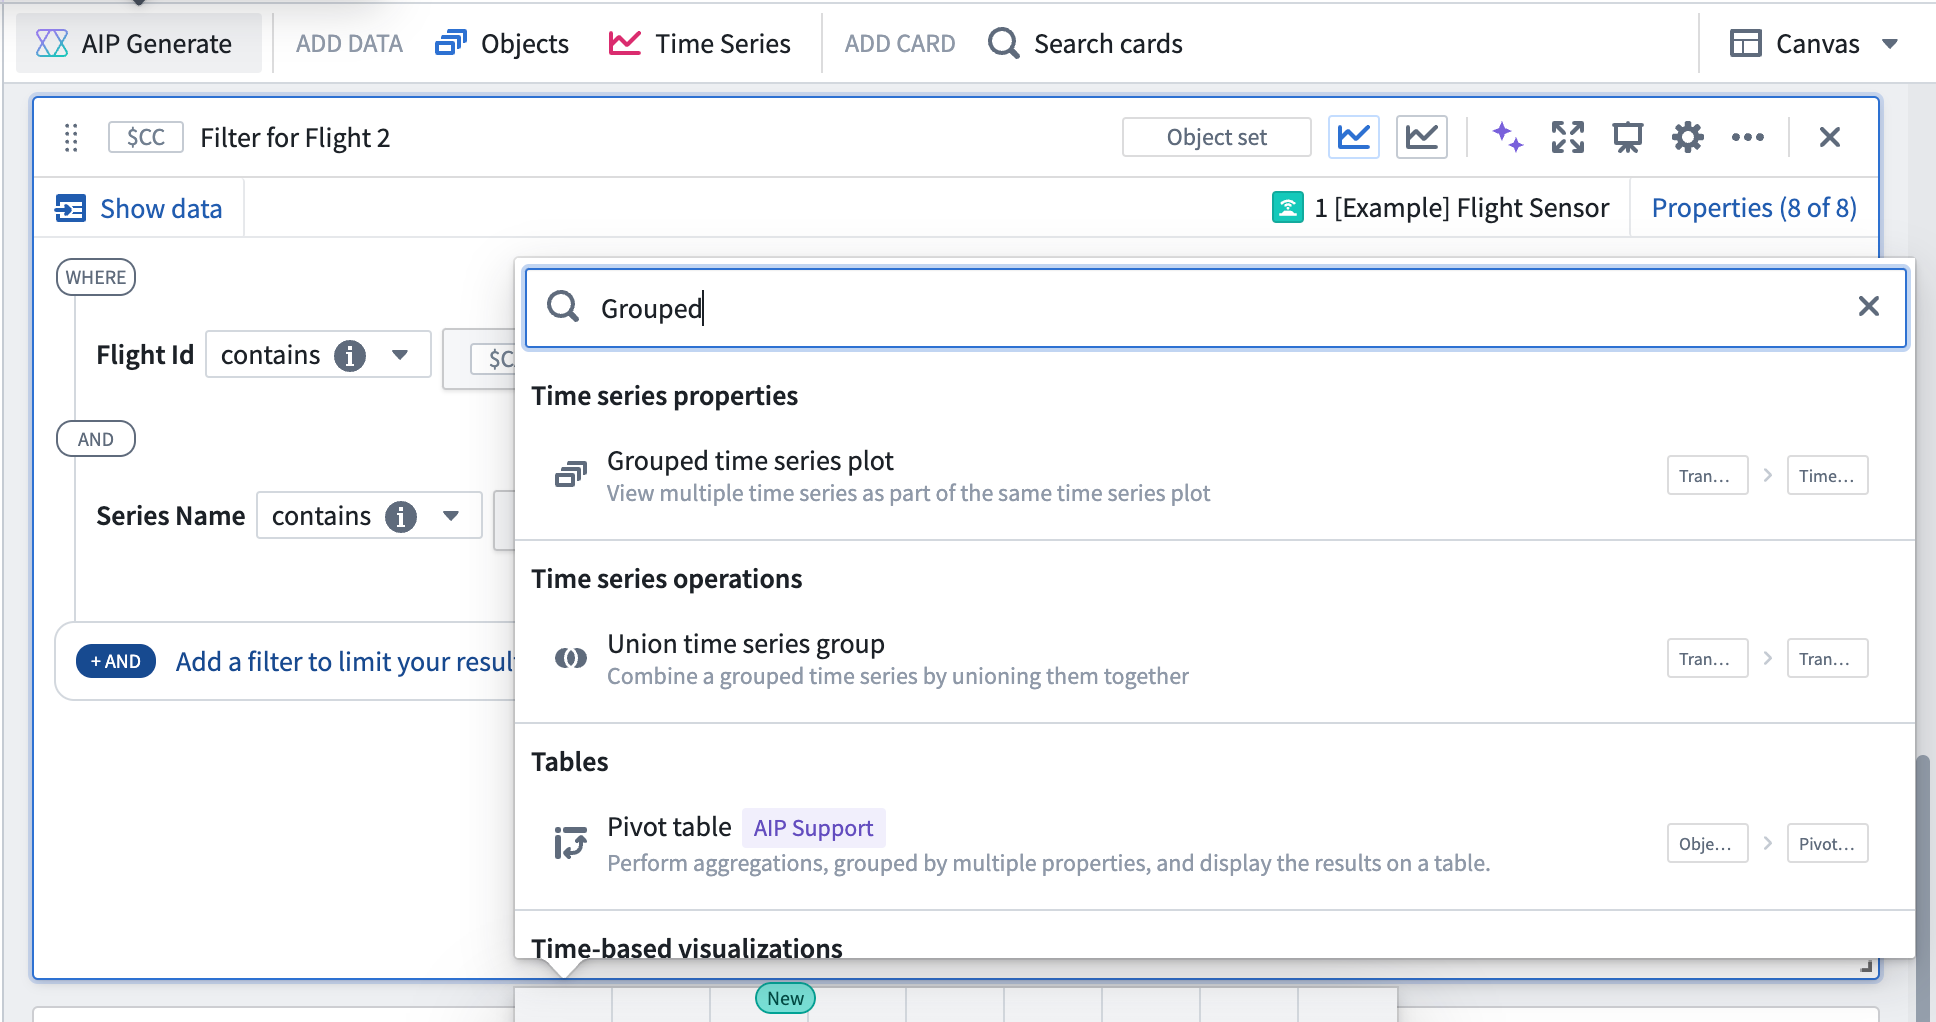
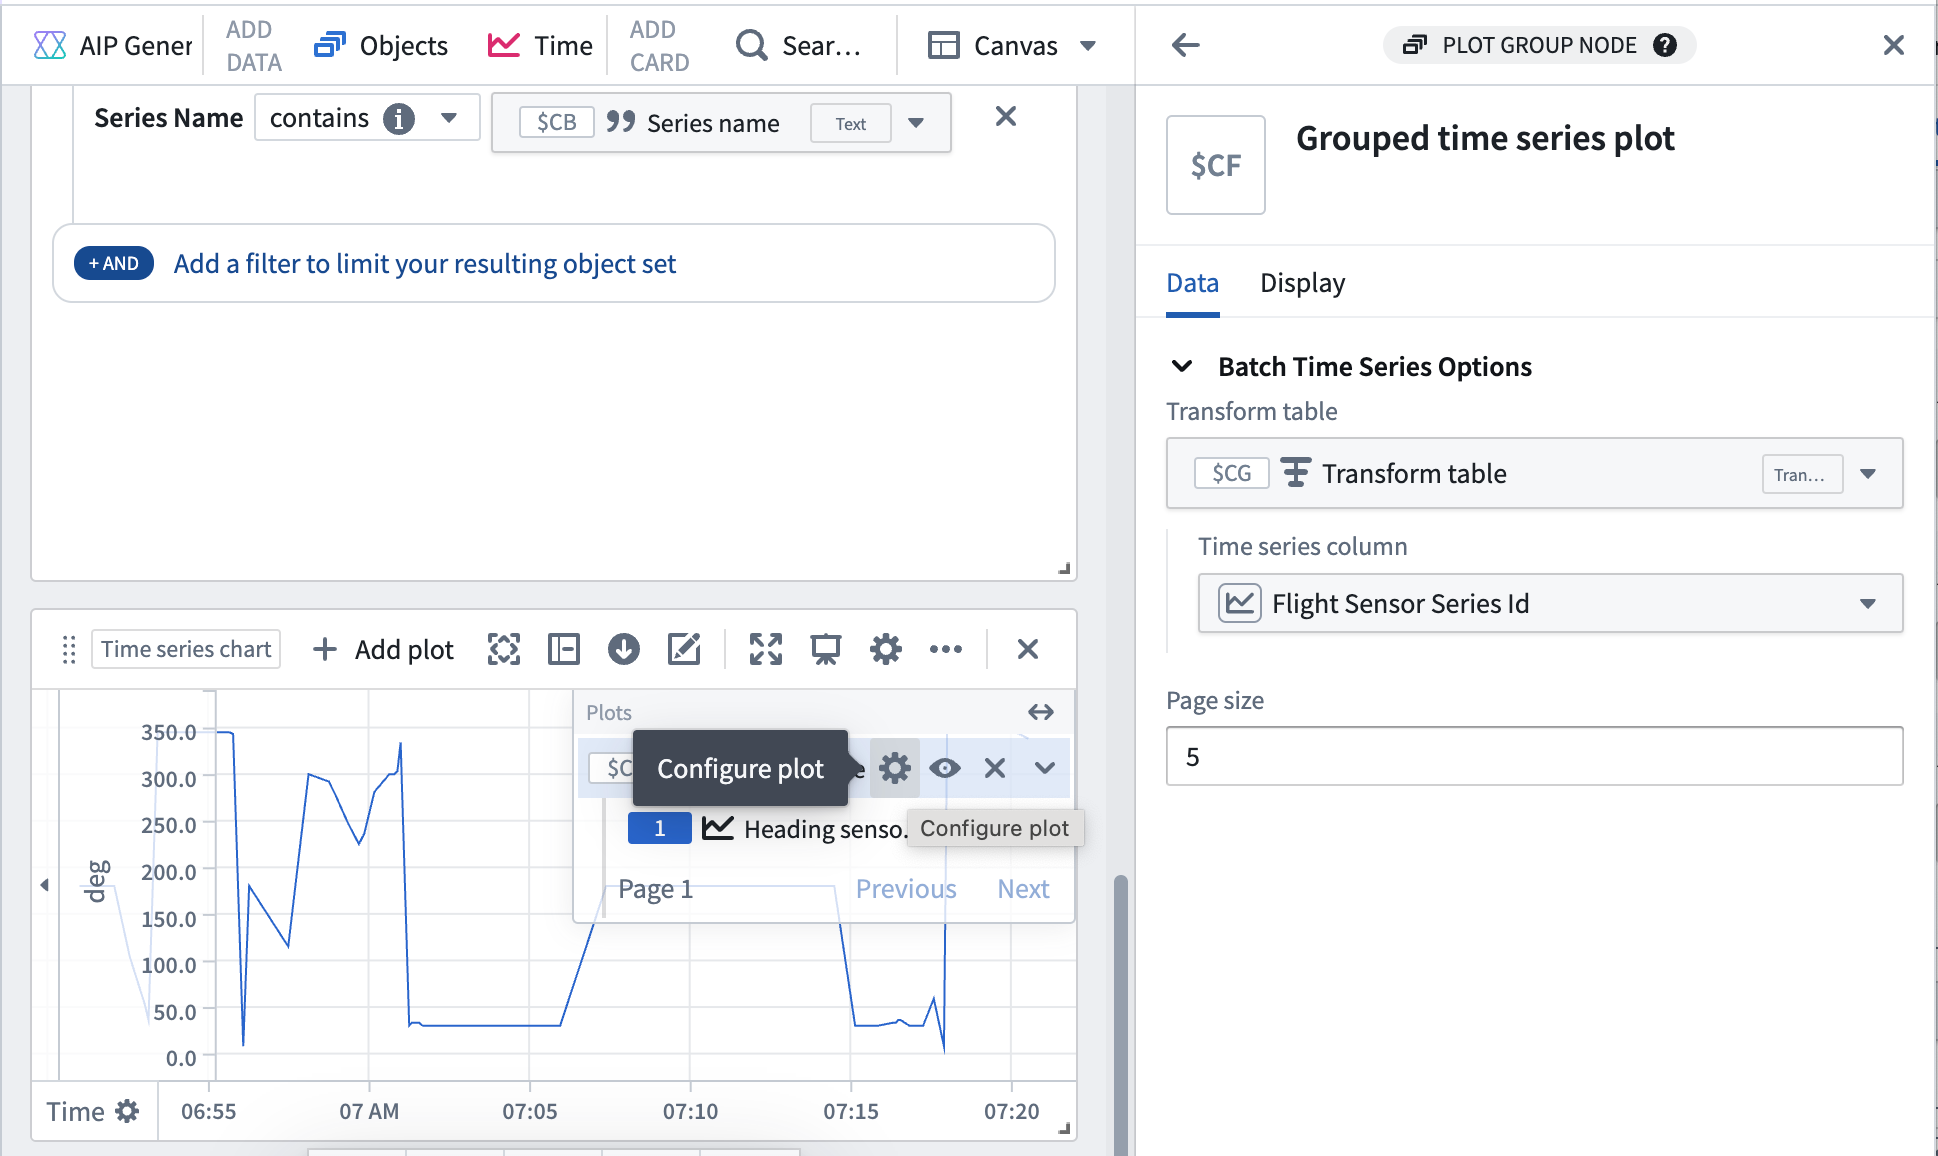
Add a grouped time series plot of flight IDs
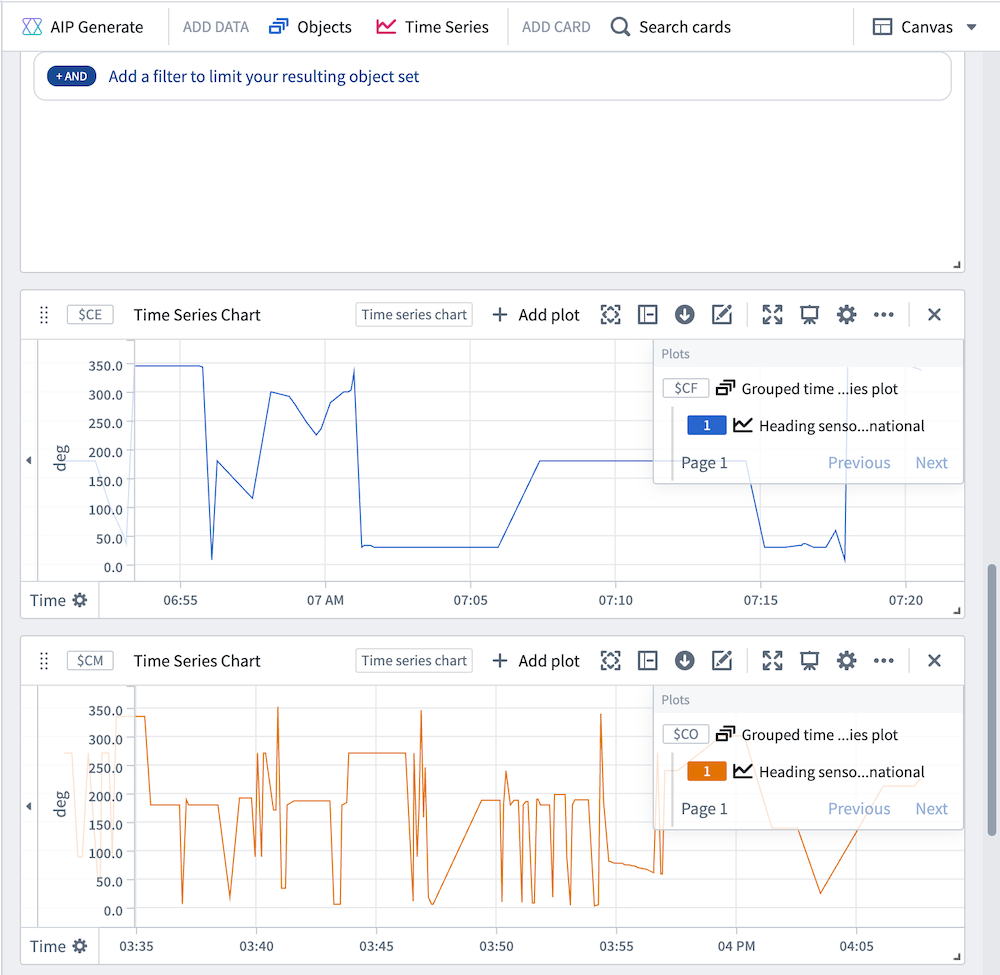
- Hover over the filter object set card to show the Search menu, or select Search cards to add a grouped time series plot. This will plot all the time series properties on the object and put them on a plot. In this case, you would expect this grouped time series plot to only contain one time series for one sensor object.
- Hover over the time series plot configuration to find the Configure plot icon and open the configuration panel.
- Under Batch Time Series Options, find the Time series column dropdown menu and select Default time series property. This will ensure that the plots show up with the object name instead of the name of the series ID column.
- Repeat these steps for the filter card created for the
Flight Id 2parameter. You should then have two separate charts for grouped time series.
Overlay plots and add relative time shift
- Select the grouped time series plot to access the quick actions menu.
- Select Transform and search for a Relative time series card.
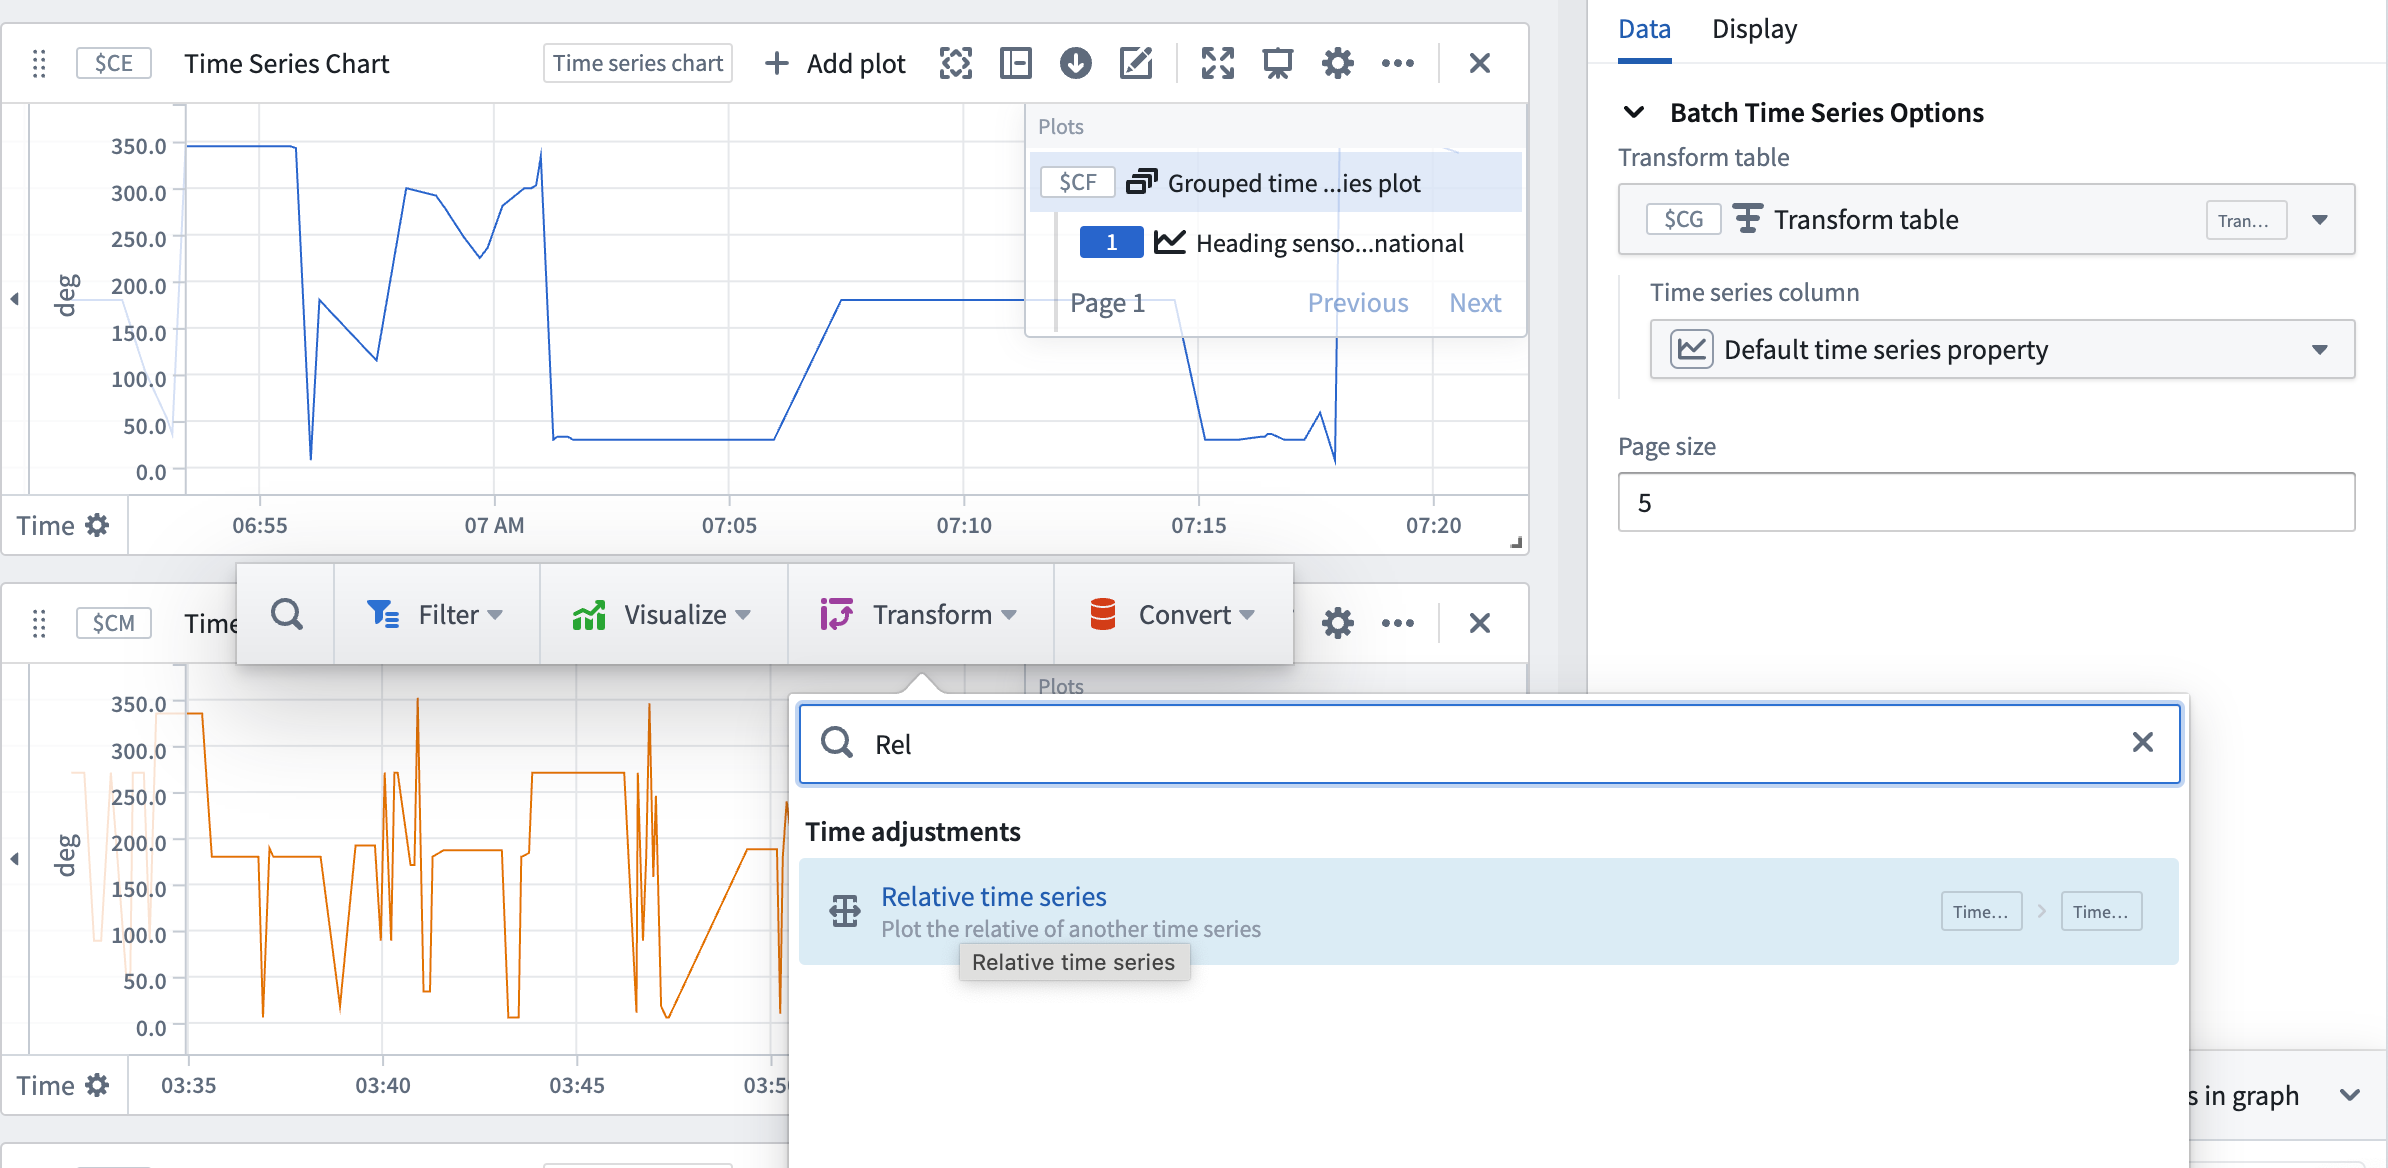
- Repeat for the second grouped time series plot.
- Then, in the second grouped time series plot, select the Configure plot option and navigate to the Display tab of the configuration panel.
- Under Colors, select a color to differentiate it from the previous plot. In this example, orange is selected to optimize for visual contrast with blue.
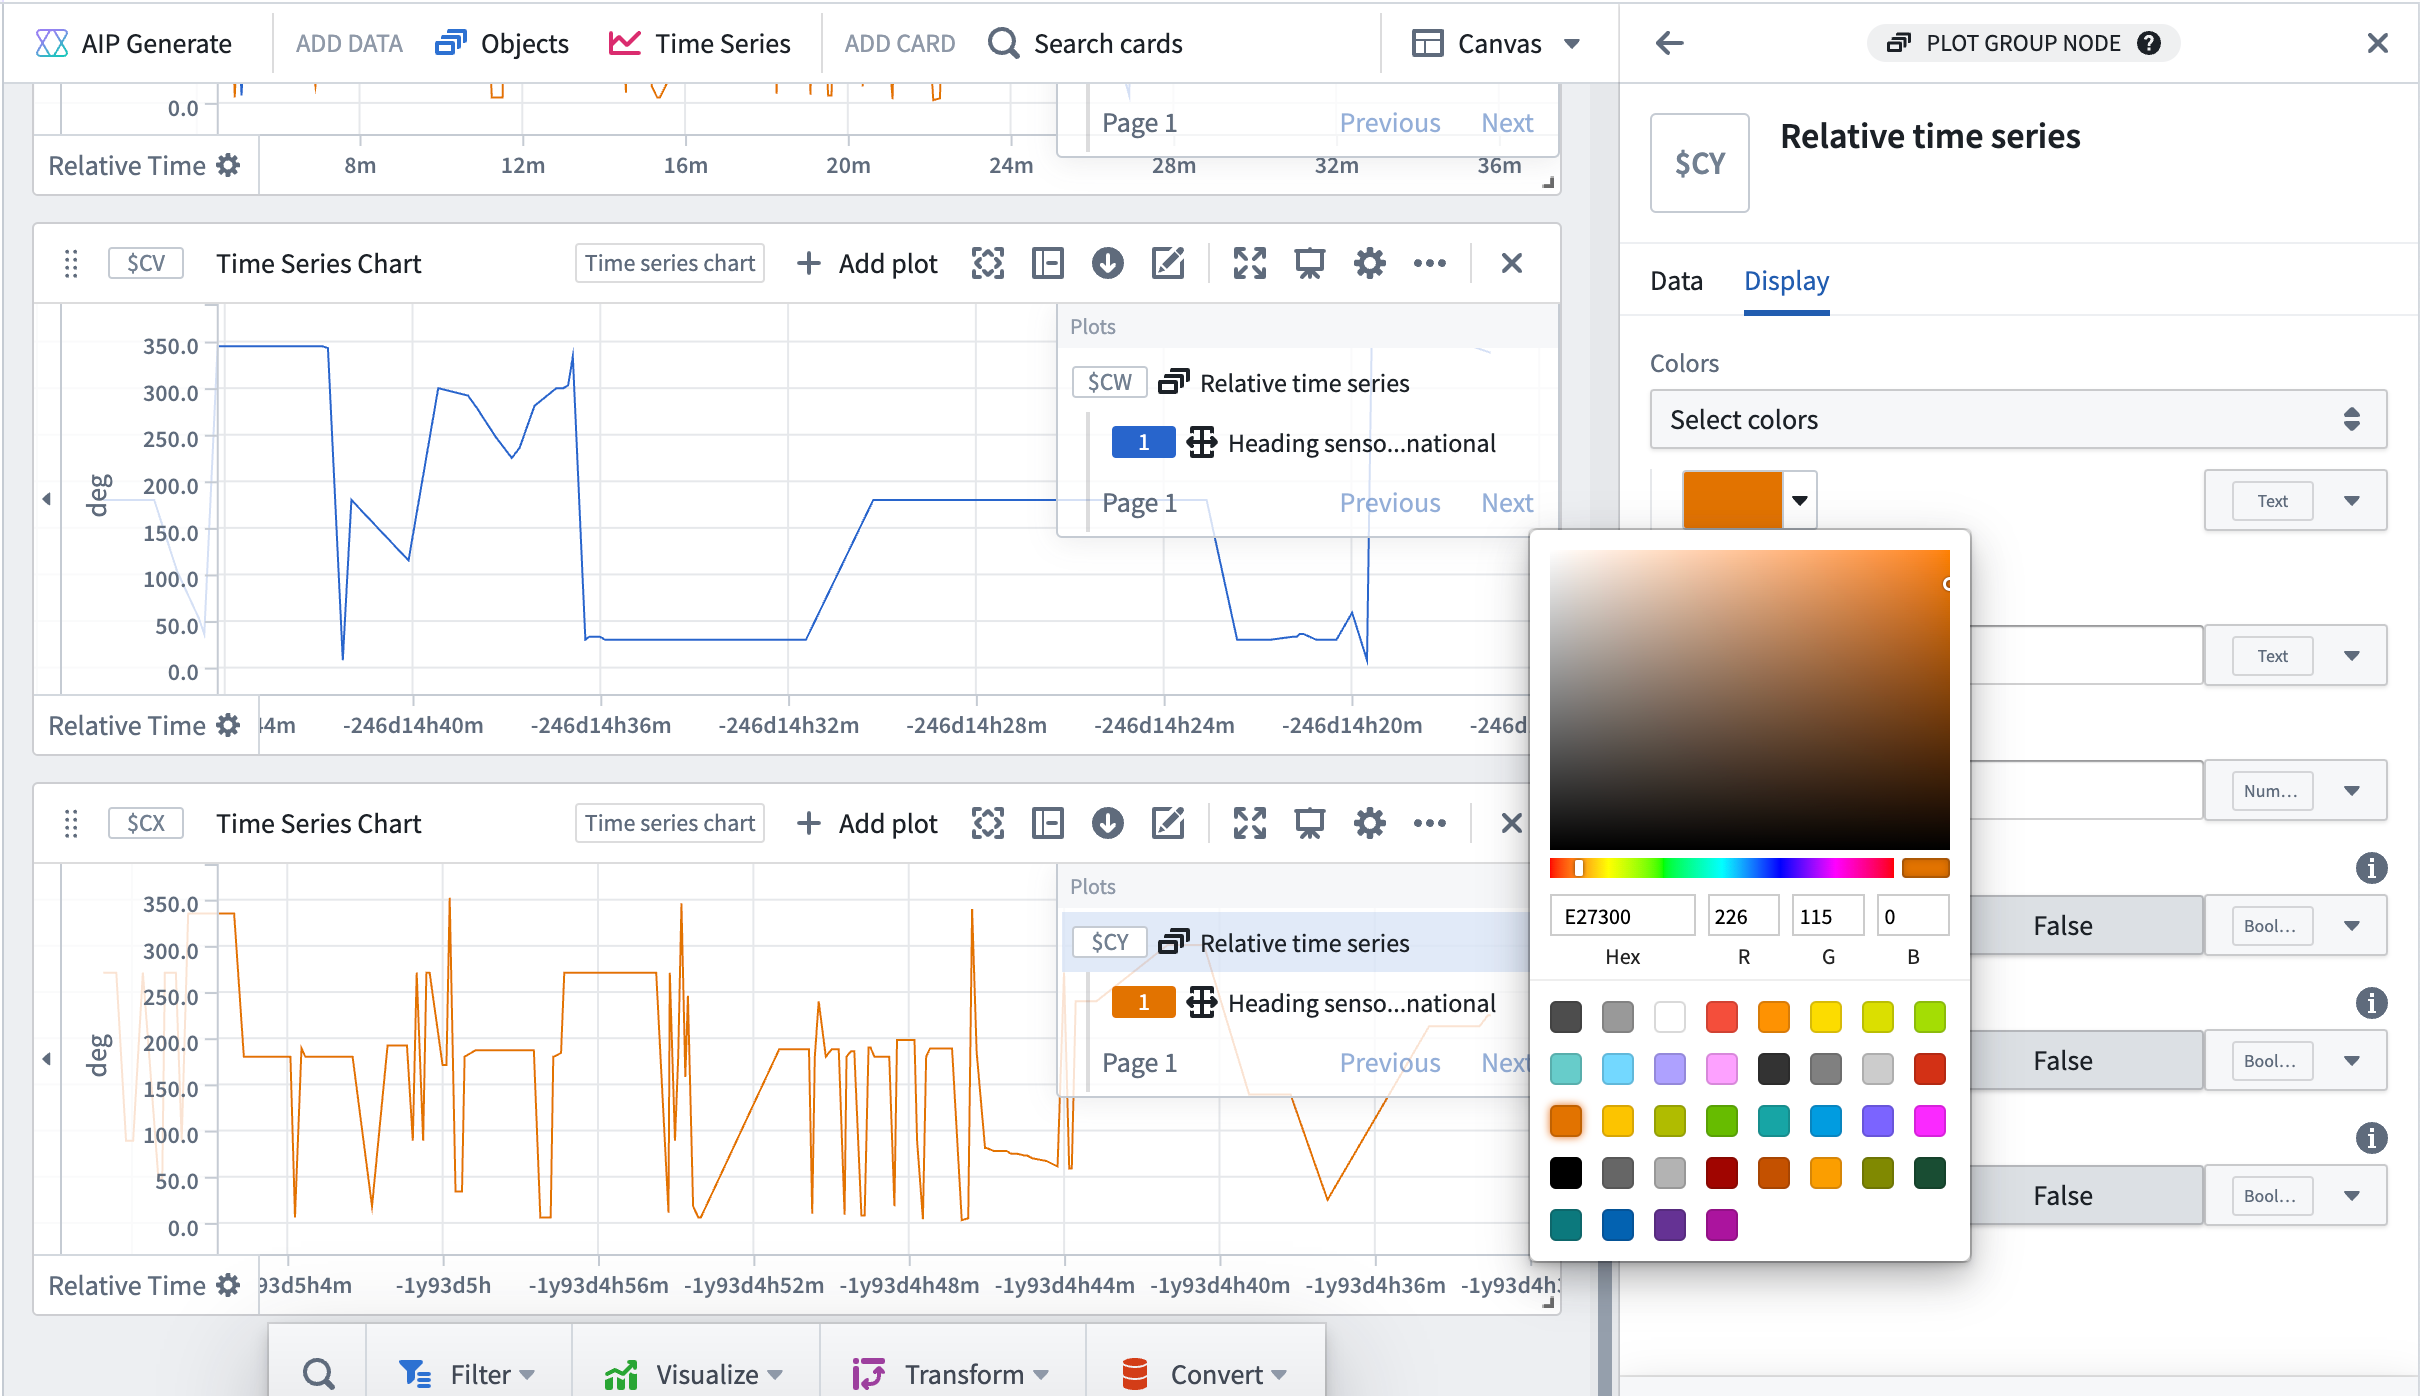
- Select one of the grouped time series plots and drag it onto the other plot to condense into one chart. You may notice plots seem to disappear. You will need to make the plots use the correct extents to appear together.
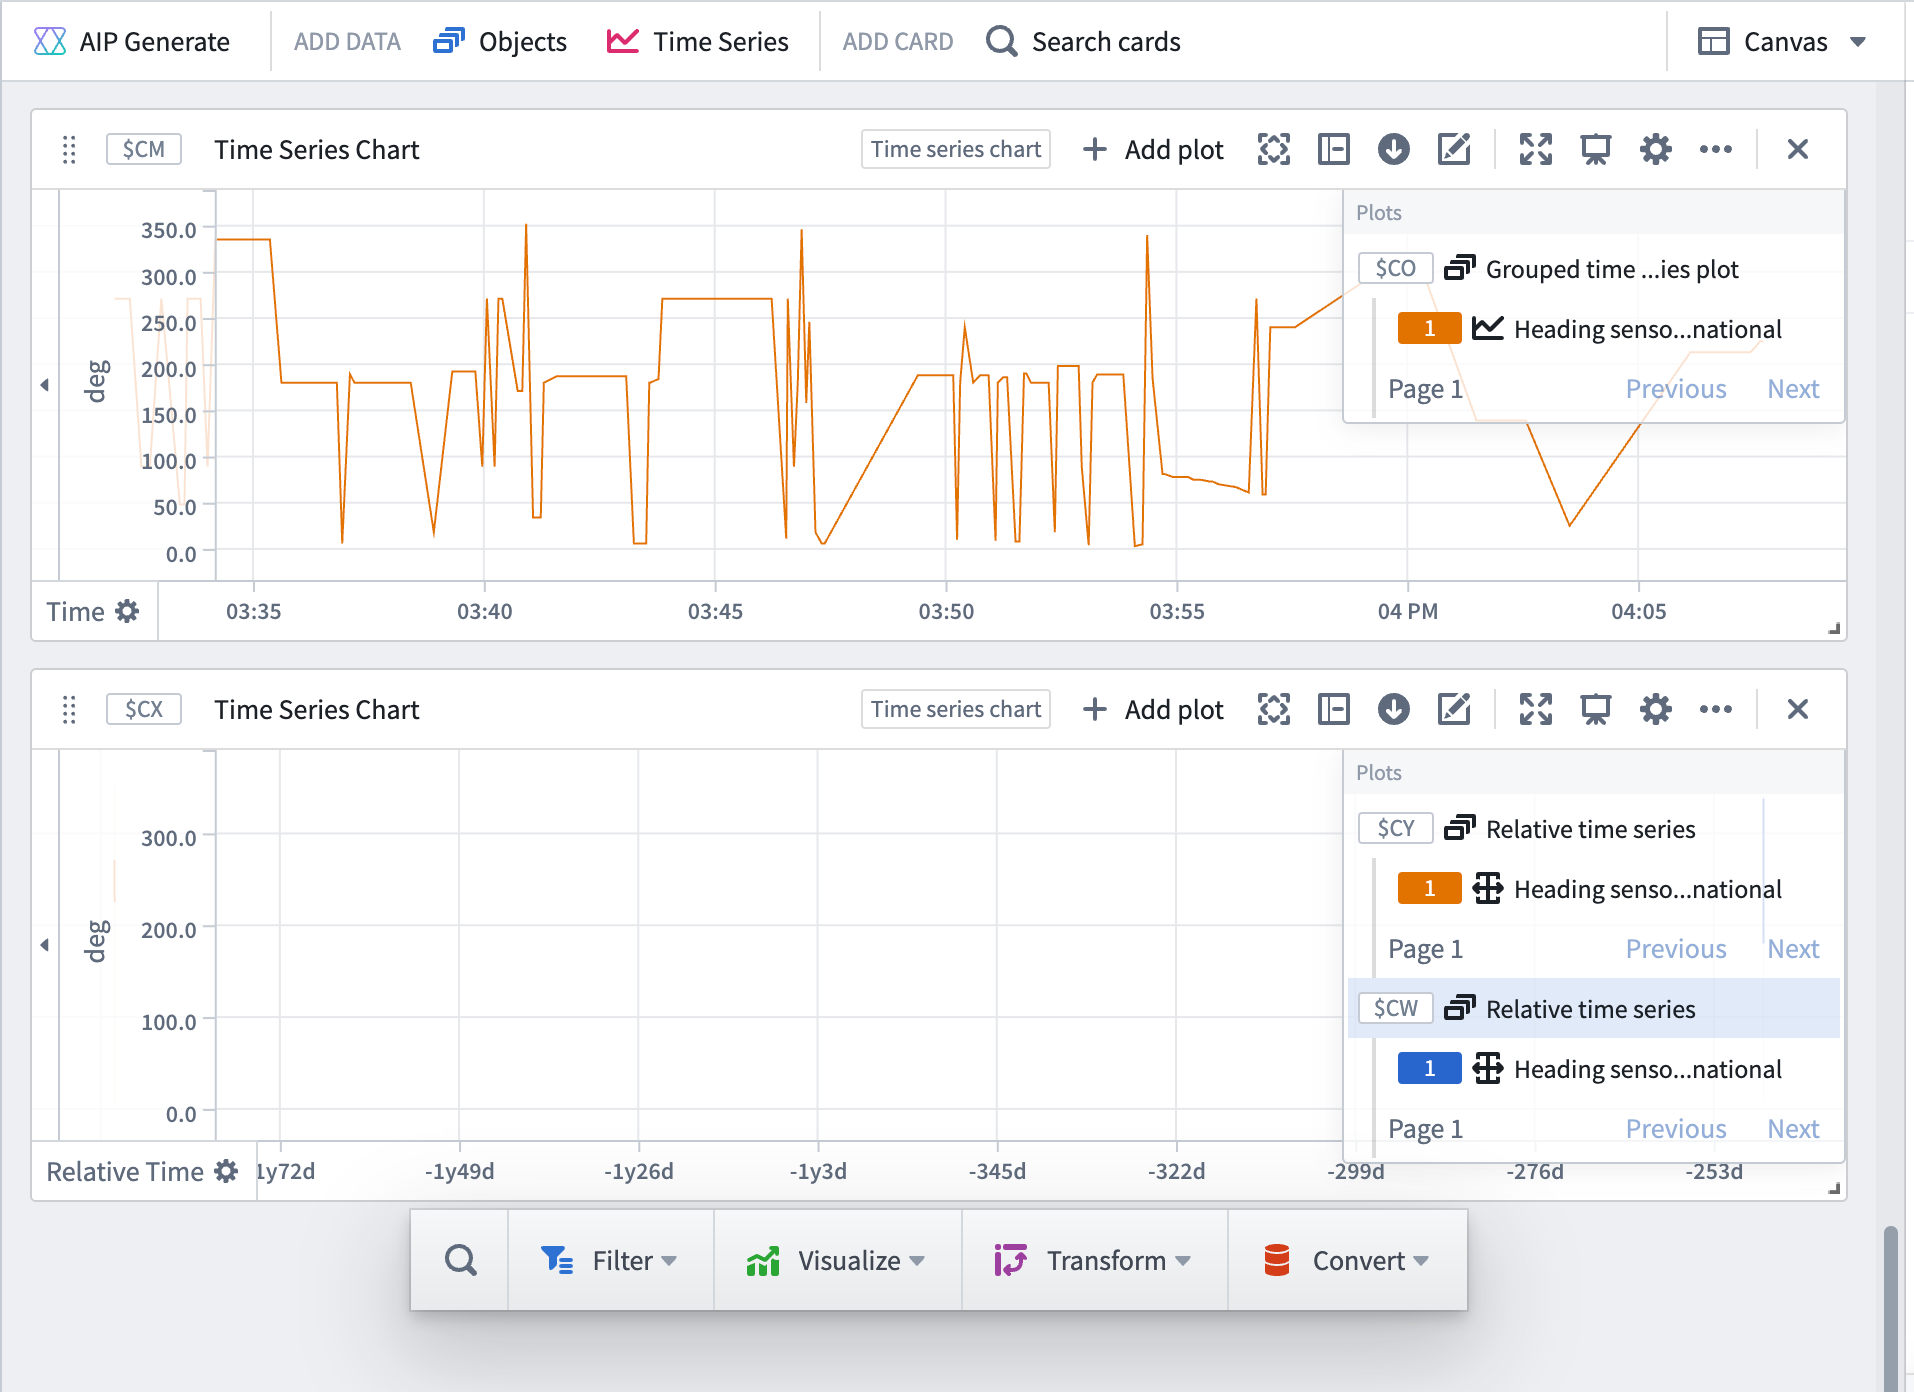
- Select the plot configuration for the Relative time series card. Under Relative Time Options, toggle on the Use source extent setting. Ensure that the Relative to dropdown menu is set to Start.
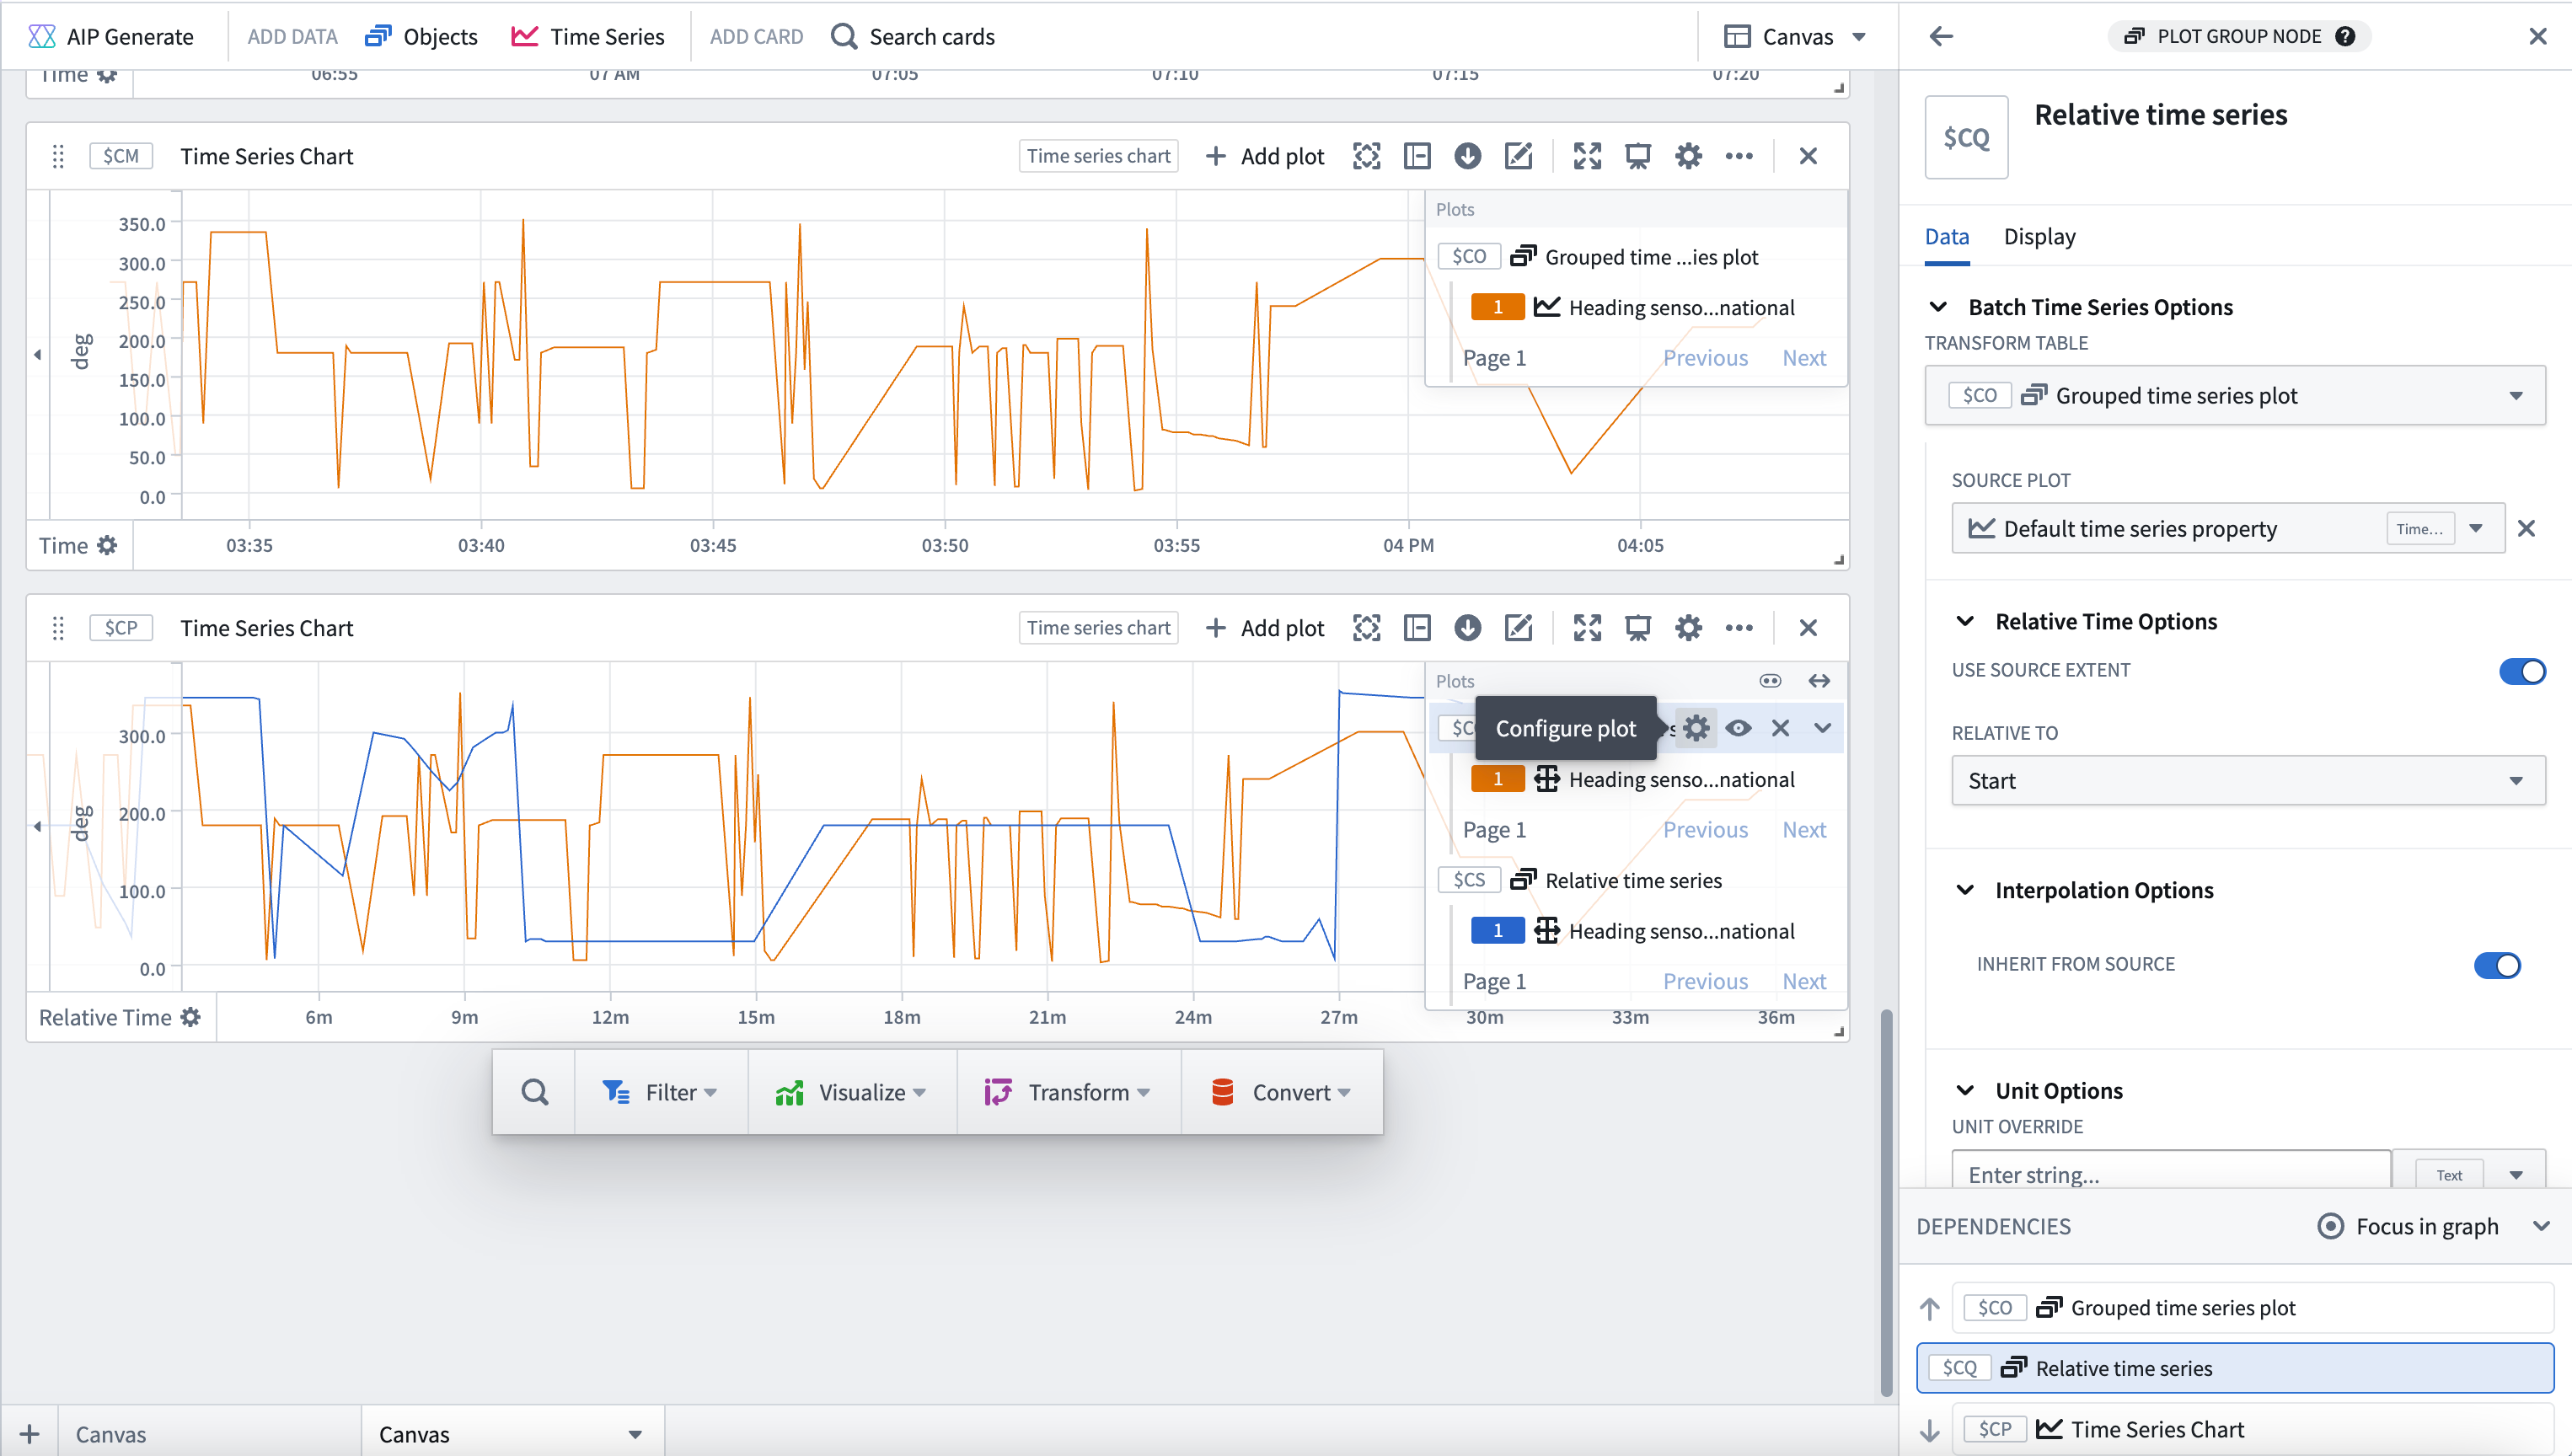
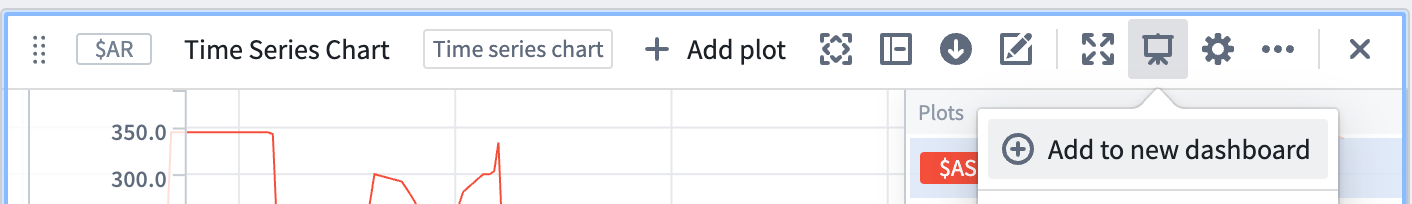
Add charts to new dashboard
- Choose to + Create new dashboard from the Dashboards tab to the left.
- Add the time series chart by selecting Add to new dashboard from the respective cards.
2. Configure the new dashboard
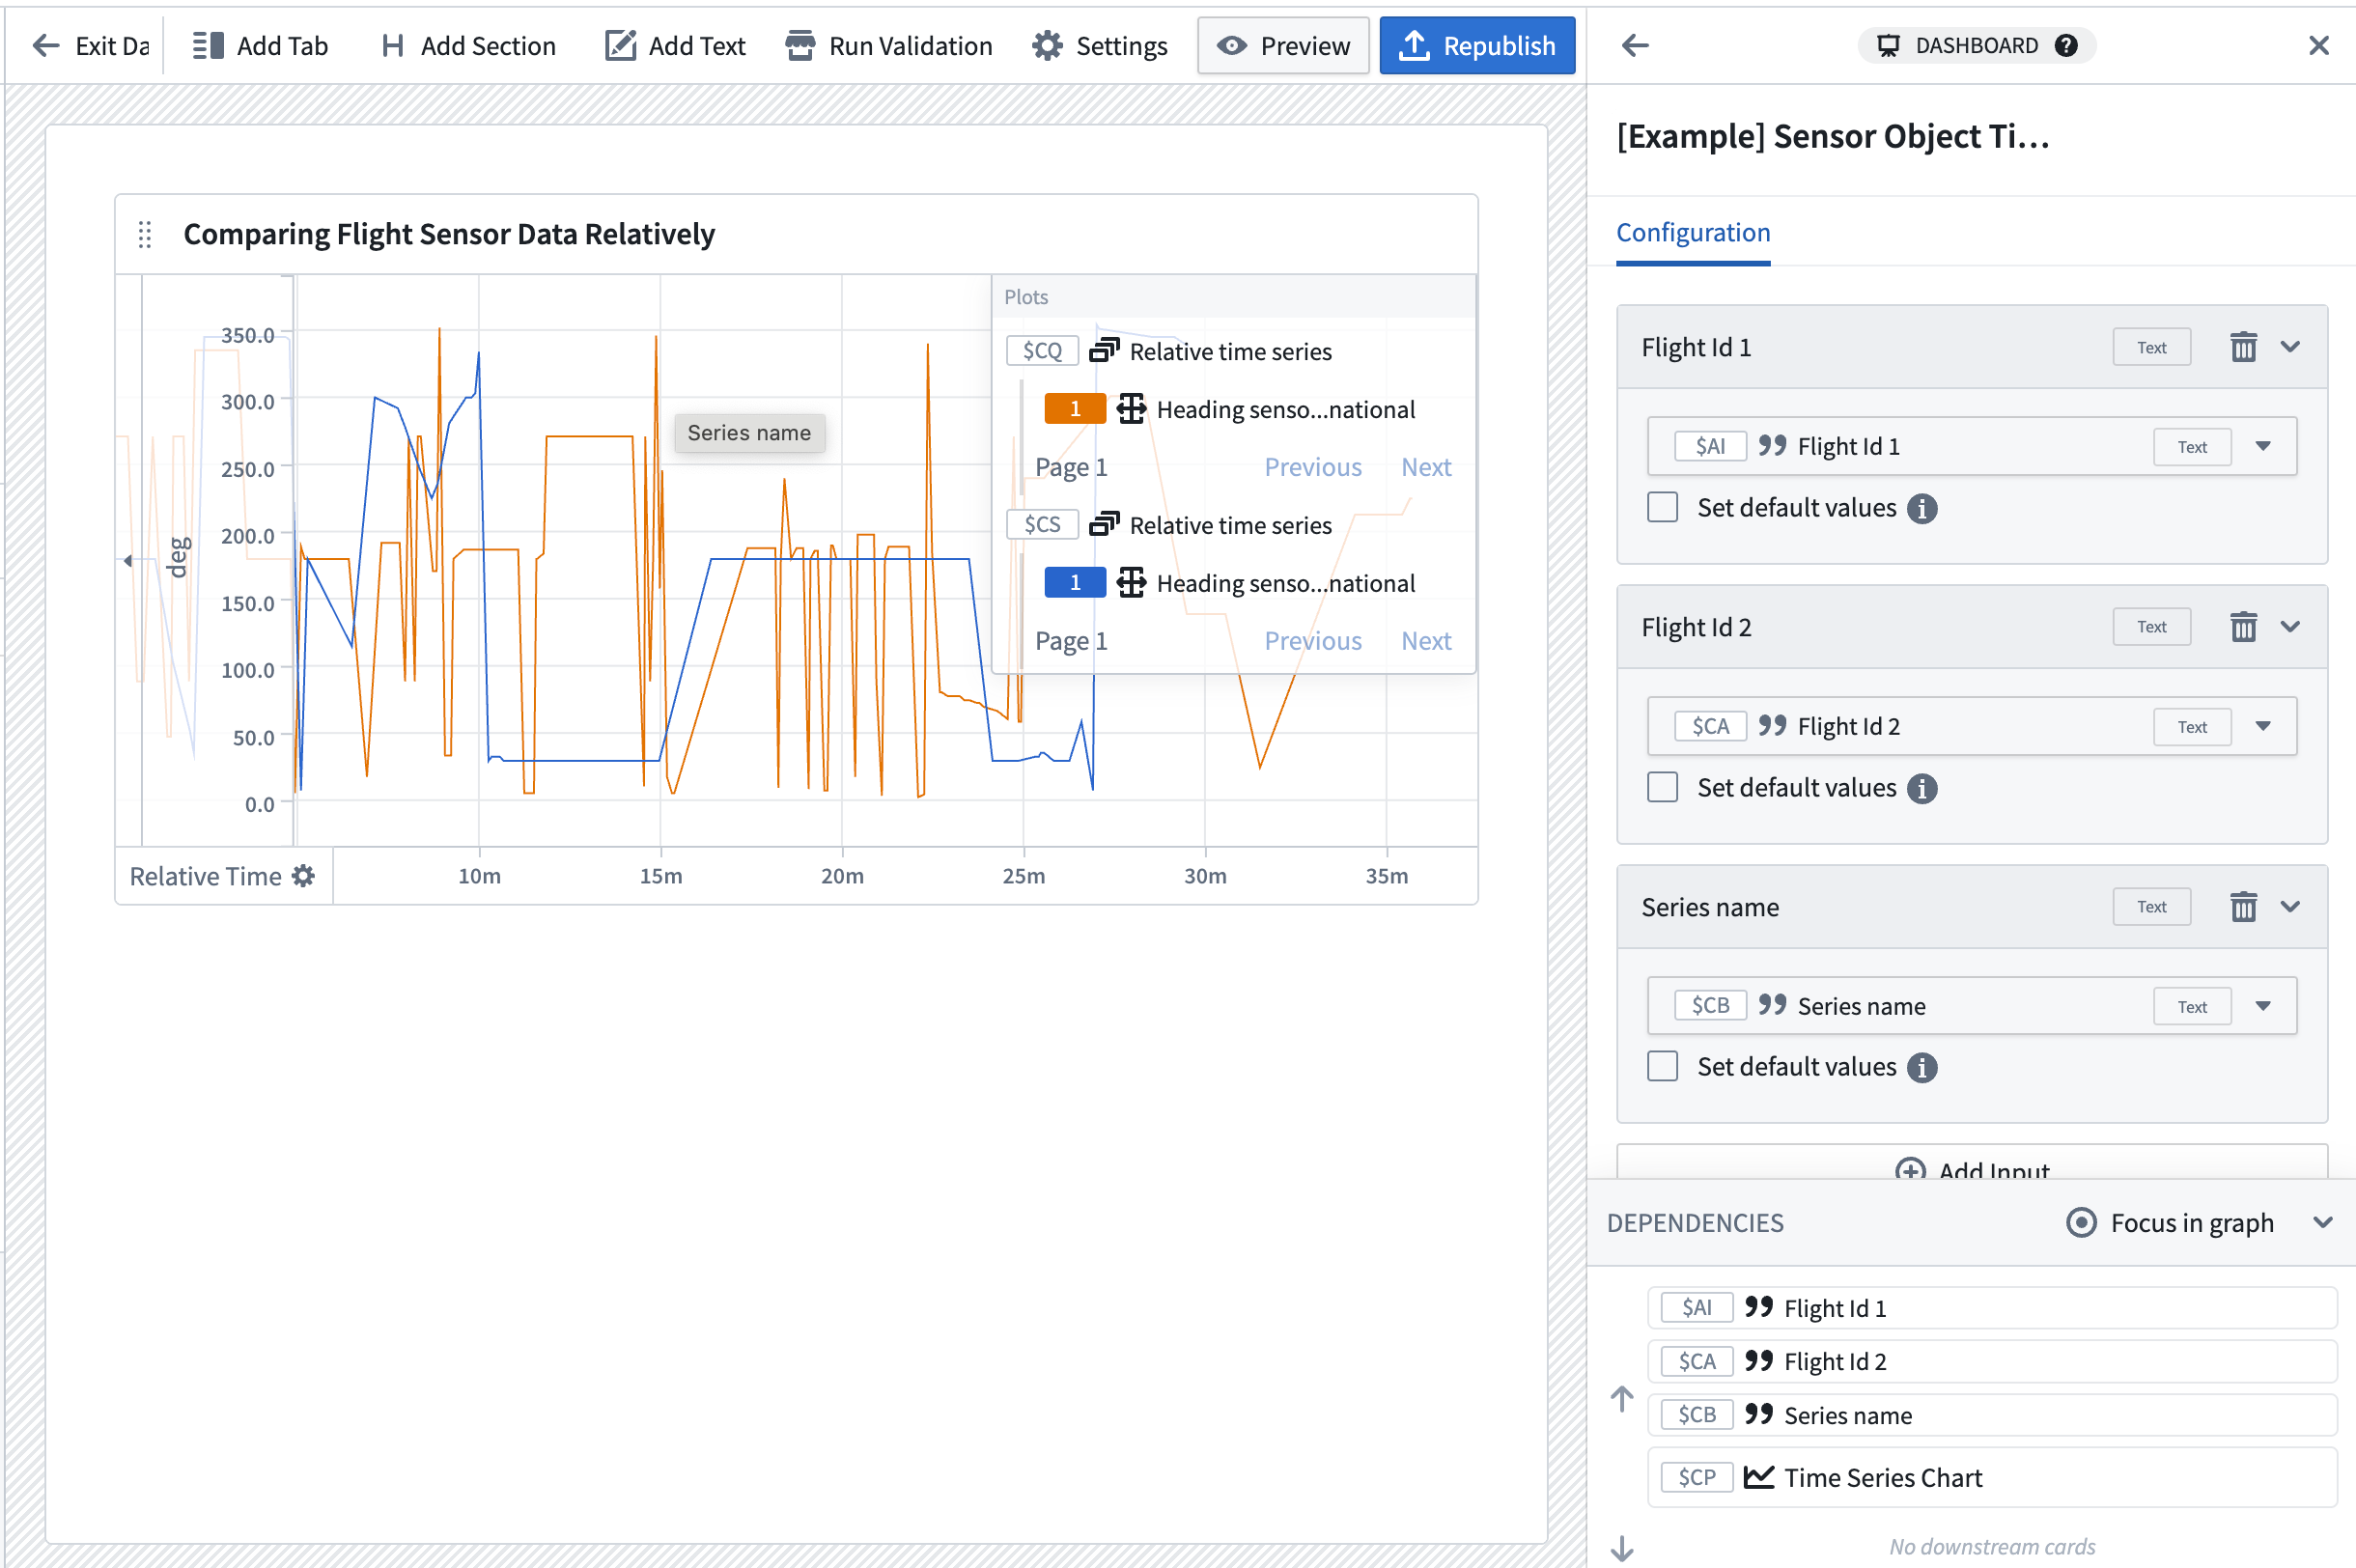
Navigate to the dashboard by selecting View dashboard, or access it from the Dashboard tab on the left side of your screen.
![]()
Resize and name the cards
Make sure the object selection card is at the top of the dashboard and rename the widgets to a useful name. For example, "Select an object" and "Flight sensor rolling 10 minute aggregate".
Add a string input to the dashboard
Select the Settings cog in the dashboard to open the dashboard configuration panel and add the following string inputs:
- Input for
Flight Id 1. - Input for
Flight Id 2. - Input for
Sensor name.
Publish dashboard
Rename your dashboard so that it is easily searchable from the Workshop module. In this example, the dashboard is named [Example] Sensor Object Time Series Data | Flight Sensor Reading Comparison.
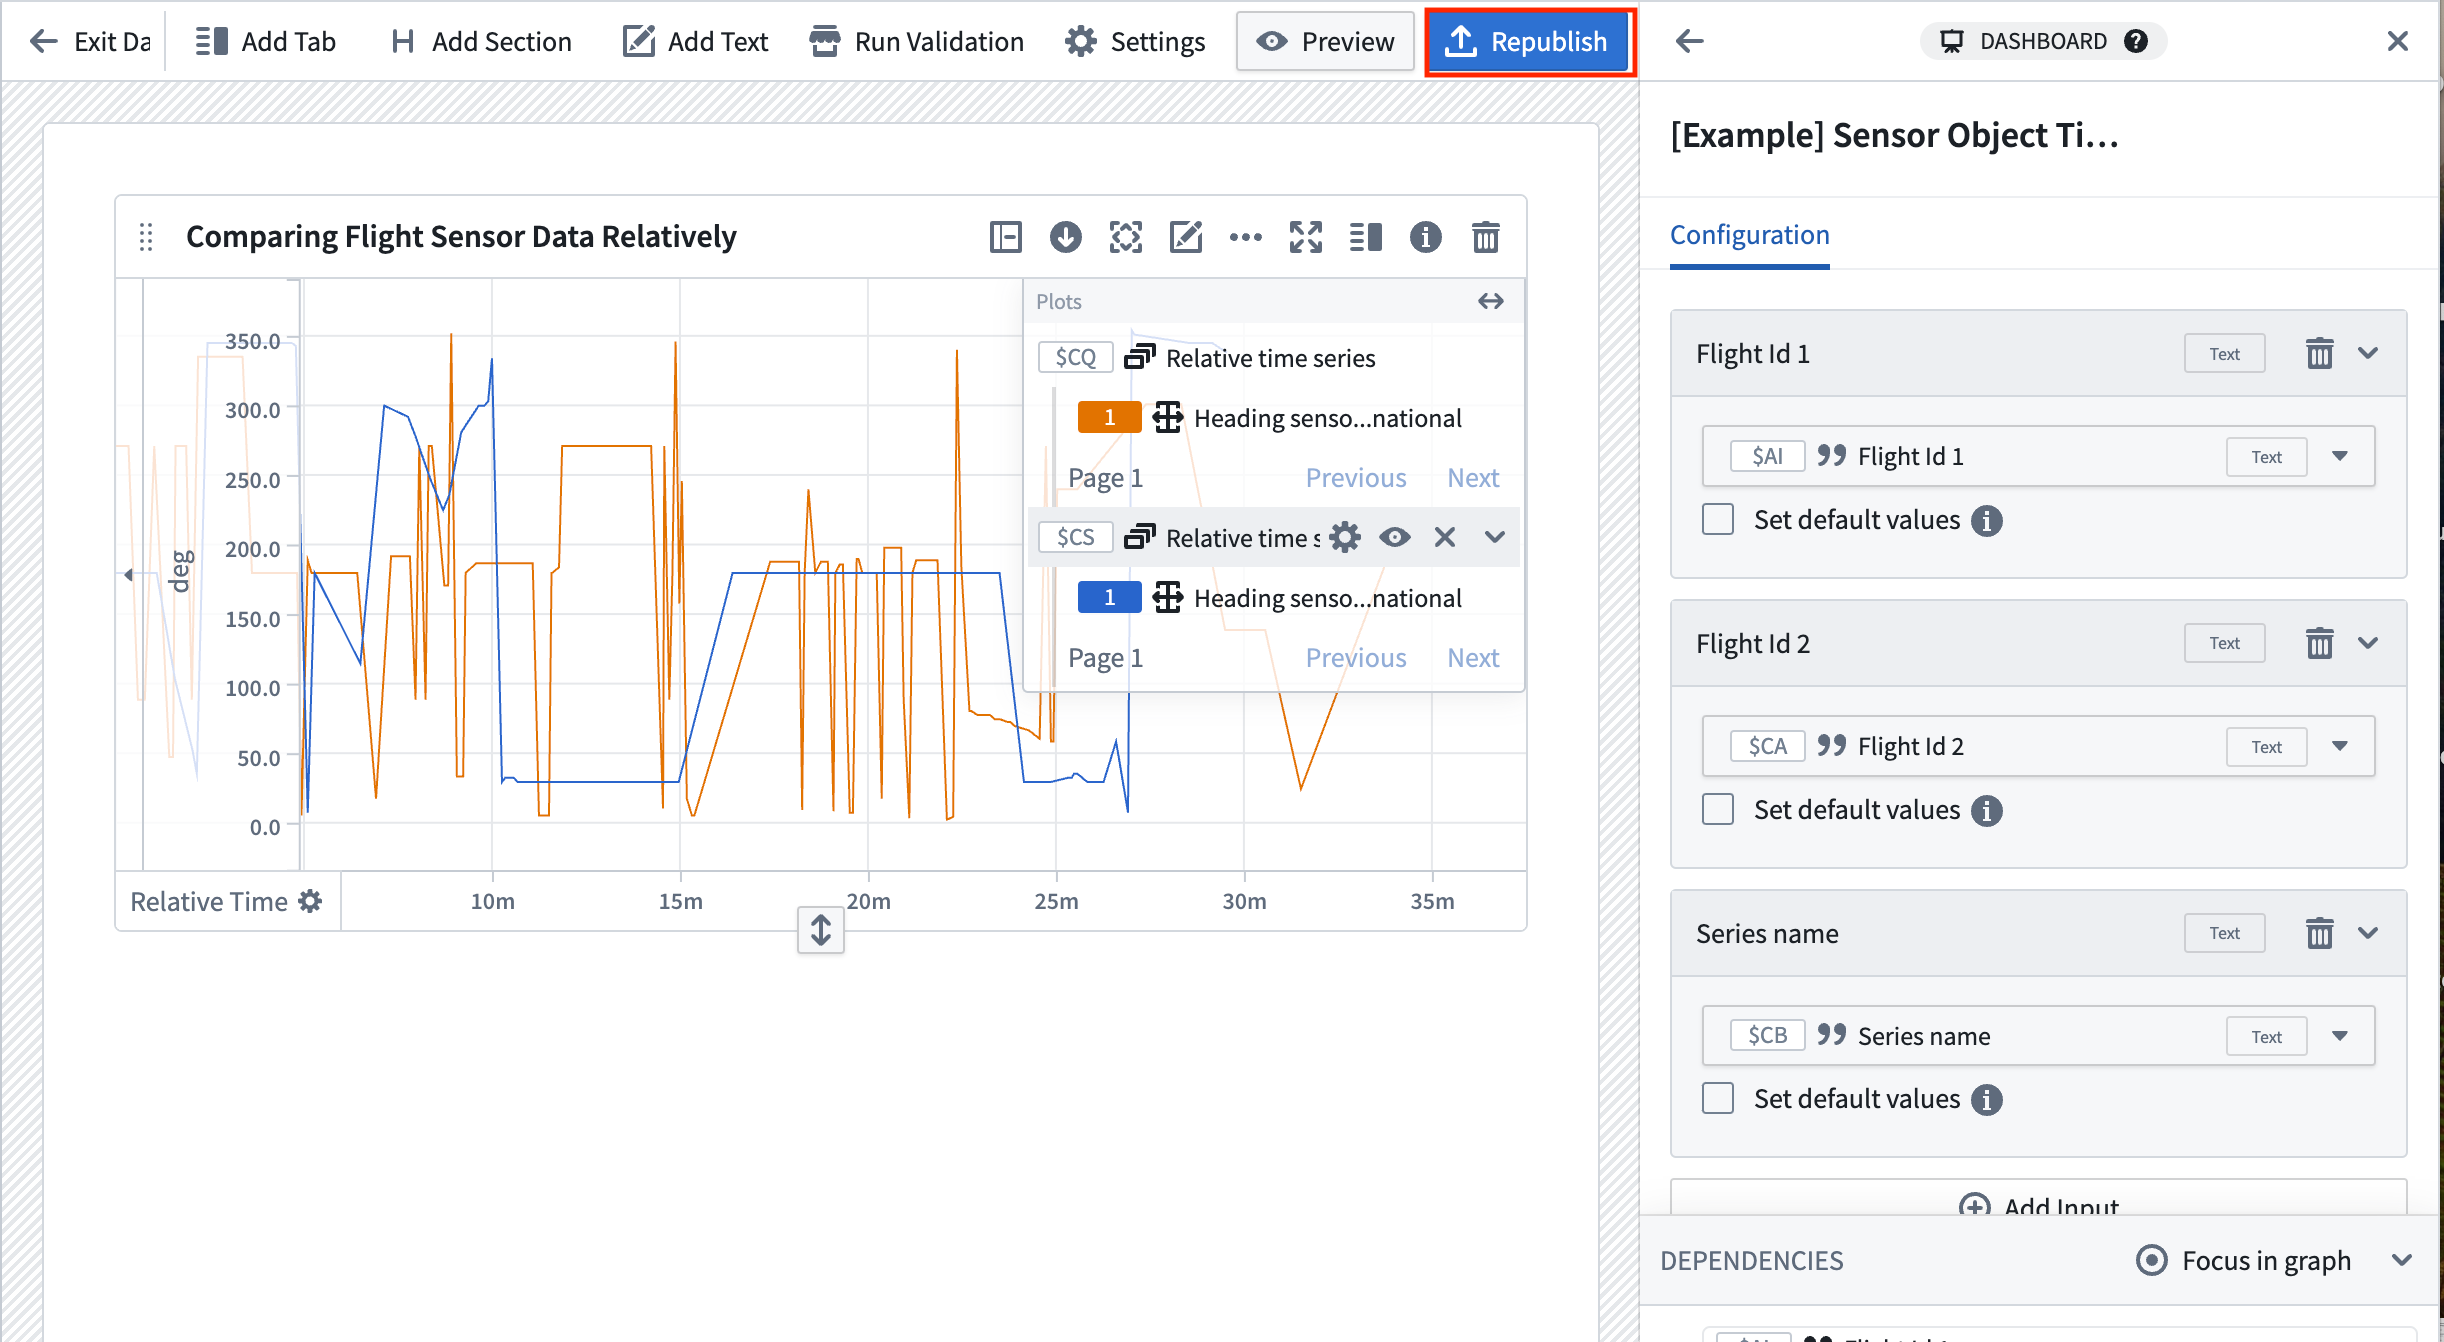
Review our Quiver dashboard documentation for more information on how to create and customize a Quiver dashboard.
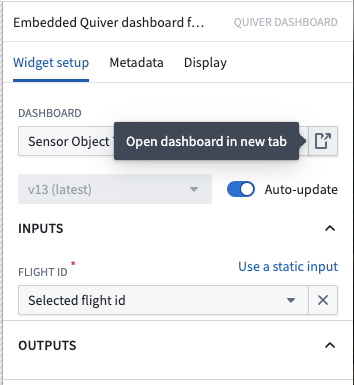
Part IV: Embed your dashboard in Workshop
- Return to the Workshop module you created earlier in this guide.
- Choose to add a Quiver Dashboard widget, then select your new dashboard.
If necessary, you can navigate back to the dashboard and start an analysis by editing the Workshop module, selecting the configuration of the Quiver dashboard widget, and choosing to view the Quiver dashboard. Then select Edit to view the backing analysis.
Review our documentation for more information on how to customize a Quiver dashboard in Workshop.
中文翻译
在 Workshop 和 Quiver 中使用传感器对象类型时间序列数据
要开始使用传感器对象类型时间序列数据,请在 Workshop 中打开 Flight Sensor Data 模块。您可以使用平台的 Quicksearch 功能找到该模块。在您使用传感器对象类型时间序列数据配置自己的 Workshop 模块时,此示例模块将作为参考。
通过本指南,我们的模块将允许您按起飞时间和机场筛选航班。然后,Object Table 小部件 将显示一个航班列表,您可以选择该列表来查看链接的传感器对象时间序列数据。
第一部分:在 Workshop 模块中设置初始小部件
该模块的 Map、Object Table 和 Filter 小部件是标准的 Workshop 功能。按照以下步骤配置这些小部件,然后再向模块添加时间序列专用小部件。
按航线 ID 筛选航班
Filter List 小部件 应获取 Flight 对象集,并根据 route id 应用筛选条件。
- 在您的 Workshop 模块中,选择 + Add widget,然后选择 Filter List 小部件。
- 在 Filter List 小部件的右侧配置中,为 Object set Input 创建一个新变量,并将其命名为 "Filter flights by route id"。Starting object set 应使用
Flights with linked flight sensors对象类型变量。
- 通过选择 + Add filter 添加
Route Id属性。 - 向下移动到 Filter output 字段,找到已为您创建的筛选输出。为其指定一个描述性名称,例如 "Flights filtered by route id";无需其他配置。
配置 Object Table 小部件以选择要比较的航班
- 在您的 Workshop 模块中,选择 + Add widget,然后选择 Object Table 小部件。
- 在右侧配置面板的 Input Data 下拉菜单中,选择 + New object set variable。
- 将变量命名为
Flights filtered by route id。 - 选择 Starting object set,然后选择现有变量
Flights with linked flight sensors。 - 选择筛选条件 Using a variable,然后选择
Filter by route变量。
- 选择 + Add column,然后从下拉菜单中选择 Departure timestamp。
- 向下滚动到 Selection 部分,并启用 Enable active selection 选项。这将配置表格中选定对象的输出。
- 从 Active object 下拉菜单中选择 New object set variable,创建一个新变量。将变量重命名为
Selected flight from table 1。无需其他配置。
- 对第二个表格小部件重复此过程,该小部件接收您在步骤 3-5 中创建的
Flights filtered by route id,并创建一个名为Selected flight from table 2的输出变量。
第二部分:从根对象类型添加传感器对象类型时间序列数据
创建传感器名称选择器
创建一个所需系列名称的下拉菜单,以便传递到您将在后续步骤中创建的 Quiver 仪表板。
- 在您的 Workshop 模块中,选择 + Add widget,然后选择 String Selector 小部件。
- 在小部件配置面板的 Option Generation 下,选择 + Add Selector option。
- 为
heading、vertical_speed、speed以及您想要显示的任何其他传感器名称添加选项。
- 在 Selection 部分的下拉菜单中,选择
Selected series name变量。 - 对于 Selection Display 配置,保留默认的 Dropdown 选项。
创建航班 ID 变量
现在,您将创建两个变量,分别代表从左侧和右侧表格中选择的航班的航班 ID。每个变量都是一个字符串,由 Object Table 小部件中配置的 Selected flight from table 1 和 Selected flight from table 2 变量中的 Flight Id 属性支持。您将把这些变量传递到 Quiver 仪表板中。
- 从 Workshop 模块左侧导航到 Variables,然后选择 + 添加一个新变量。
- 从下拉菜单中选择 String。
- 从下一个下拉菜单中选择 Object property。
- 选择
Selected Flight from Table变量作为具有单个选项的对象集,然后选择Flight Id作为Selected Flight Id变量的属性。
第三部分:创建 Quiver 仪表板
以下指南假设您具备基本的 Quiver 导航知识。要了解有关 Quiver 常规功能的更多信息,请查阅我们的文档。
此 Workshop 模块包含一个嵌入式 Quiver 仪表板。按照以下说明设置仪表板中显示的时间序列图表和指标卡片。
1. 使用 Flight Sensor 对象类型创建 Quiver 分析
使用 Flight Sensor 对象集
通过从顶部菜单栏选择 Objects 并搜索 Flight Sensor 对象类型,创建一个新的 Quiver 分析,并使用 Flight Sensor 对象类型集。选择 Add object set 将对象集表格添加到画布。
为航班 ID 添加两个字符串参数
- 从屏幕左侧选择 (x) 打开 Parameters 配置。
- 选择 + 添加一个参数,然后从下拉菜单中选择 String。该字符串参数将代表航班 ID,您将检索具有该
flight_id属性的Flight Sensor对象。 - 将字符串参数重命名为 "Flight Id" 以便于跟踪。
- 对第二个航班 ID 重复步骤 1-3,并将其标记为 "Flight Id 2"。
为传感器名称添加一个字符串参数
- 导航到屏幕左侧。
- 选择 + 添加一个参数,然后从下拉菜单中选择 String。该字符串参数将代表传感器名称,您将筛选与从 Workshop 模块传入的传感器名称匹配的
Flight Sensor对象。 - 将字符串参数重命名为 "Sensor name" 以便于跟踪。
为所有参数添加对象集筛选条件
- 将鼠标悬停在
Flight Sensor对象集表格上以显示 Search 菜单,或选择 Search cards 添加一个筛选对象集卡片。此卡片将按选定的flight id筛选传感器对象。有关更多信息,请查阅我们的对象集筛选文档。
- 通过选择 Add a filter to limit your resulting object set 添加一个筛选条件,然后选择 ...where flight id is 选项。
- 在下拉菜单中选择 String 变量,然后选择您在上一步中创建的
Flight Id 1字符串参数。 - 通过选择 Add a filter to limit your resulting object set 添加另一个筛选条件,然后选择 ...where series name is 选项。
- 从下拉菜单中选择 is(exact match),然后选择 String 变量。
- 选择您之前创建的
Sensor name字符串参数。
添加航班 ID 的分组时间序列图
- 将鼠标悬停在筛选对象集卡片上以显示 Search 菜单,或选择 Search cards 添加一个分组时间序列图。这将绘制对象上的所有时间序列属性并将其显示在图表上。在这种情况下,您预计此分组时间序列图将仅包含一个传感器对象的一个时间序列。
- 将鼠标悬停在时间序列图配置上以找到 Configure plot 图标并打开配置面板。
- 在 Batch Time Series Options 下,找到 Time series column 下拉菜单并选择 Default time series property。这将确保图表显示对象名称而不是系列 ID 列的名称。
- 对为
Flight Id 2参数创建的筛选卡片重复这些步骤。然后,您应该有两个单独的分组时间序列图表。
叠加图表并添加相对时间偏移
- 选择分组时间序列图以访问快速操作菜单。
- 选择 Transform 并搜索 Relative time series 卡片。
- 对第二个分组时间序列图重复此操作。
- 然后,在第二个分组时间序列图中,选择 Configure plot 选项并导航到配置面板的 Display 选项卡。
- 在 Colors 下,选择一种颜色以区别于之前的图表。在此示例中,选择橙色以优化与蓝色的视觉对比。
- 选择其中一个分组时间序列图并将其拖到另一个图表上,以合并为一个图表。您可能会注意到图表似乎消失了。您需要使图表使用正确的范围才能一起显示。
- 选择 Relative time series 卡片的图表配置。在 Relative Time Options 下,启用 Use source extent 设置。确保 Relative to 下拉菜单设置为 Start。
将图表添加到新仪表板
- 从左侧的 Dashboards 选项卡中选择 + Create new dashboard。
- 通过从相应卡片中选择 Add to new dashboard 来添加时间序列图表。
2. 配置新仪表板
通过选择 View dashboard 导航到仪表板,或从屏幕左侧的 Dashboard 选项卡访问它。
![]()
调整卡片大小并命名
确保对象选择卡片位于仪表板顶部,并将小部件重命名为有用的名称。例如,"Select an object" 和 "Flight sensor rolling 10 minute aggregate"。
向仪表板添加字符串输入
选择仪表板中的 Settings 齿轮图标以打开仪表板配置面板,并添加以下字符串输入:
Flight Id 1的输入。Flight Id 2的输入。Sensor name的输入。
发布仪表板
重命名您的仪表板,以便可以从 Workshop 模块轻松搜索到它。在此示例中,仪表板被命名为 [Example] Sensor Object Time Series Data | Flight Sensor Reading Comparison。
有关如何创建和自定义 Quiver 仪表板的更多信息,请查阅我们的 Quiver 仪表板文档。
第四部分:在 Workshop 中嵌入您的仪表板
- 返回到您在本指南前面创建的 Workshop 模块。
- 选择添加一个 Quiver Dashboard 小部件,然后选择您的新仪表板。
如有必要,您可以通过编辑 Workshop 模块、选择 Quiver Dashboard 小部件的配置并选择查看 Quiver 仪表板来导航回仪表板并开始分析。然后选择 Edit 查看支持的分析。
有关如何在 Workshop 中自定义 Quiver 仪表板的更多信息,请查阅我们的文档。