Use time series properties on objects in a Workshop module and Quiver analysis(在 Workshop 模块和 Quiver 分析中使用对象的时间序列属性)
The Workshop module built in this example ([Example] Time Series Properties on Objects | Delay TSP) is built on the aviation ontology in the reference ontology, which may or may not be available on your enrollment. For more information on the relationships between those objects, see the use case overview. This example module will be a reference for you as you configure your own Workshop module using time series properties.
Select objects in Workshop
The Selecting an Object section of the module contains two standard Workshop widget features. A brief description of the widgets are explained below, and you can learn about general functionality in Workshop in our documentation. Follow the steps below to configure these widgets before adding time series properties to the module.
Part I: Add the Filter List widget
The Filter widget should take the Flight object set and apply filters based on the Airport properties. The filter widget should output an Airport filter that can be used in the Object Table widget.
- In your Workshop module, choose to + Add widget, then select the Filter List widget.
- In the right side configuration of the filter list widget, create a new variable for the Object set Input and name it "All airports". The Starting object set should should use the
[Example] Airportobject type.
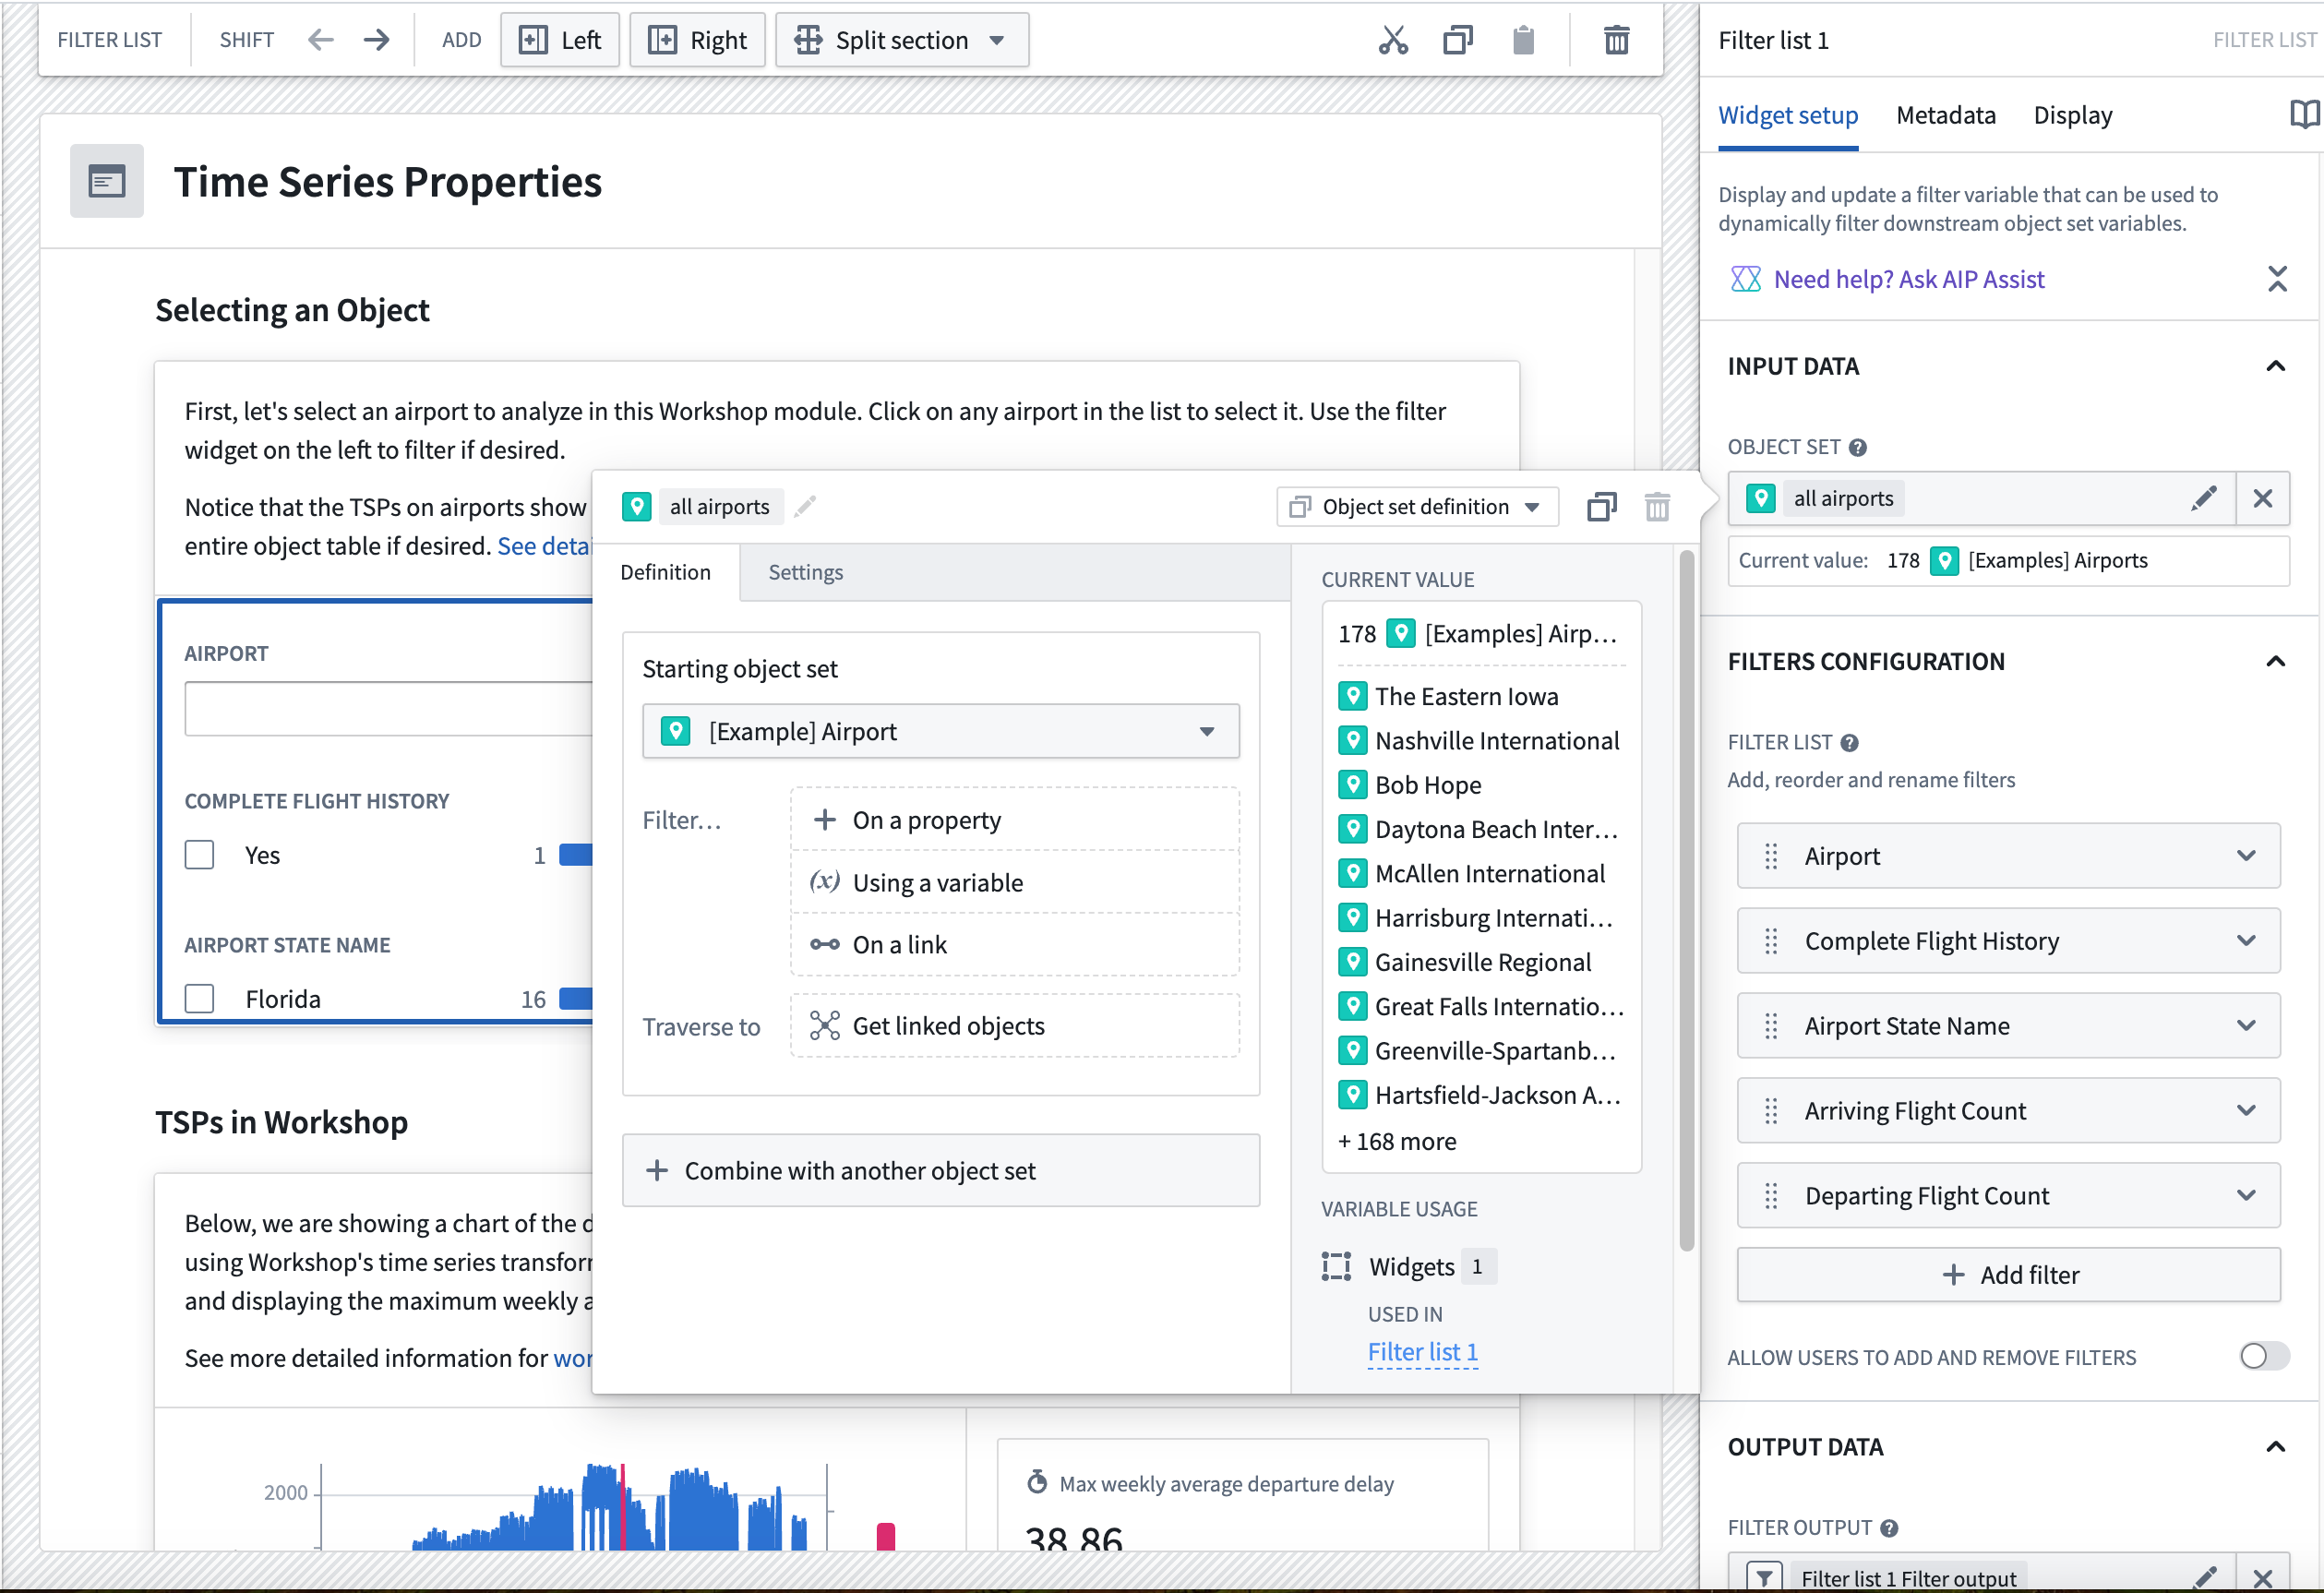
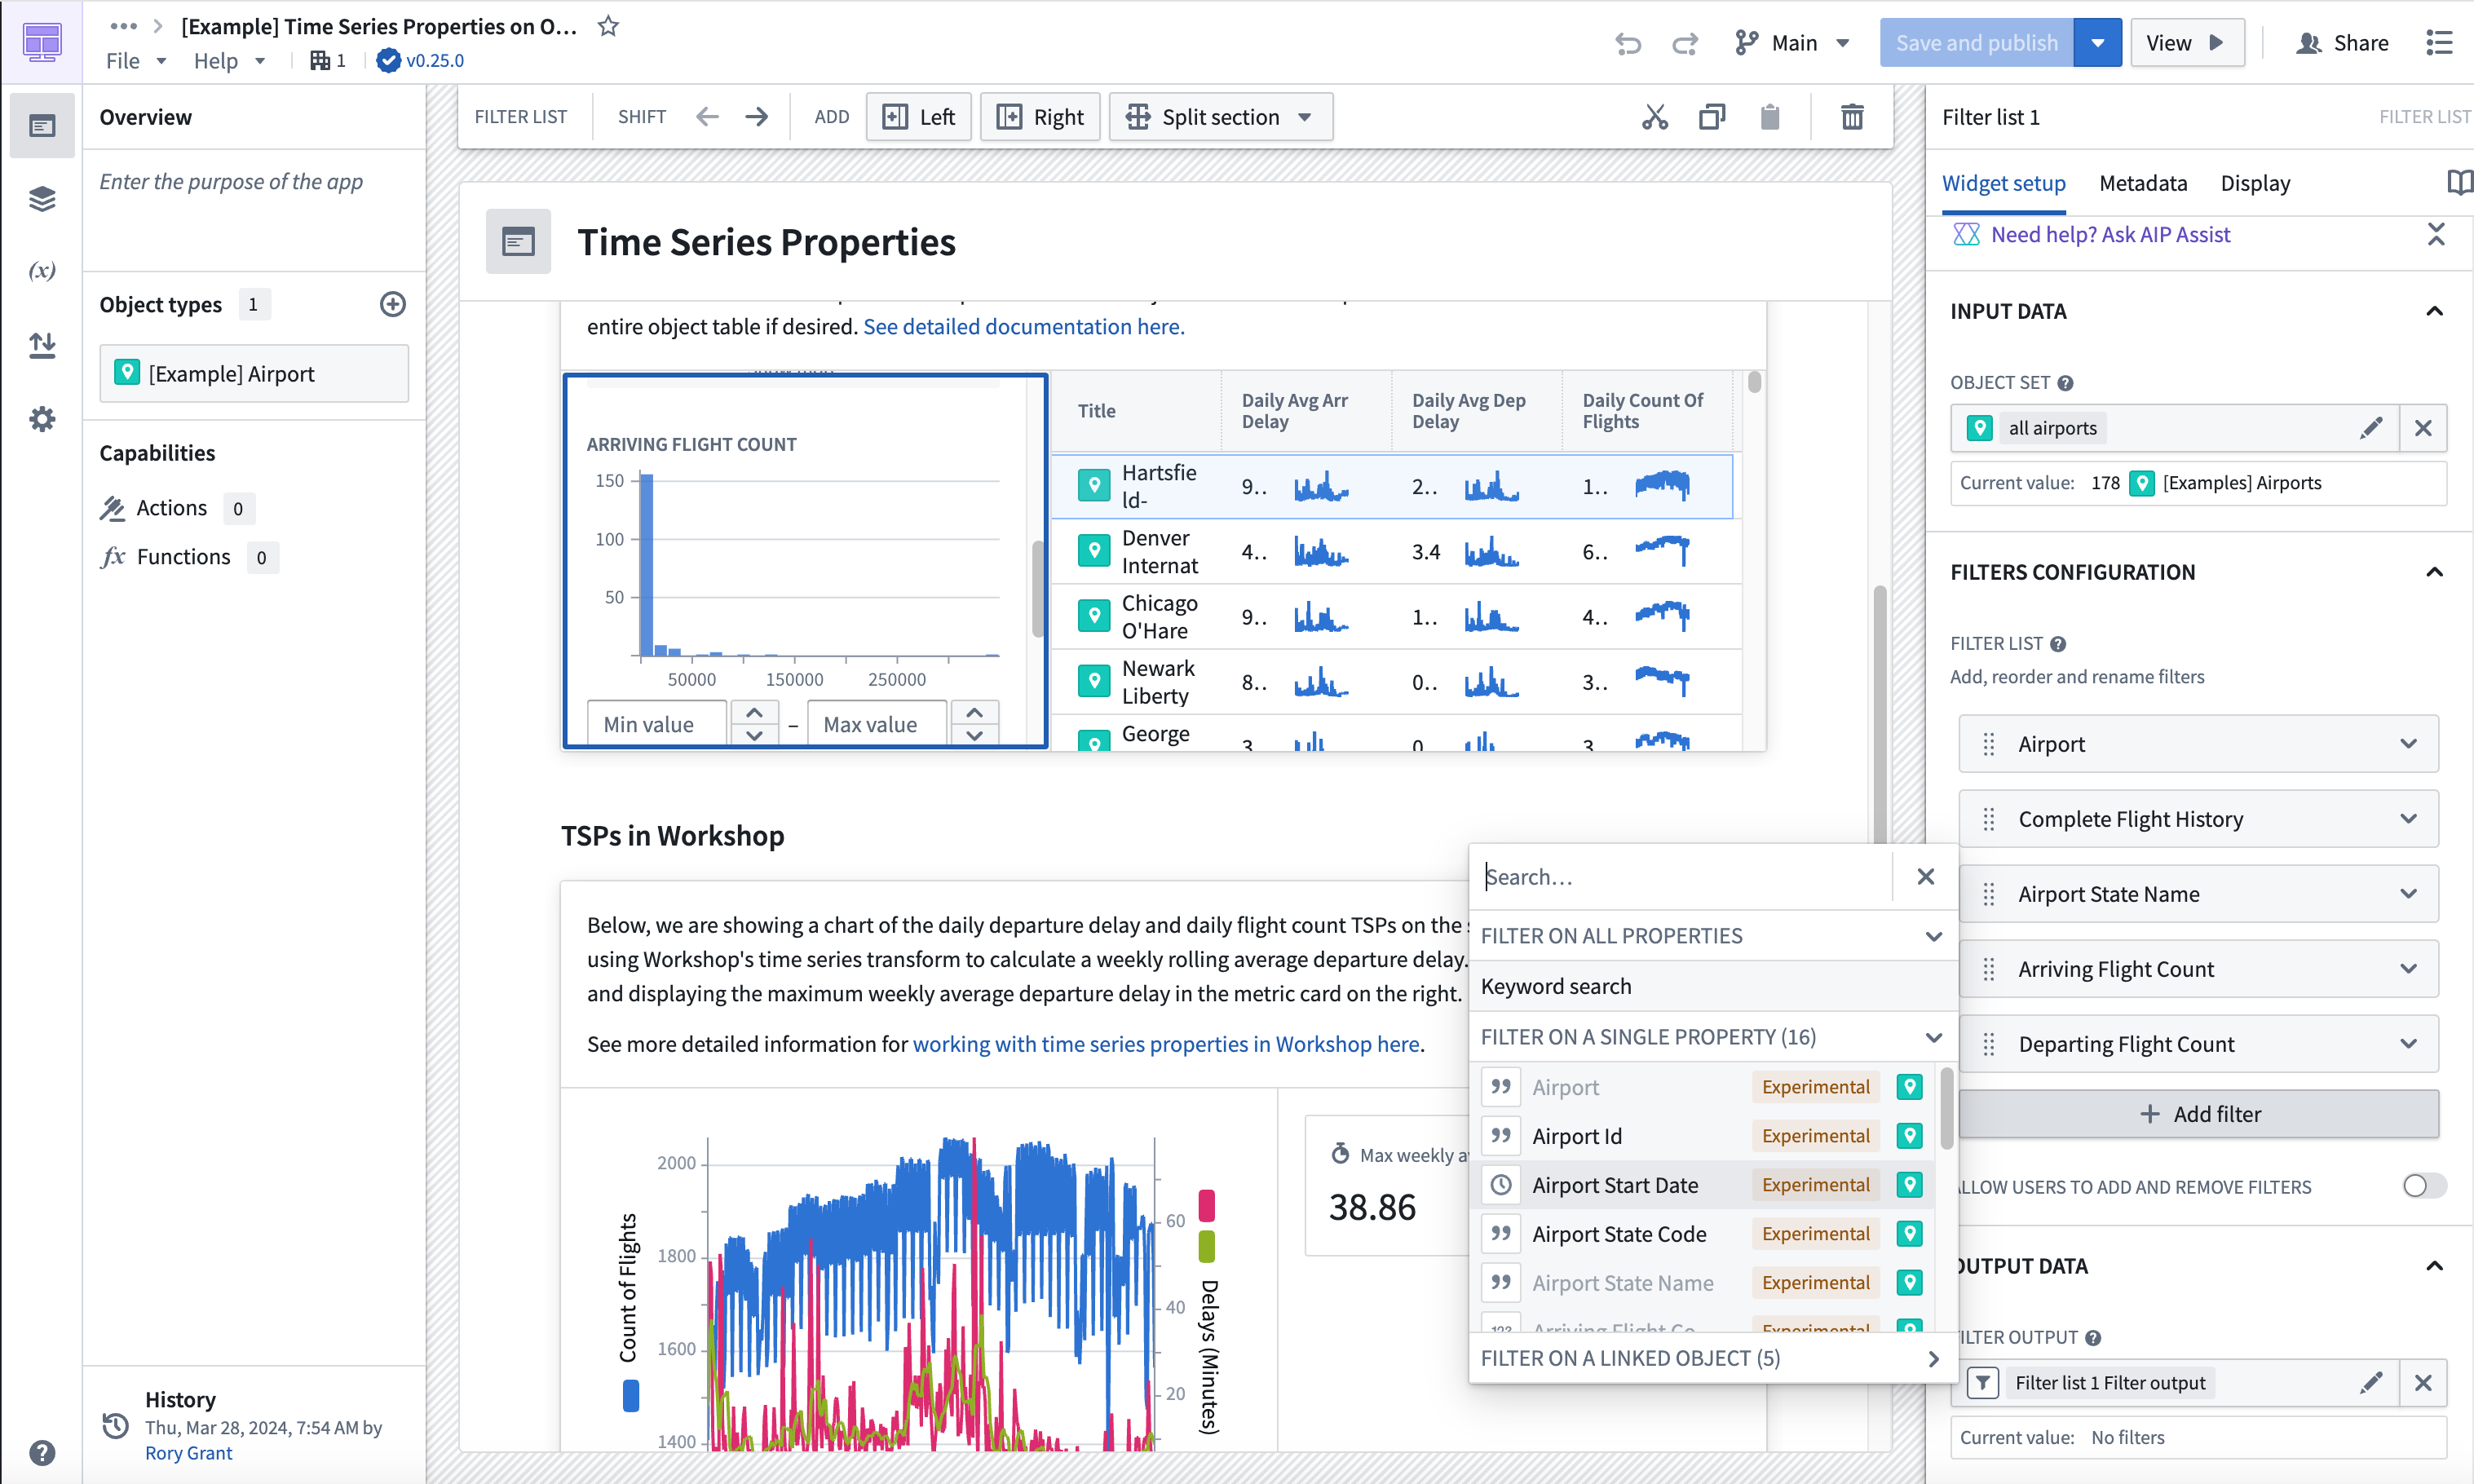
- Add the
Airport,Complete Flight History,Airport State Name,Arriving Flight Count, andDeparting Flight Countproperties by selecting the + Add filter button.
- Move down to the Filter output field, and you will see that a filter output has already been created for you. Give it a descriptive name like "airport filter"; no other configuration is required.
Part II: Add the Object Table widget
The Object Table widget will enable users to filter down on the object set and select an airport for further investigation.
- In your Workshop module, choose to + Add widget, then select the Object Table widget.
- In the Input data section, create a new variable and name it "filtered airports". Under Starting object set, select the Existing object set variable for
all airports.
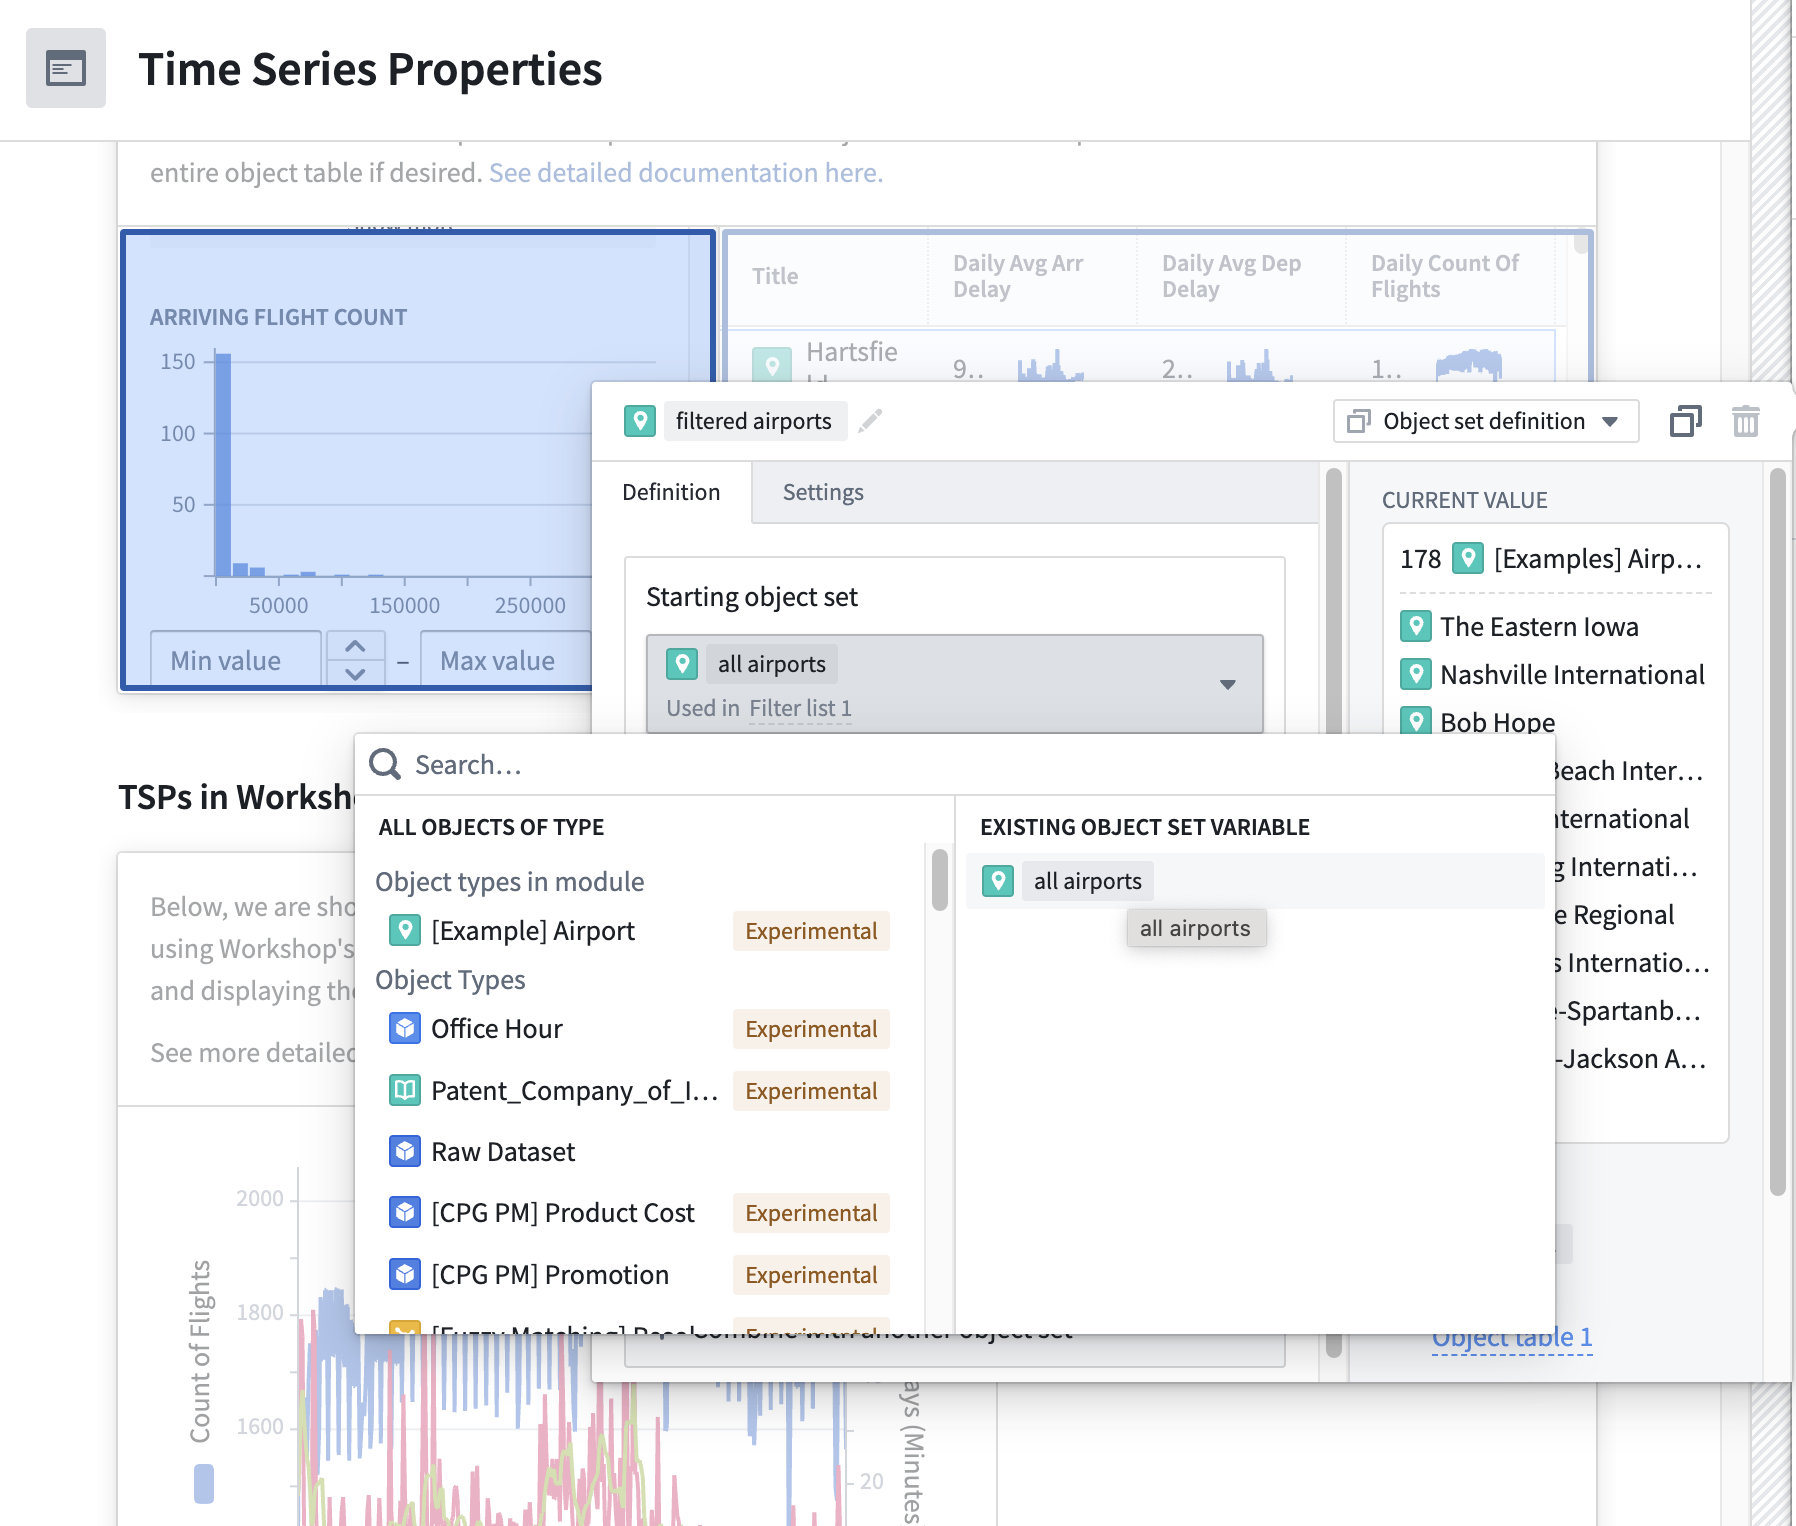
- In the Filter... section, select Using a variable and choose the
airport_filtervariable we created as an output for the Filter List widget.
-
In the Column Configuration add the
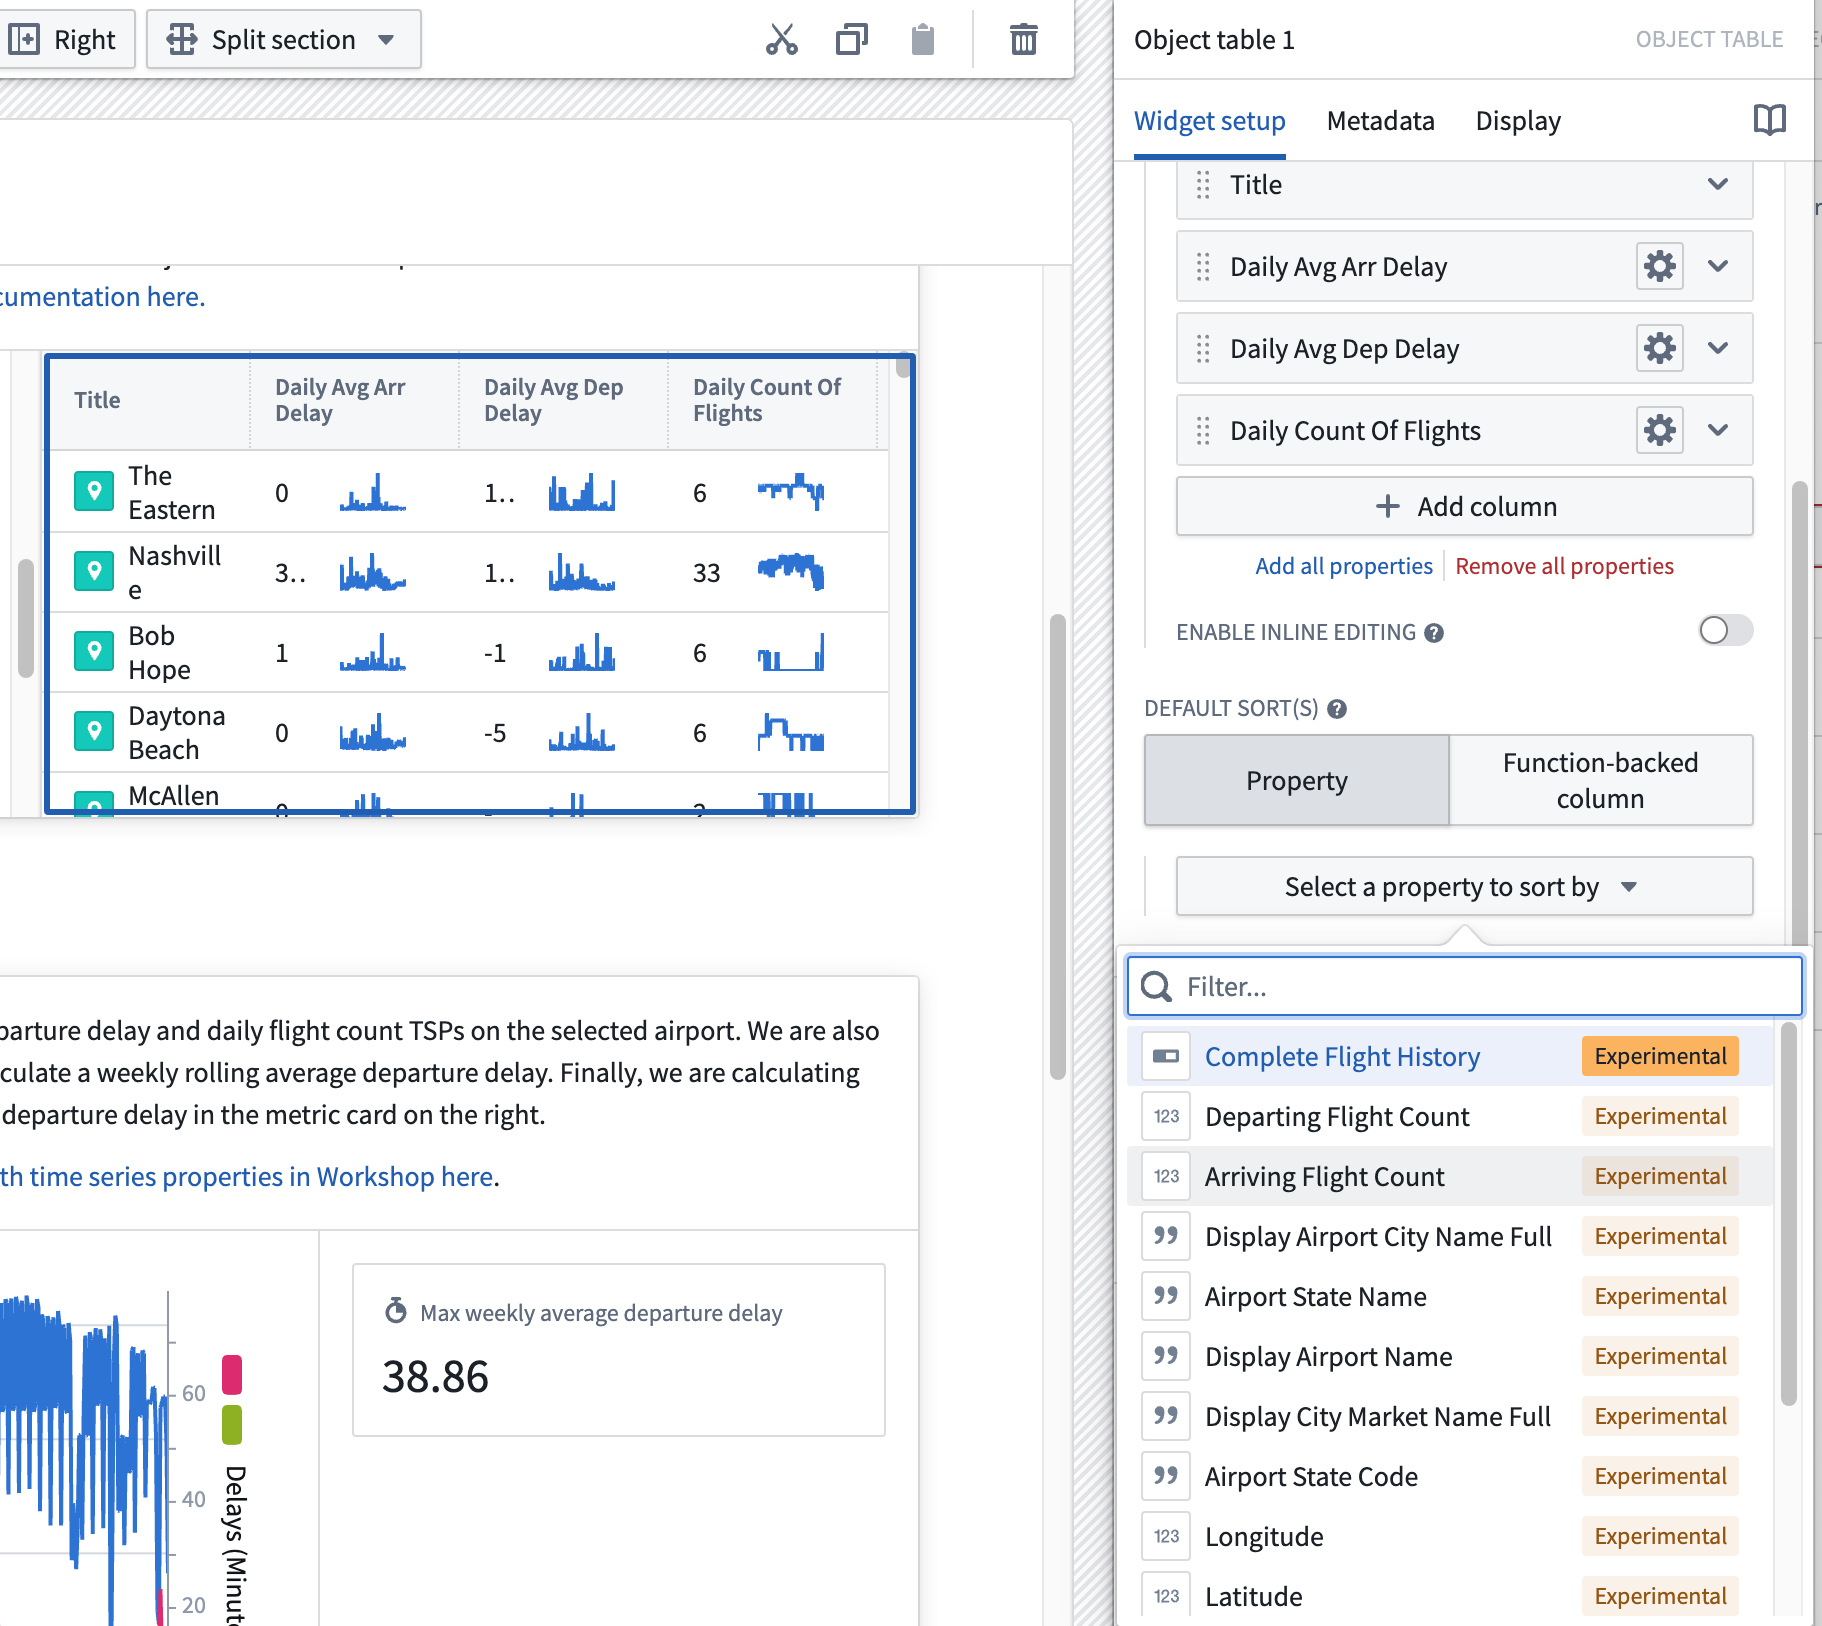
Title,Daily Avg Arr Delay,Daily Avg Dep Delay, andDaily count of flightscolumns by selecting + Add column. -
Configure Default Sort(s) to be a property, and choose Select a property to sort by. Then, choose
Arriving Flight Count.
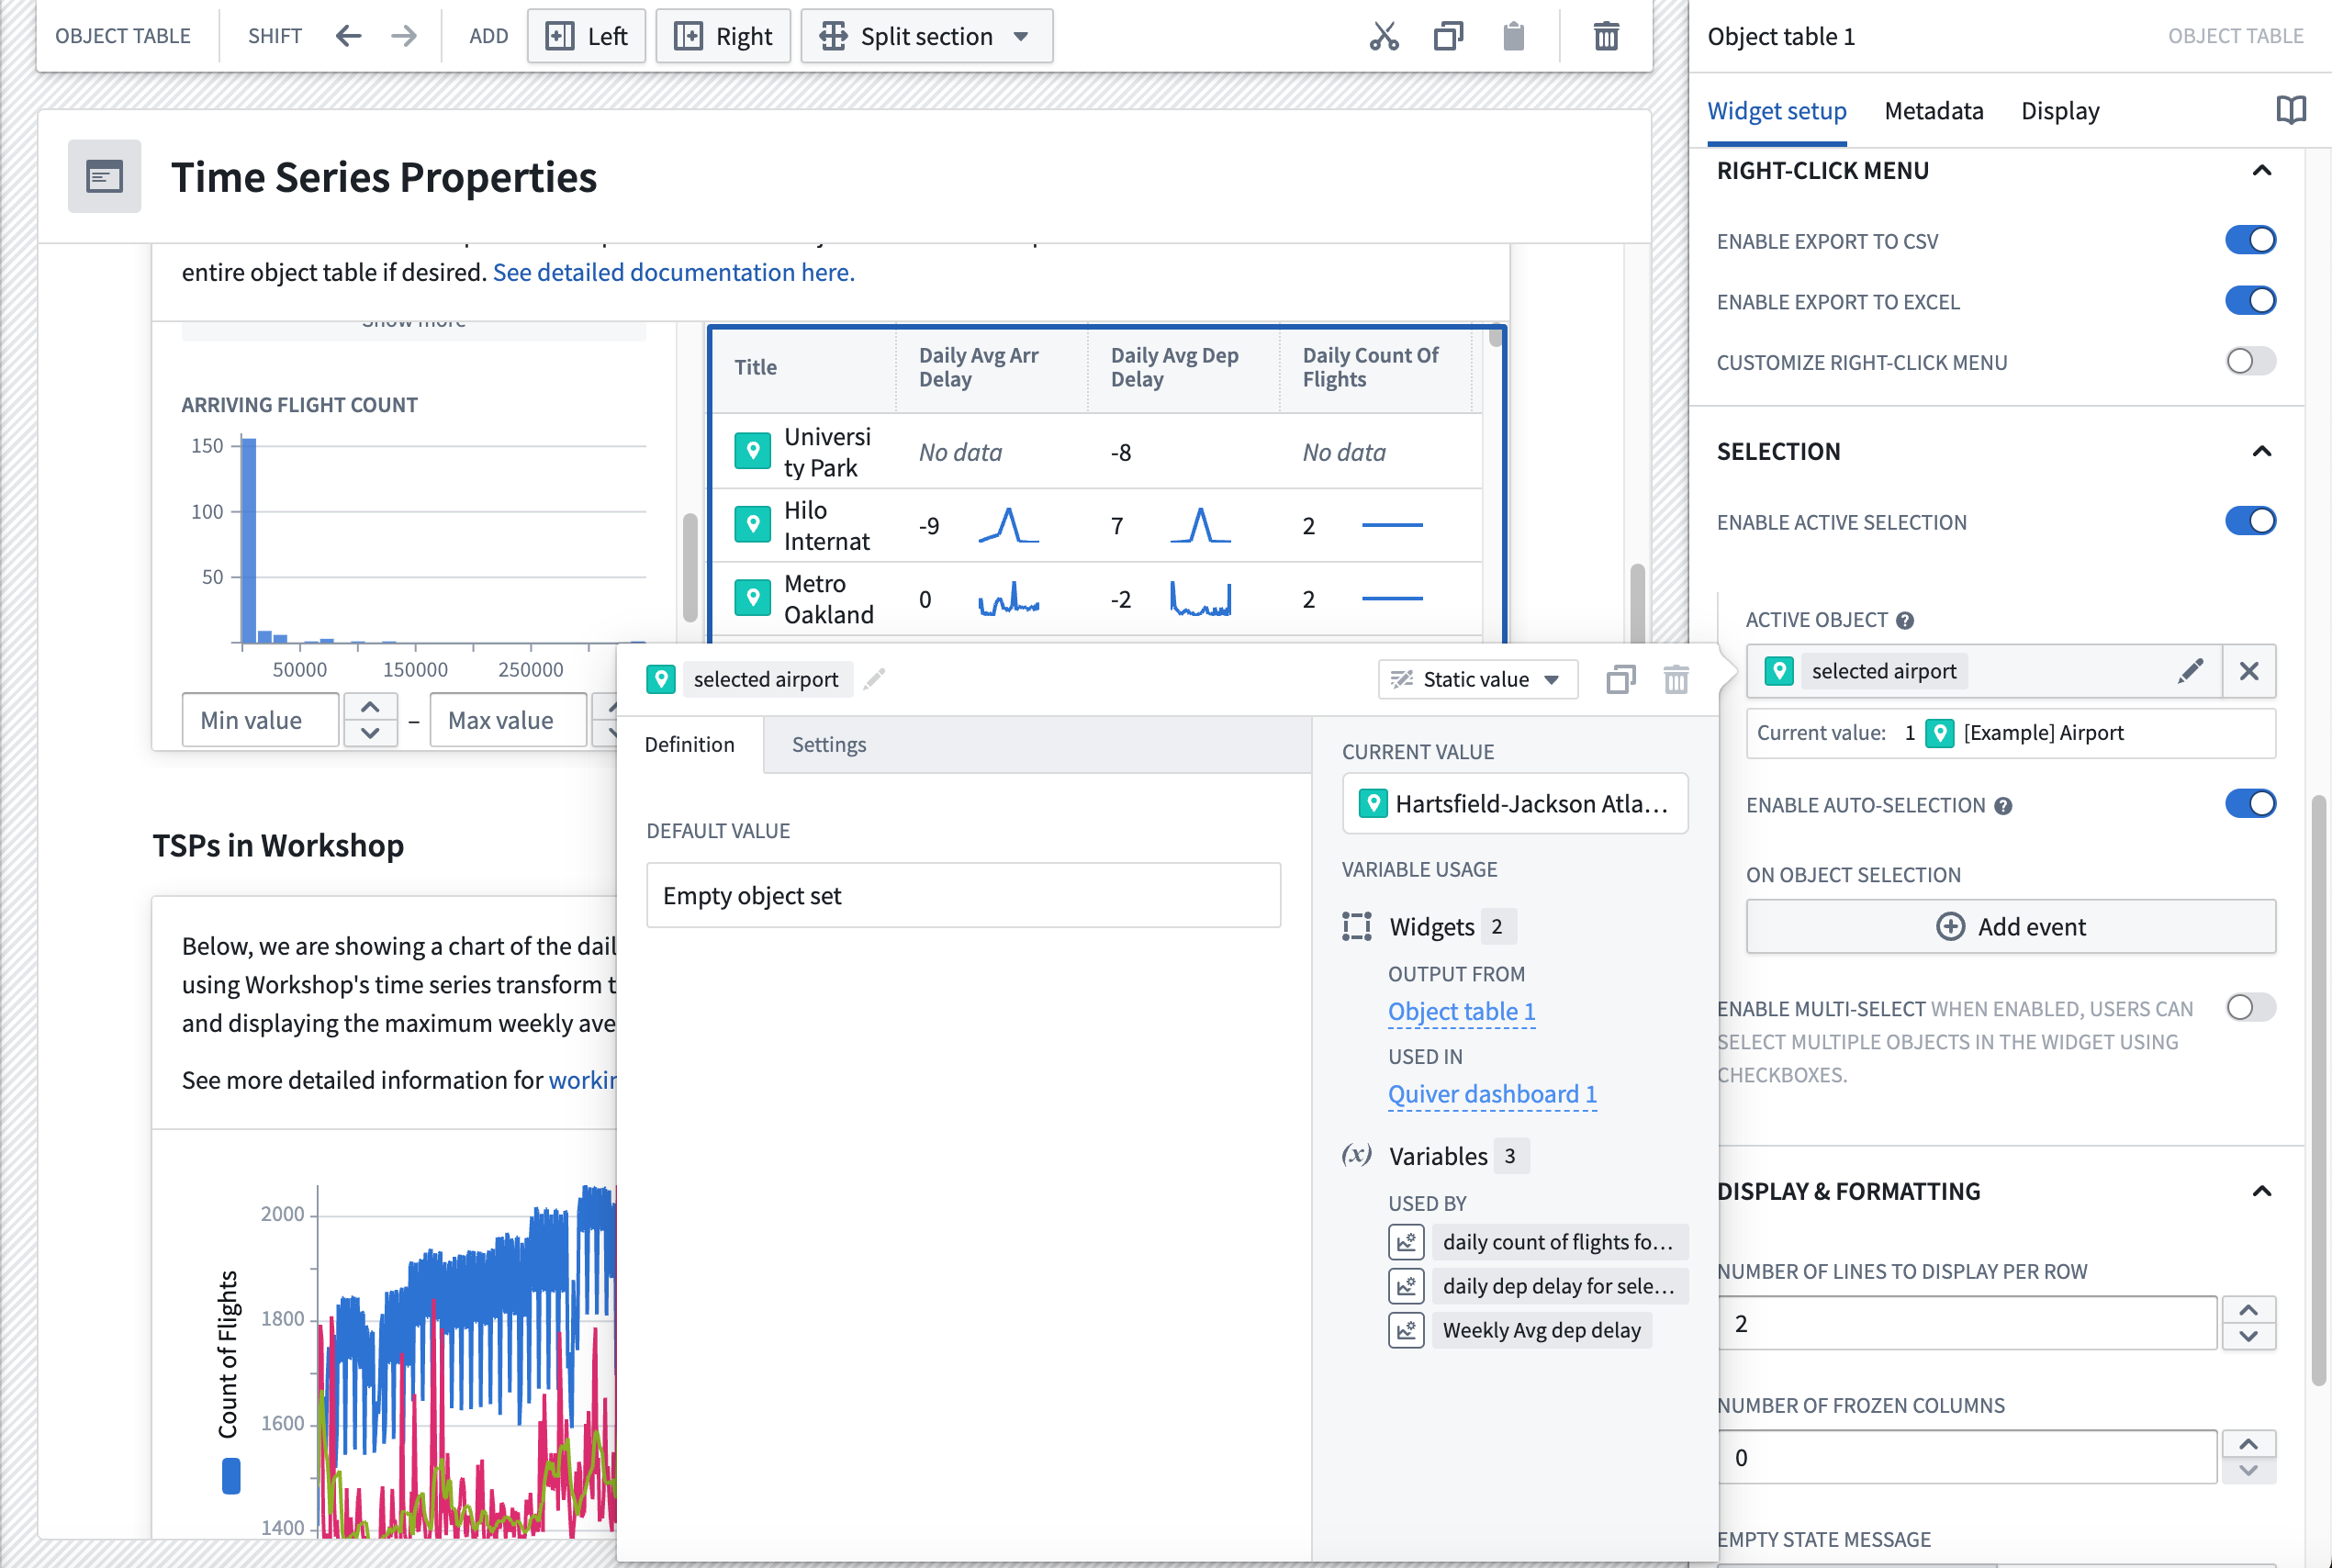
- Set up the output for the selected table in the Selection section of the Object Table configuration. Configure the output to run analysis on the time series properties of the selected airport.
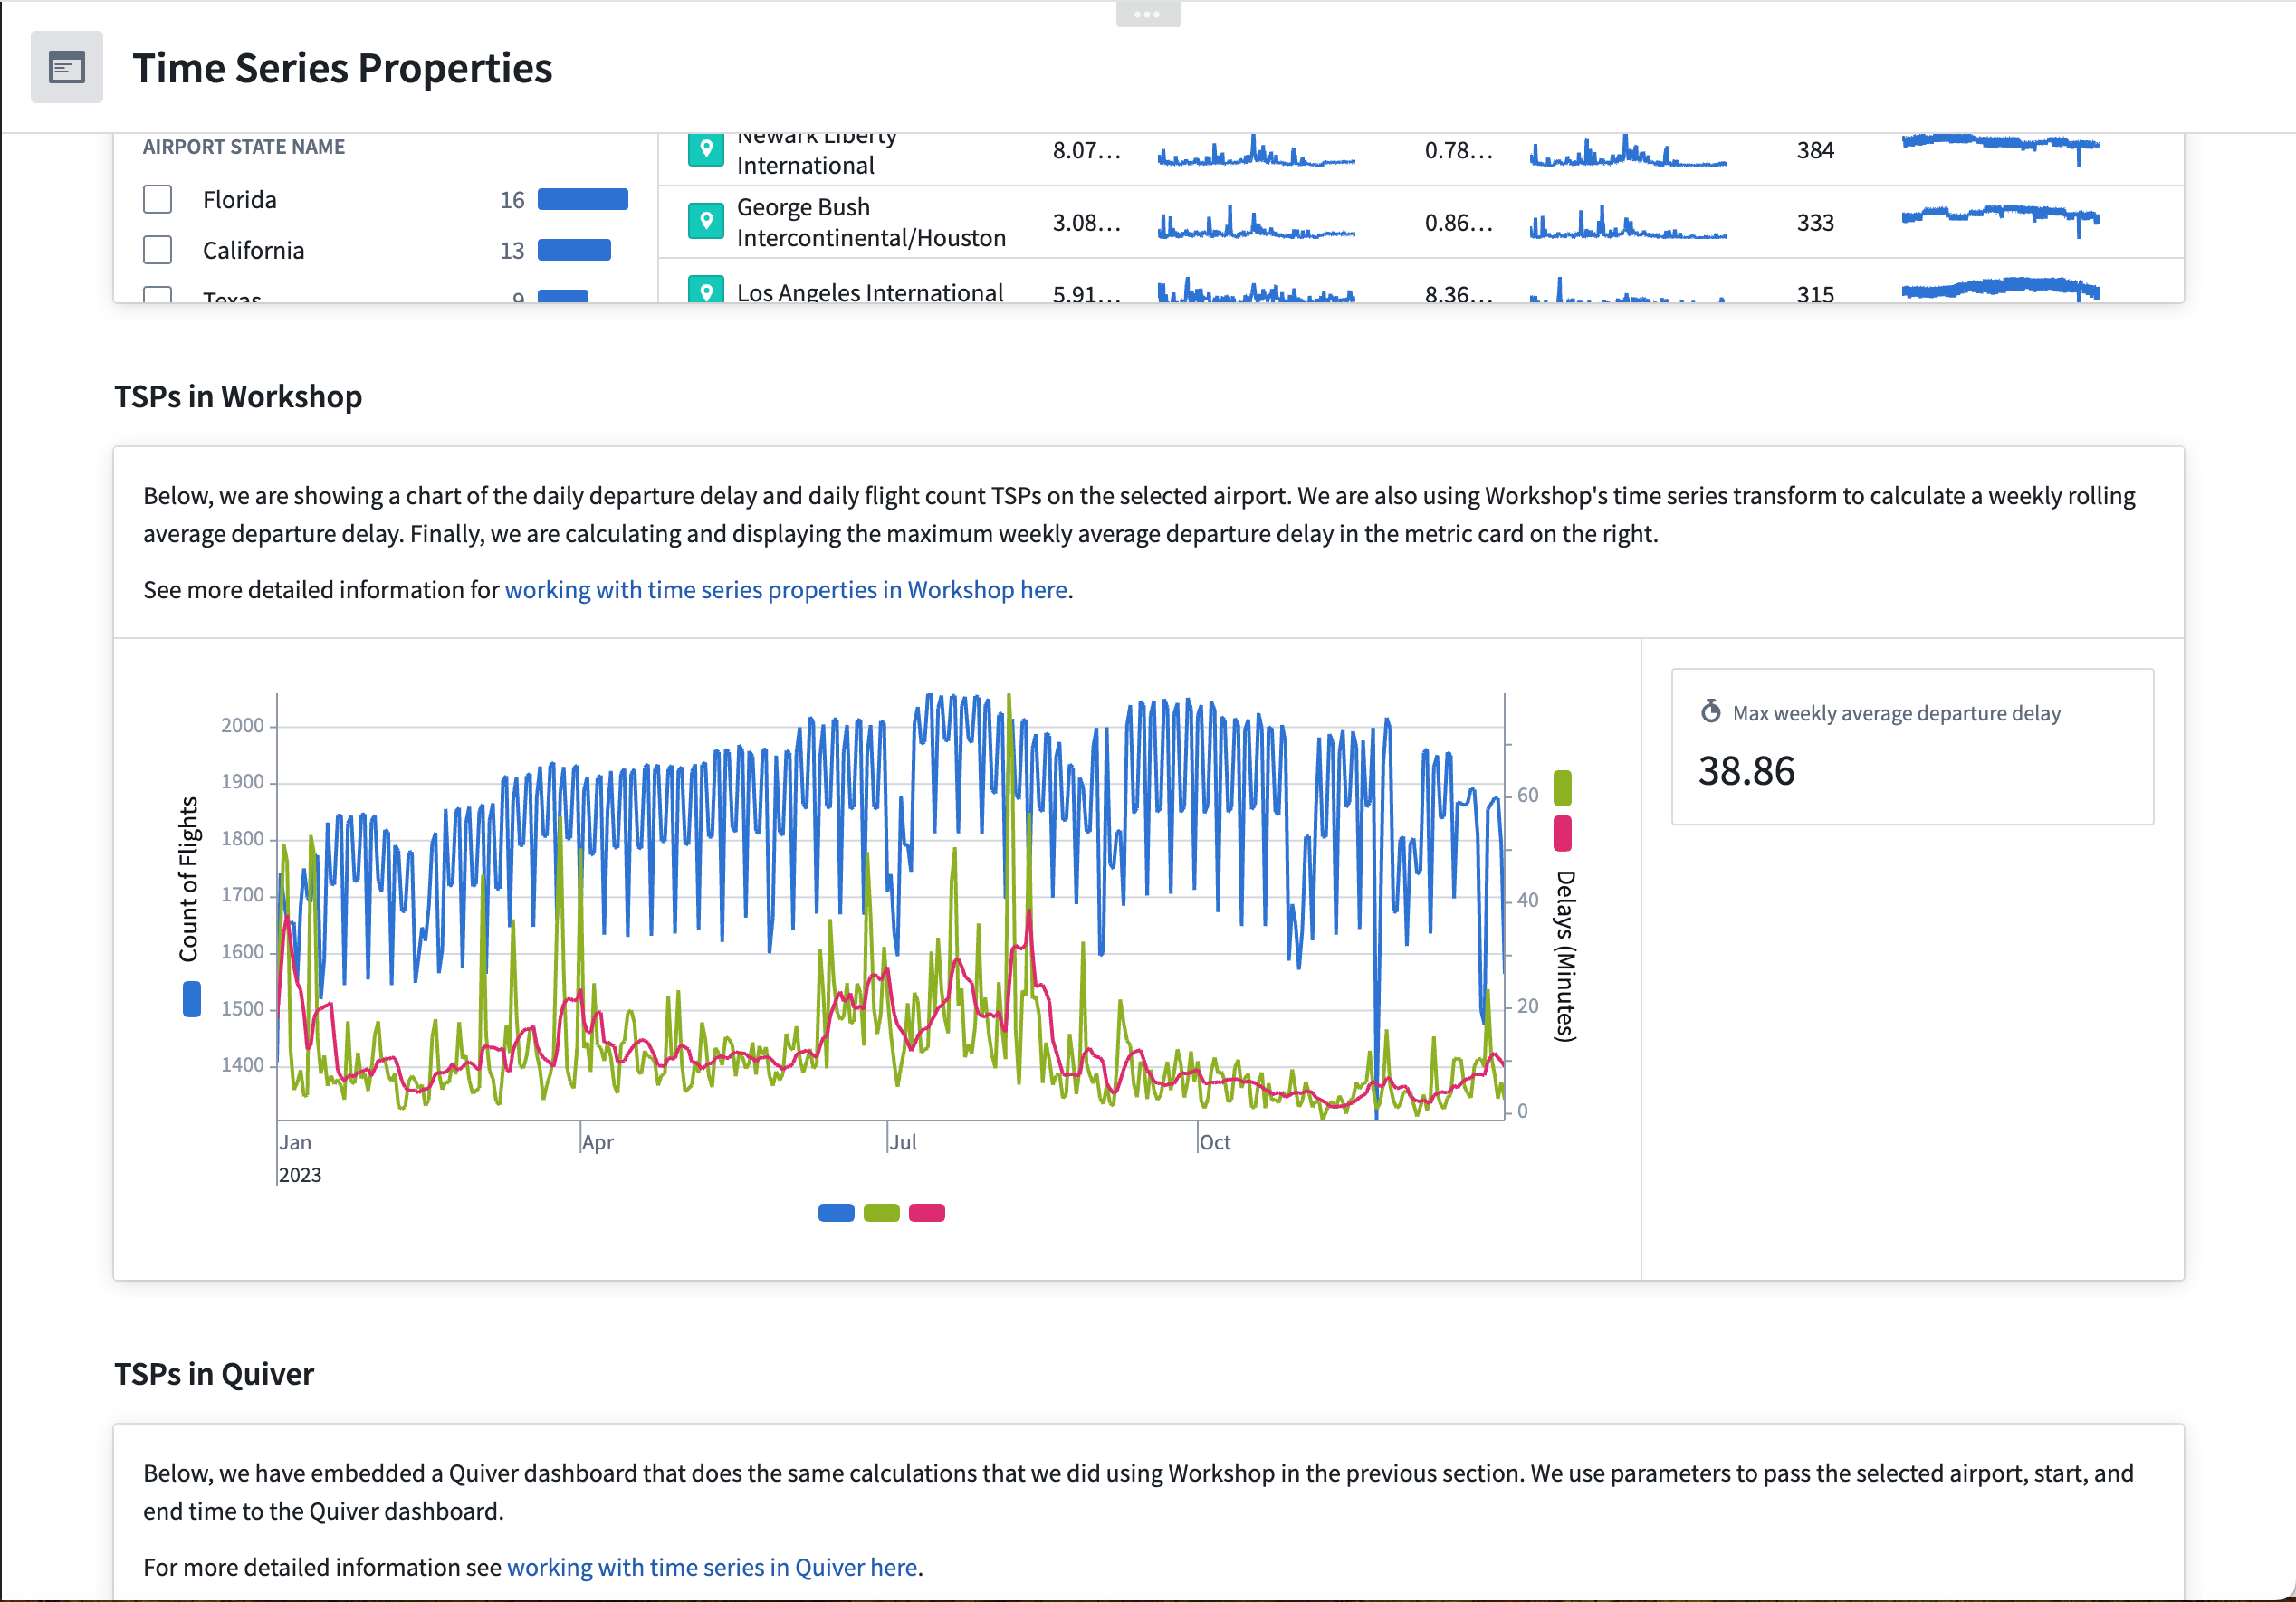
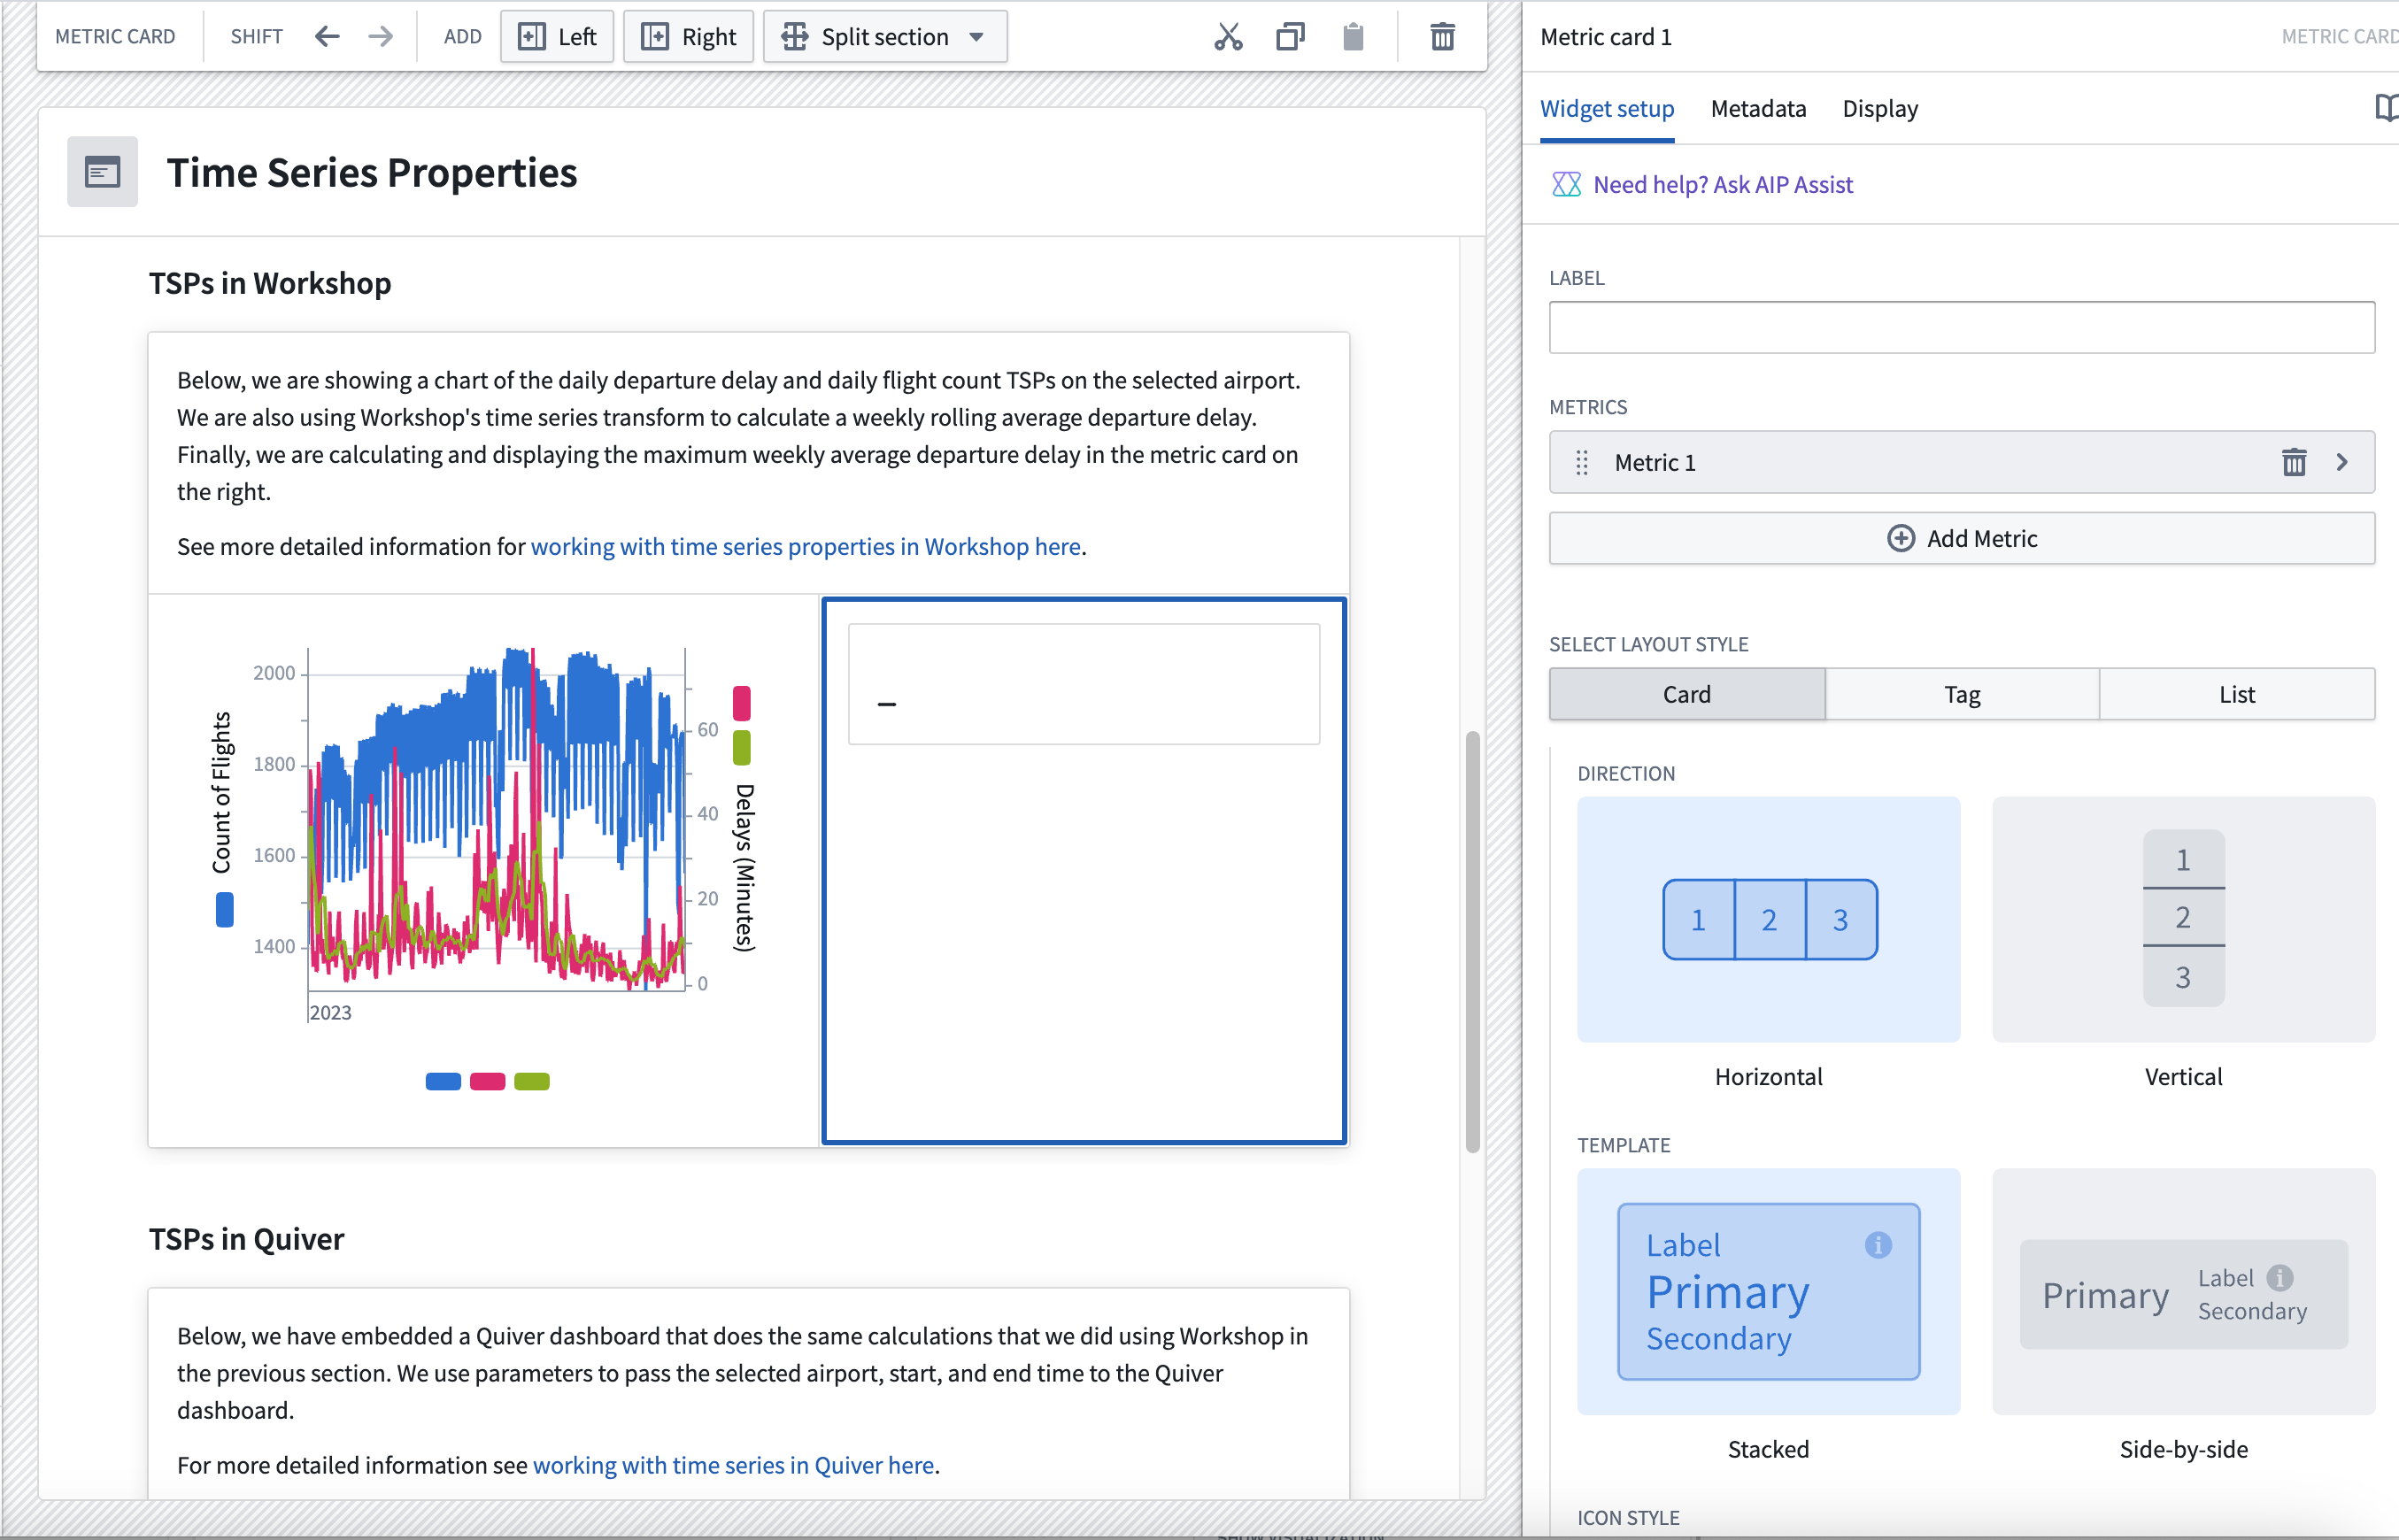
TSPs in Workshop
The TSPs in Workshop section of the module uses the available time series transforms in Workshop. Follow the instructions below to set up the Chart XY and Metric Card widgets shown in the dashboard.
Part I: Add a Chart XY widget
- In your Workshop module, choose to + Add widget, then select the Chart XY widget.
- In the configuration menu to the right, choose to add a plot layer.
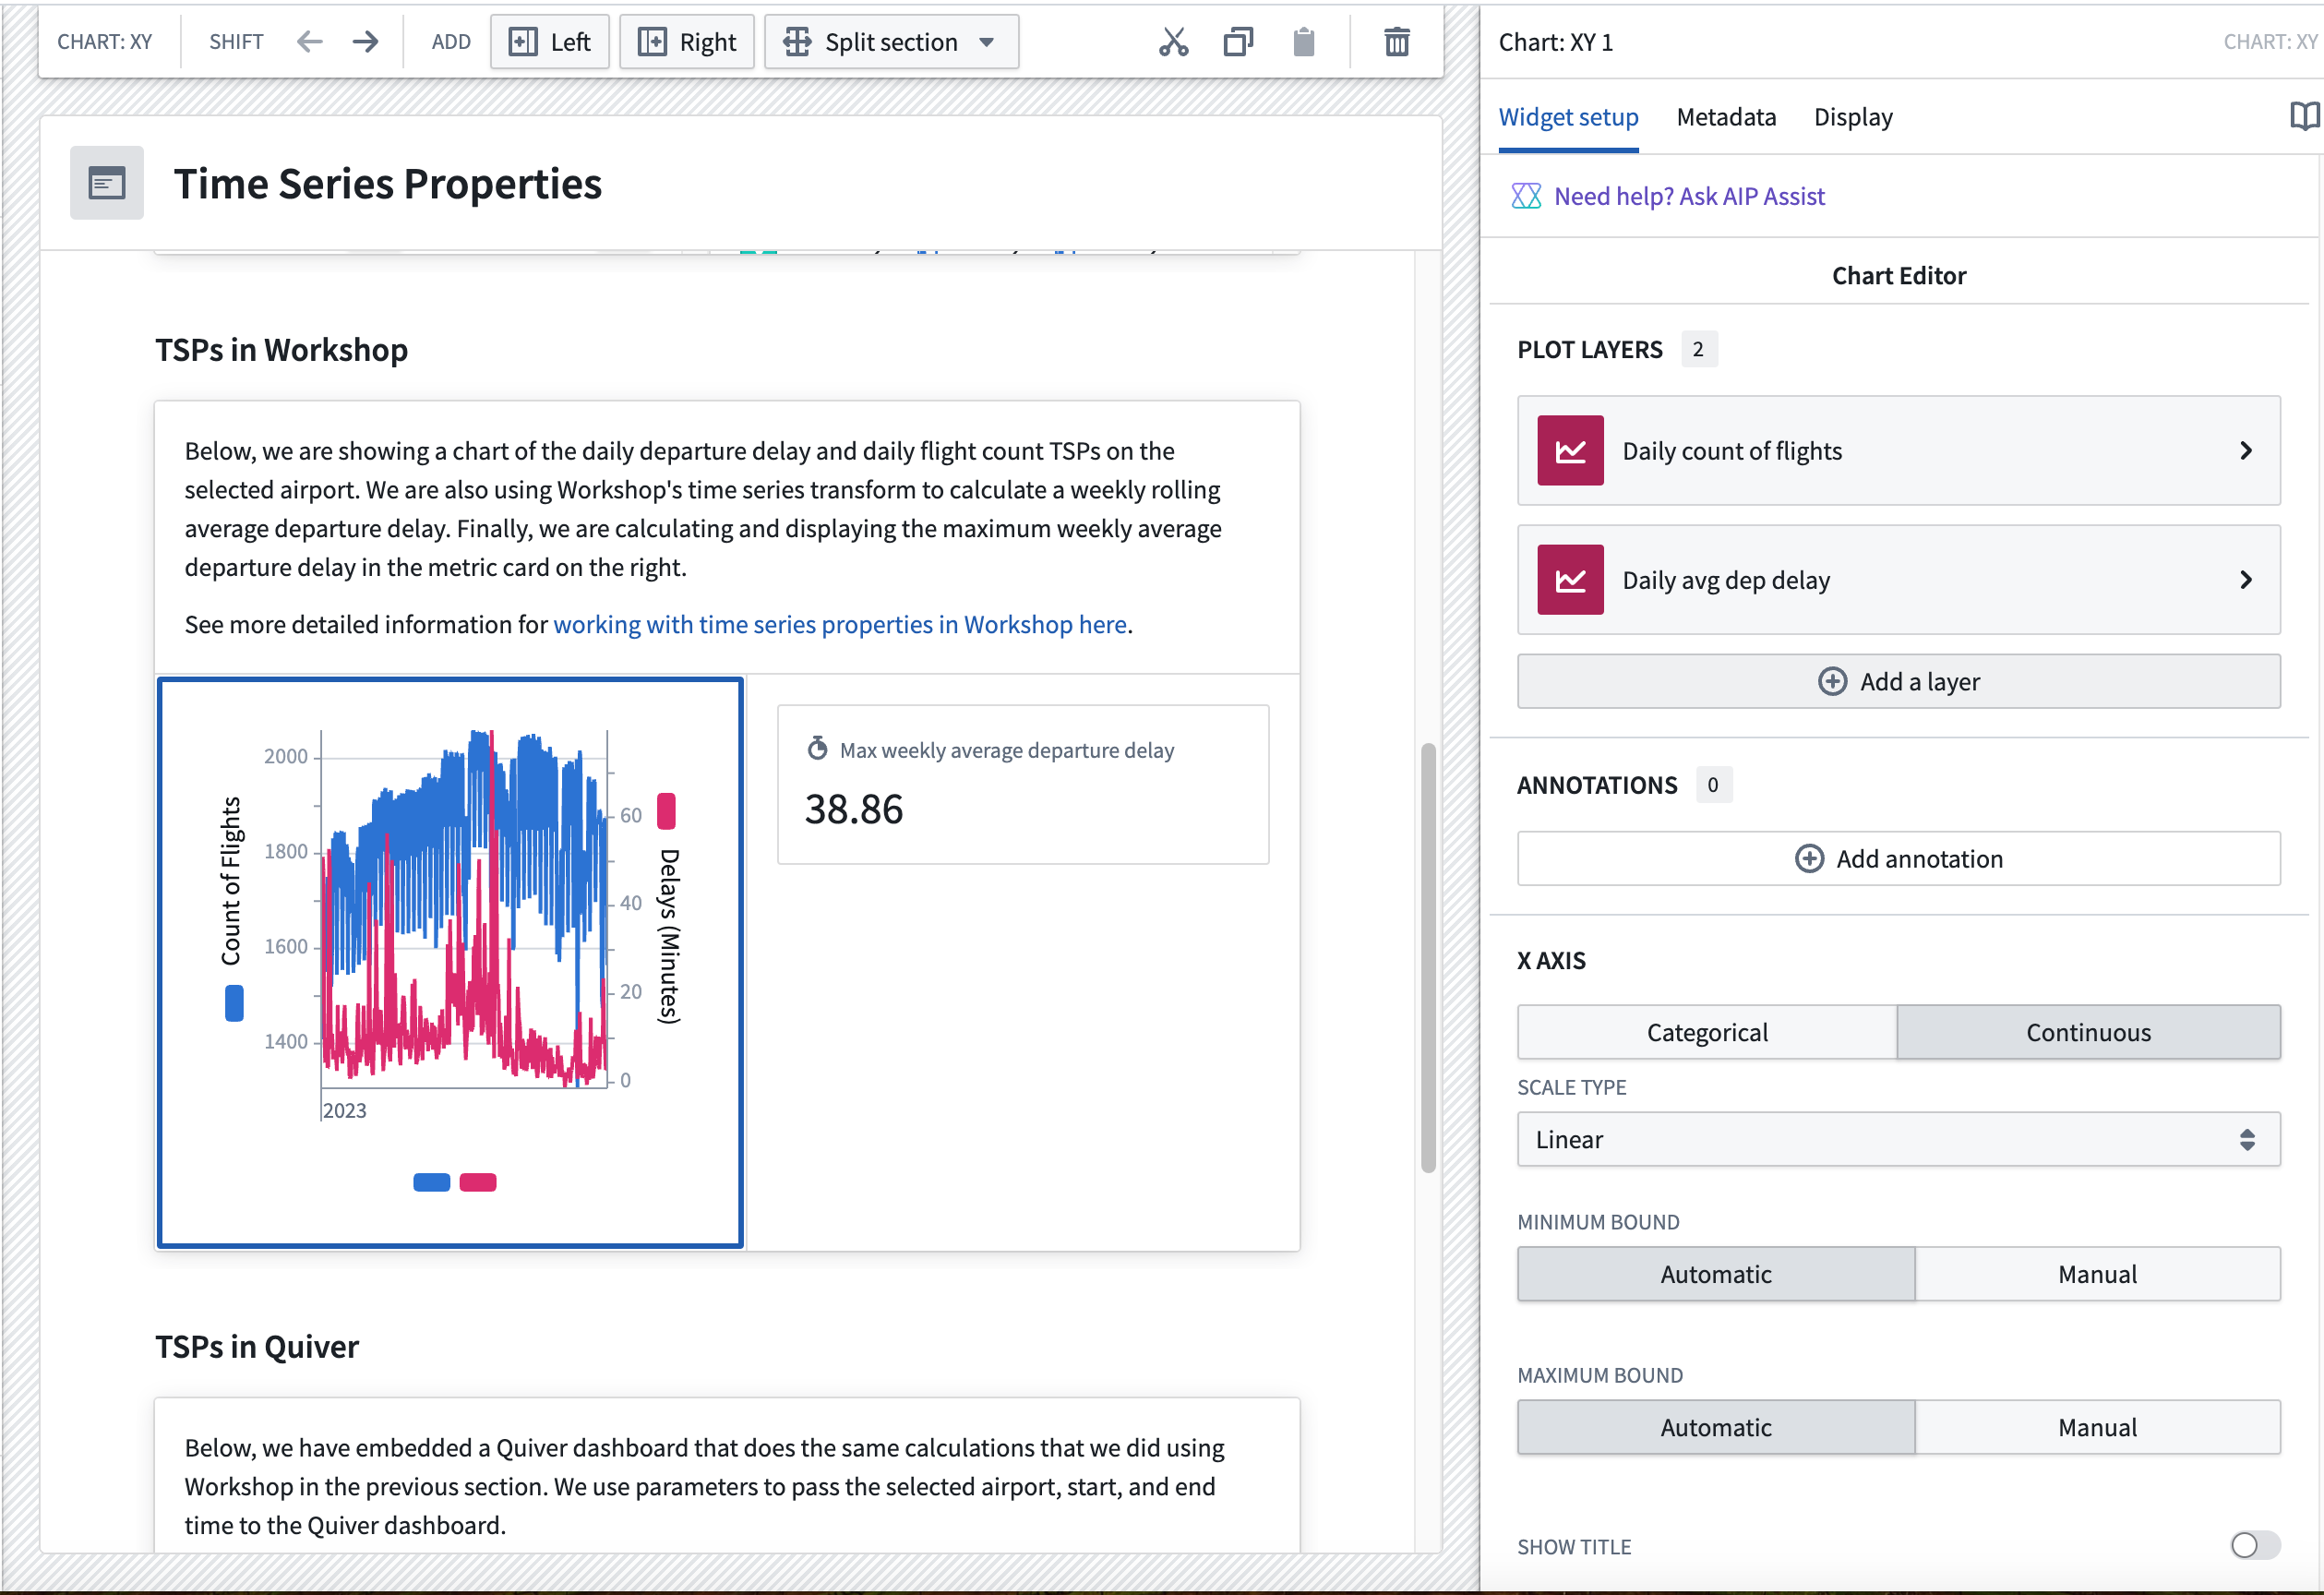
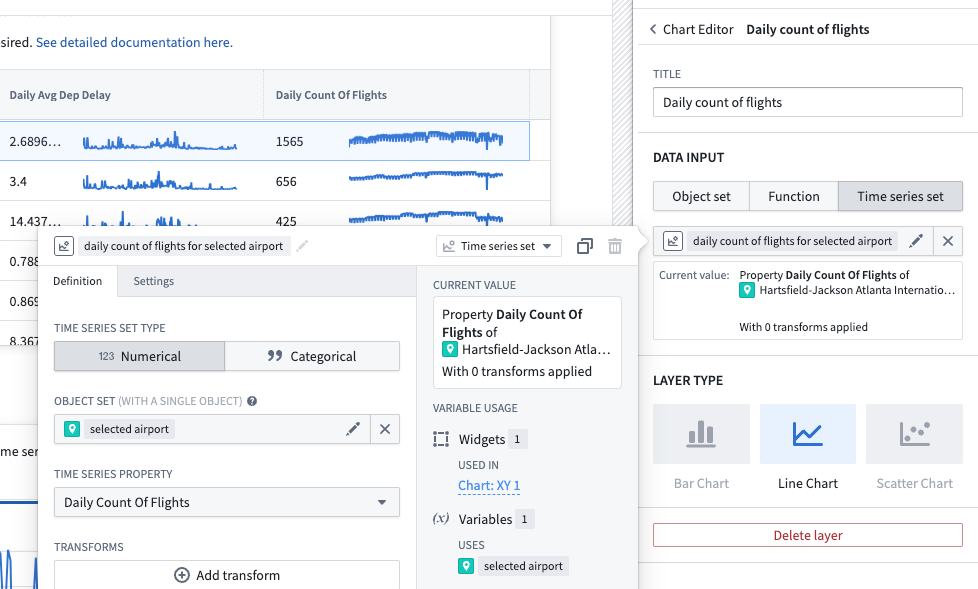
- Select the layer in the menu to configure the data input as a Time series set.
- Create a new variable that contains the
daily count of flights for selected airporttime series property, where the selected airport is the output variable from the Object Table widget. Be sure to give your new variable an understandable name.
- Add another plot layer and variable for the
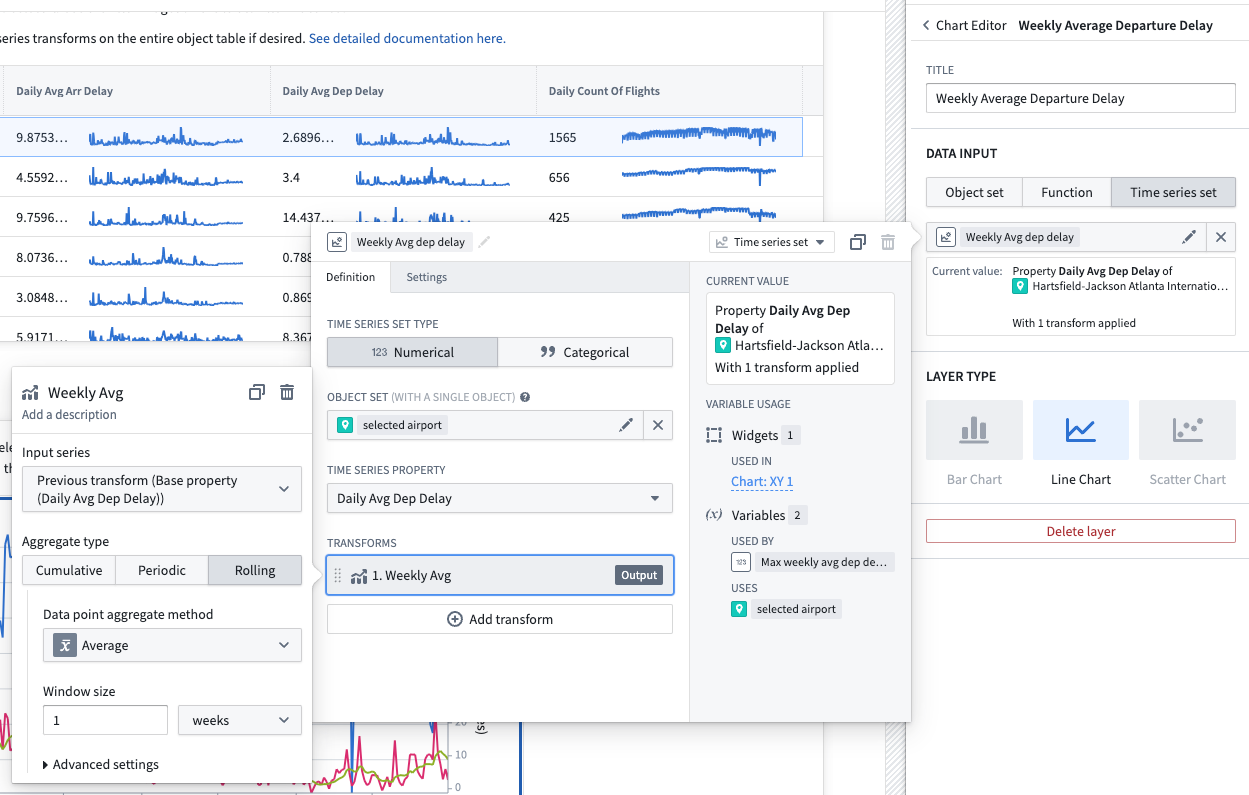
daily dep delay for selected airportTSP. - Add a third plot layer for the
Weekly Avg Dep delayproperty. This time, when setting up the time series set variable, choose to also add a transform. In the transform, select Rolling and then Average over 1 weeks as the aggregation method. Be sure to give your new variable an understandable name.
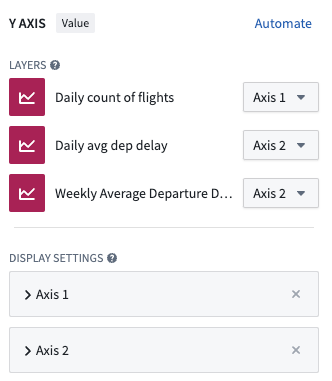
- Ensure the axes are set up so there is an axis for each layer. You can also select where the axis units appear for each plot layer (to the left or right of the chart).
Part II. Add a metric card next to the Chart XY widget
- Add a Metric Card widget.
- In the configuration menu, choose to either Add Metric or use the default that is created when you first add the widget. Then, hover over the metric to open further configuration options, and choose Number as the value type.
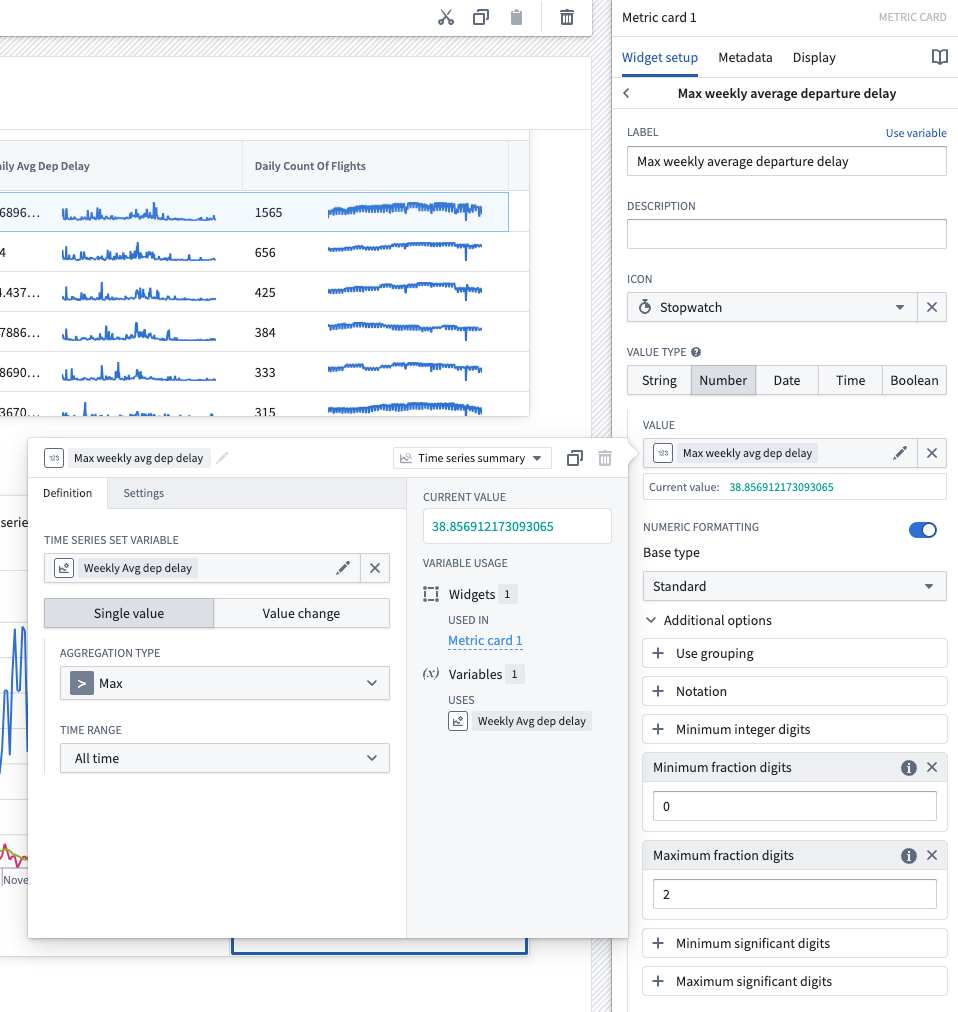
- Choose Select numeric value..., hover over New numeric variable, then choose Time series.
- Select the
Max weekly average departure delayvariable you created when setting up the third plot layer of your Chart XY widget. - Select the Max aggregation type over the All time time range as the single value metric. Be sure to give your new variable an understandable name.
- Set up numeric formatting as desired.
TSPs in Quiver
The following guidances assumes a basic knowledge of navigating Quiver. To learn more about general Quiver functionality, review our documentation.
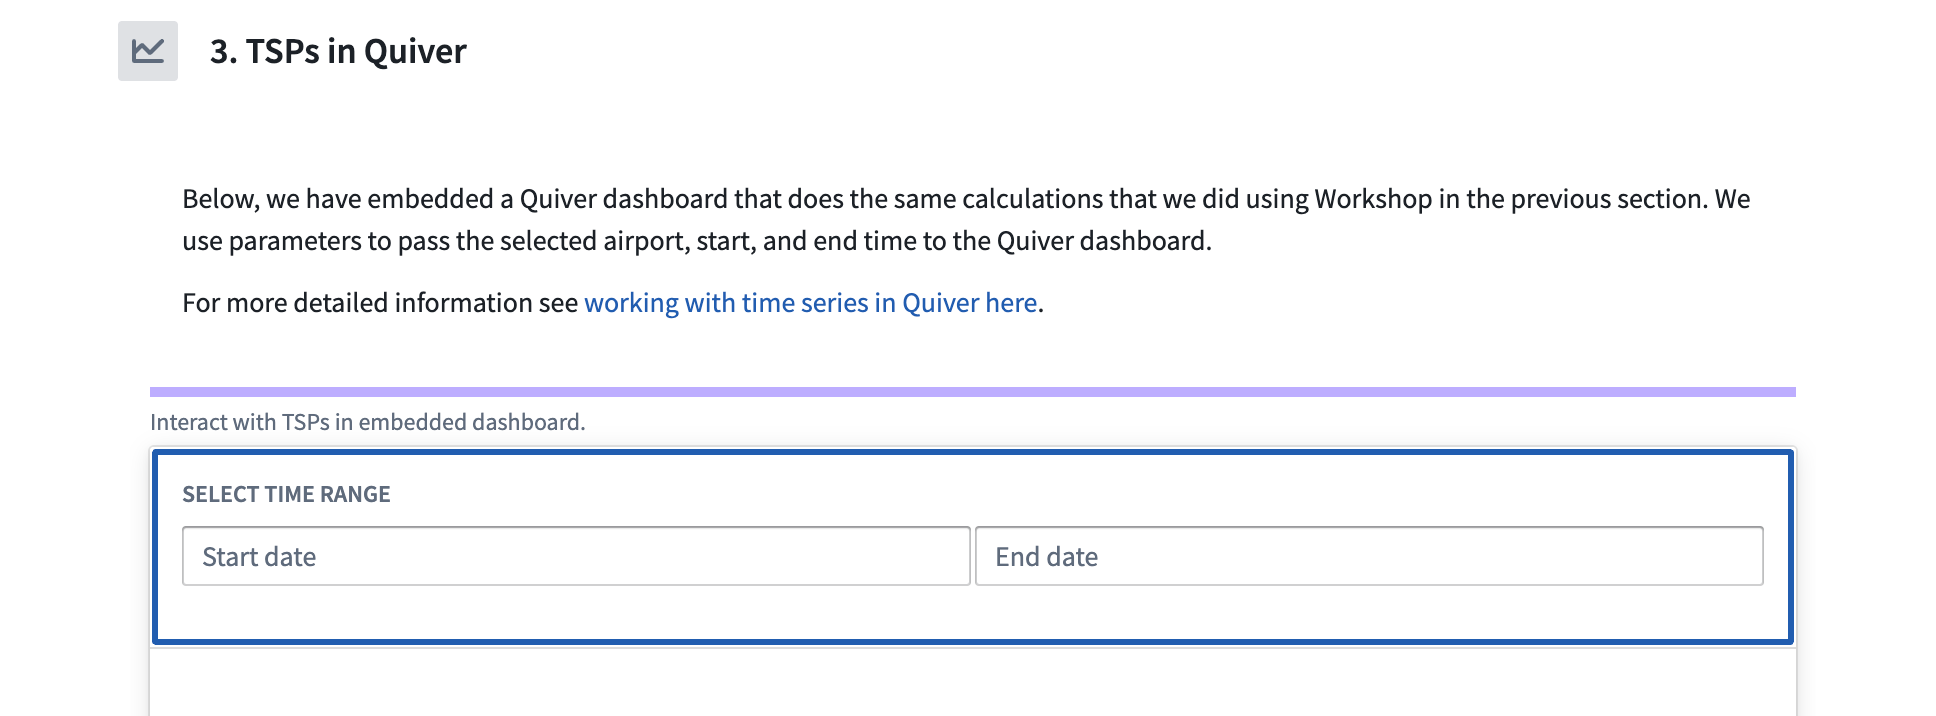
The TSPs in Quiver section of the example Workshop module contains an embedded Quiver dashboard. This Quiver dashboard performs similar calculations to the Workshop widgets discussed above. Follow the instructions below to set up the time series chart and metric card shown in the dashboard.
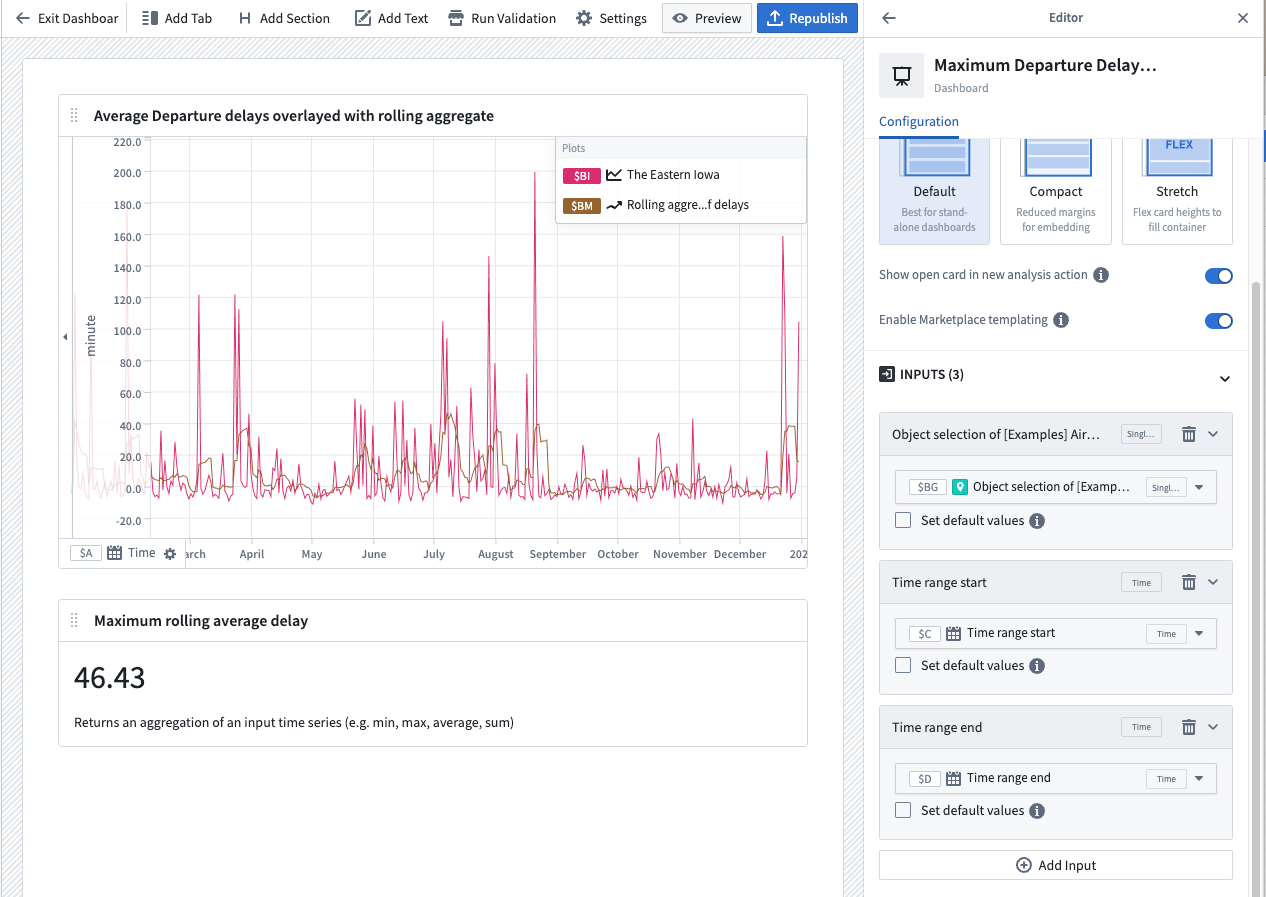
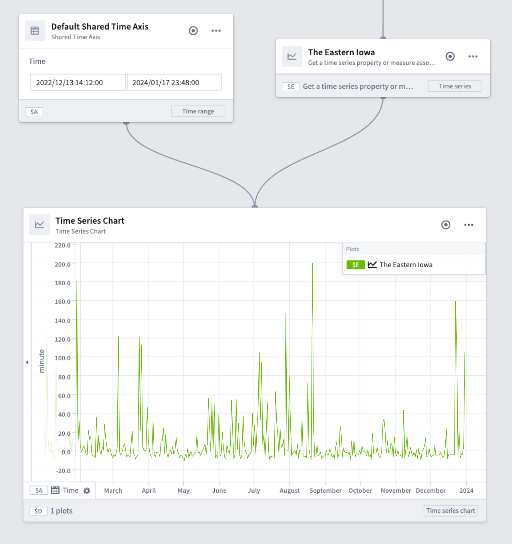
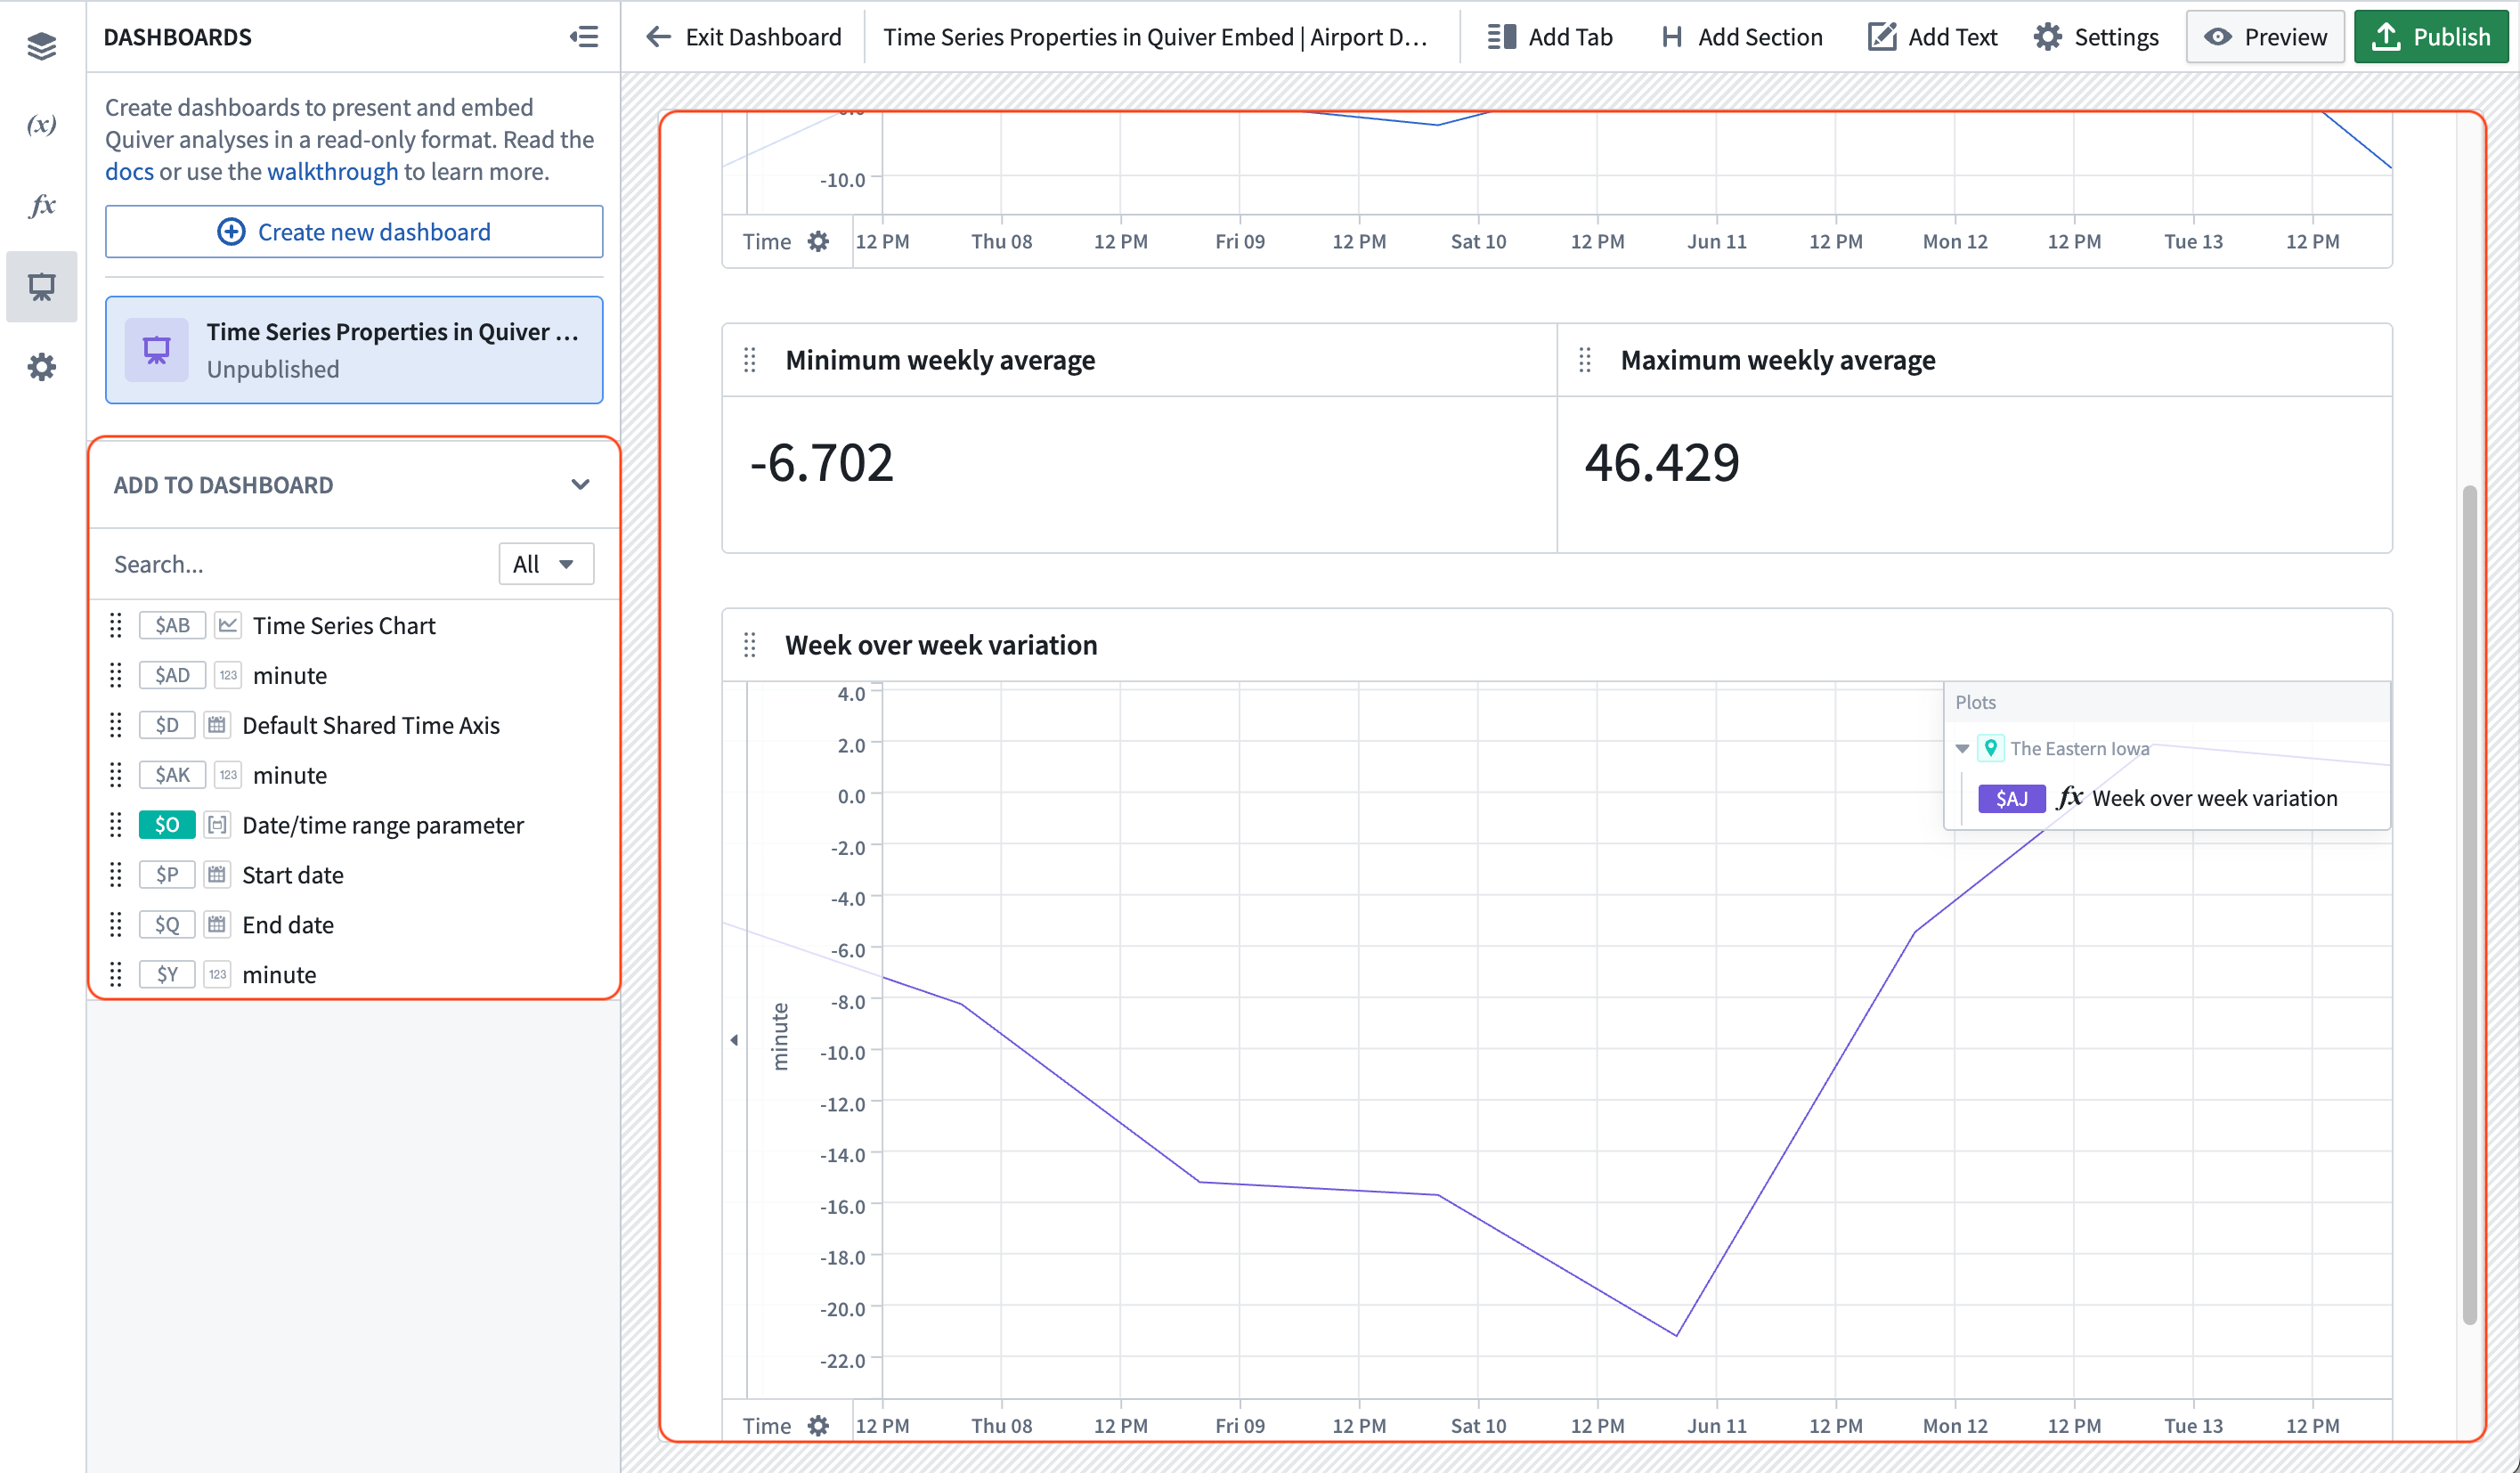
Once the following steps are complete, the resulting dashboard should look like the example below:
Part I: Set up a time series comparison in a Quiver analysis
-
Create a new Quiver analysis and open the Time Series menu from the top bar.
-
In the top left, filter the results to the
Airportobject type and select the Daily Avg Dep Delay time series property from one of the objects.
- Configure the x-axis of the resulting plot to Fit to extent, this will ensure that the axis is scaled to the data's time range.
- Select Graph in the top right of the viewable content to enter the analysis graph view.
Note that by adding the time series property of an object, a time series chart, a numeric axis (unit), and a default shared time axis card were also generated.
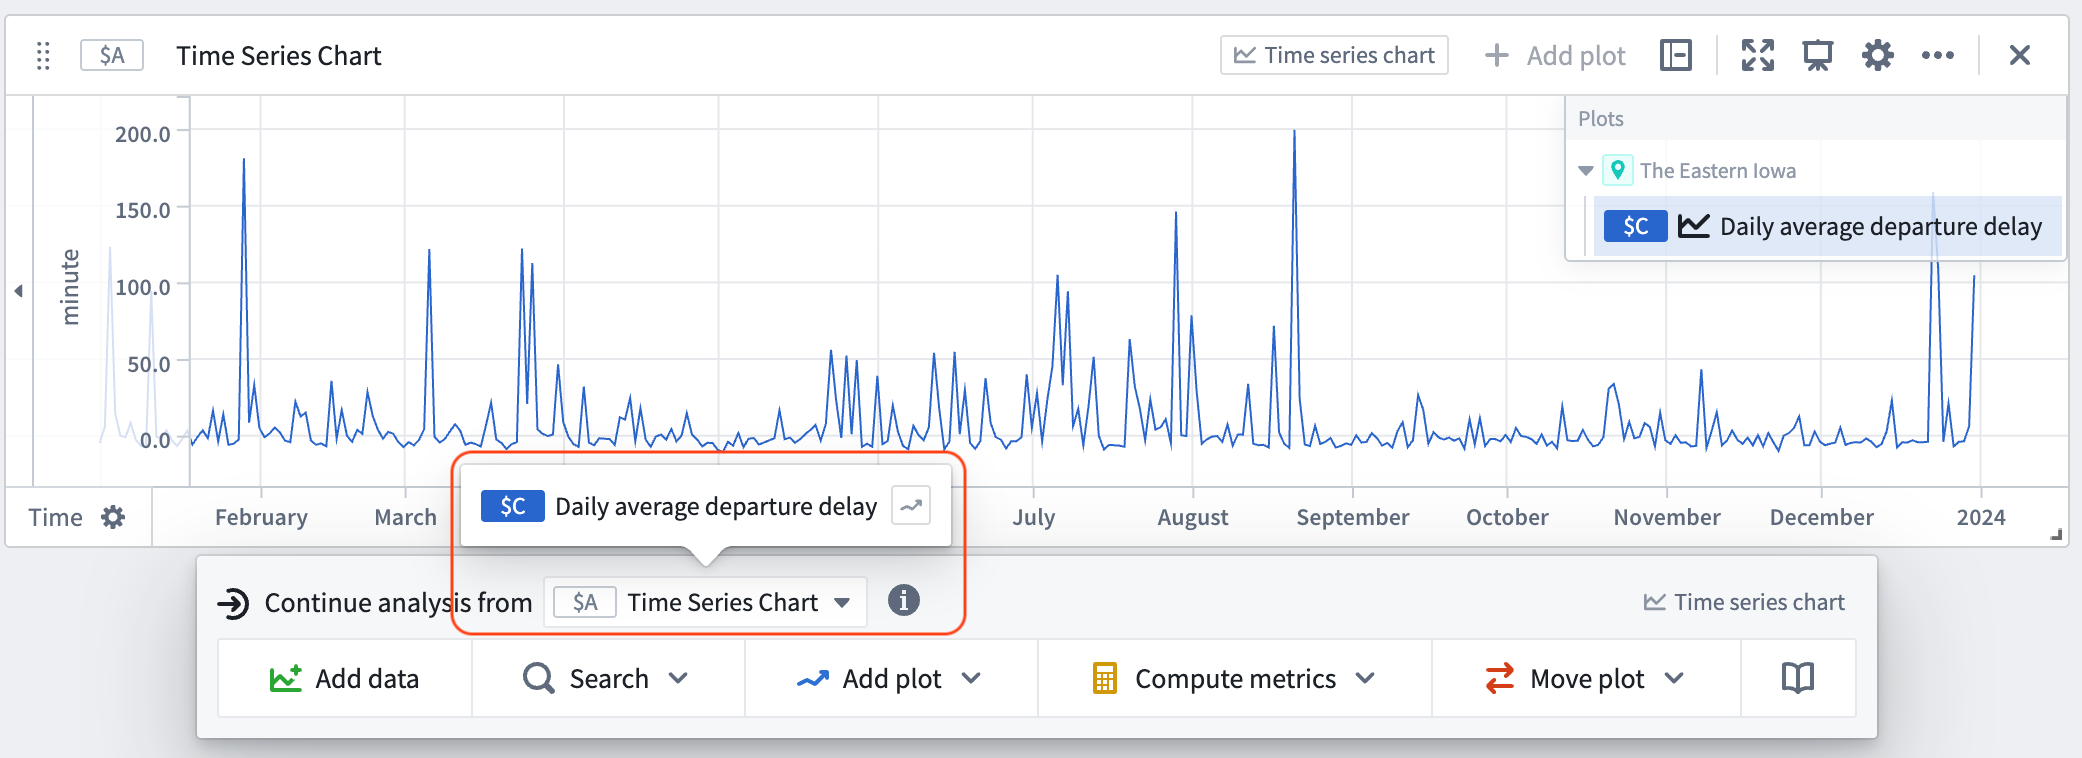
- Hover over the object's time series property card until the menu appears. From the next actions menu, select the time series property from the Continue analysis from dropdown.
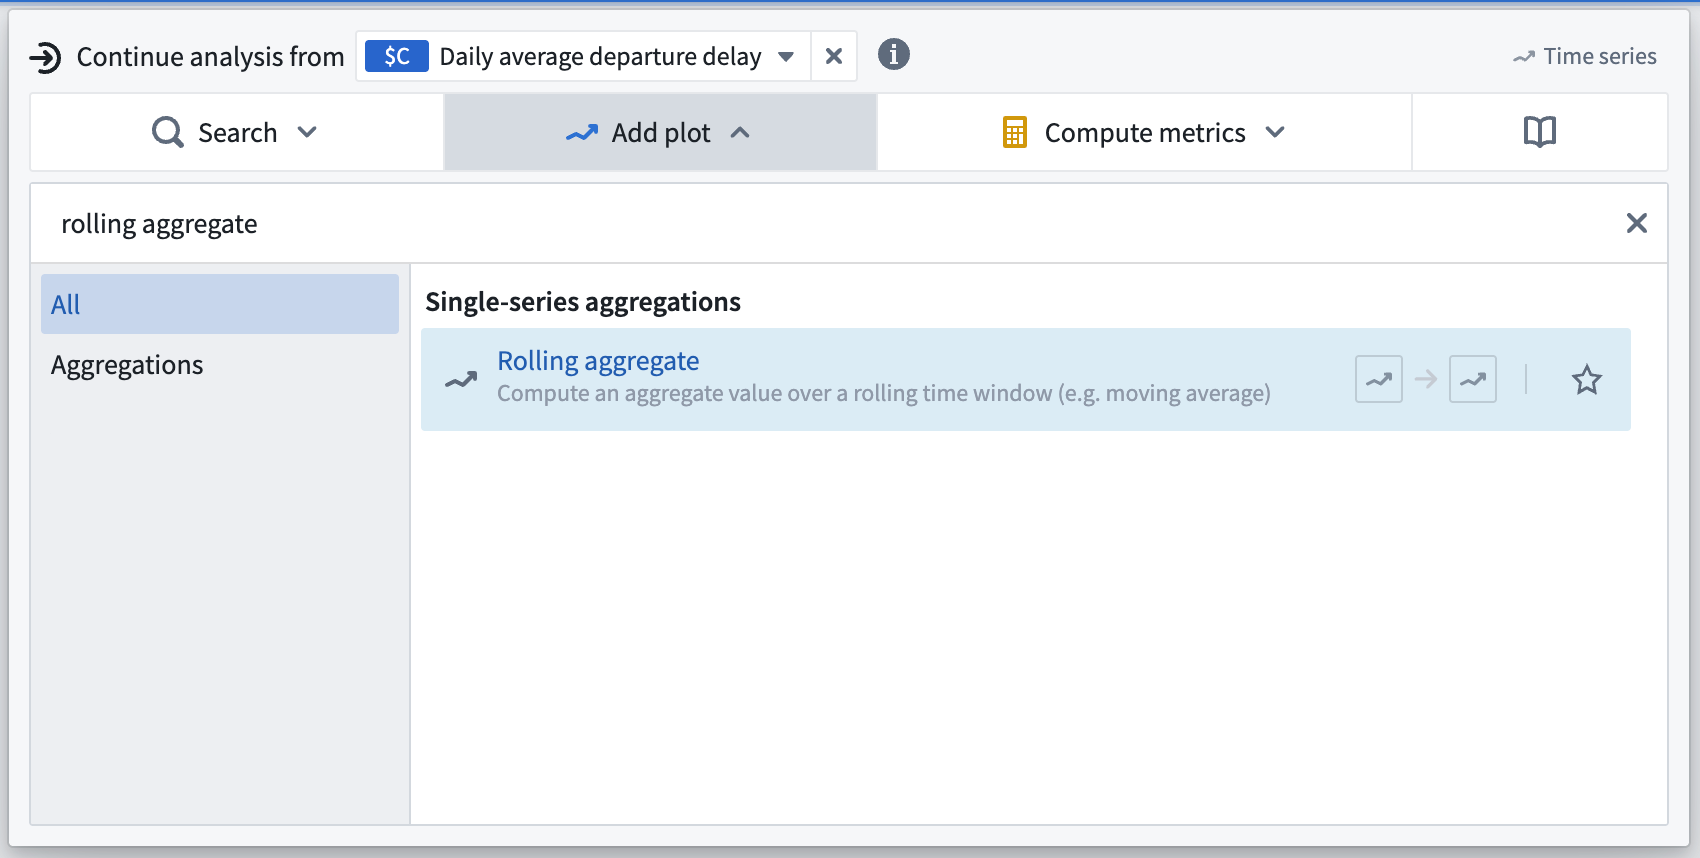
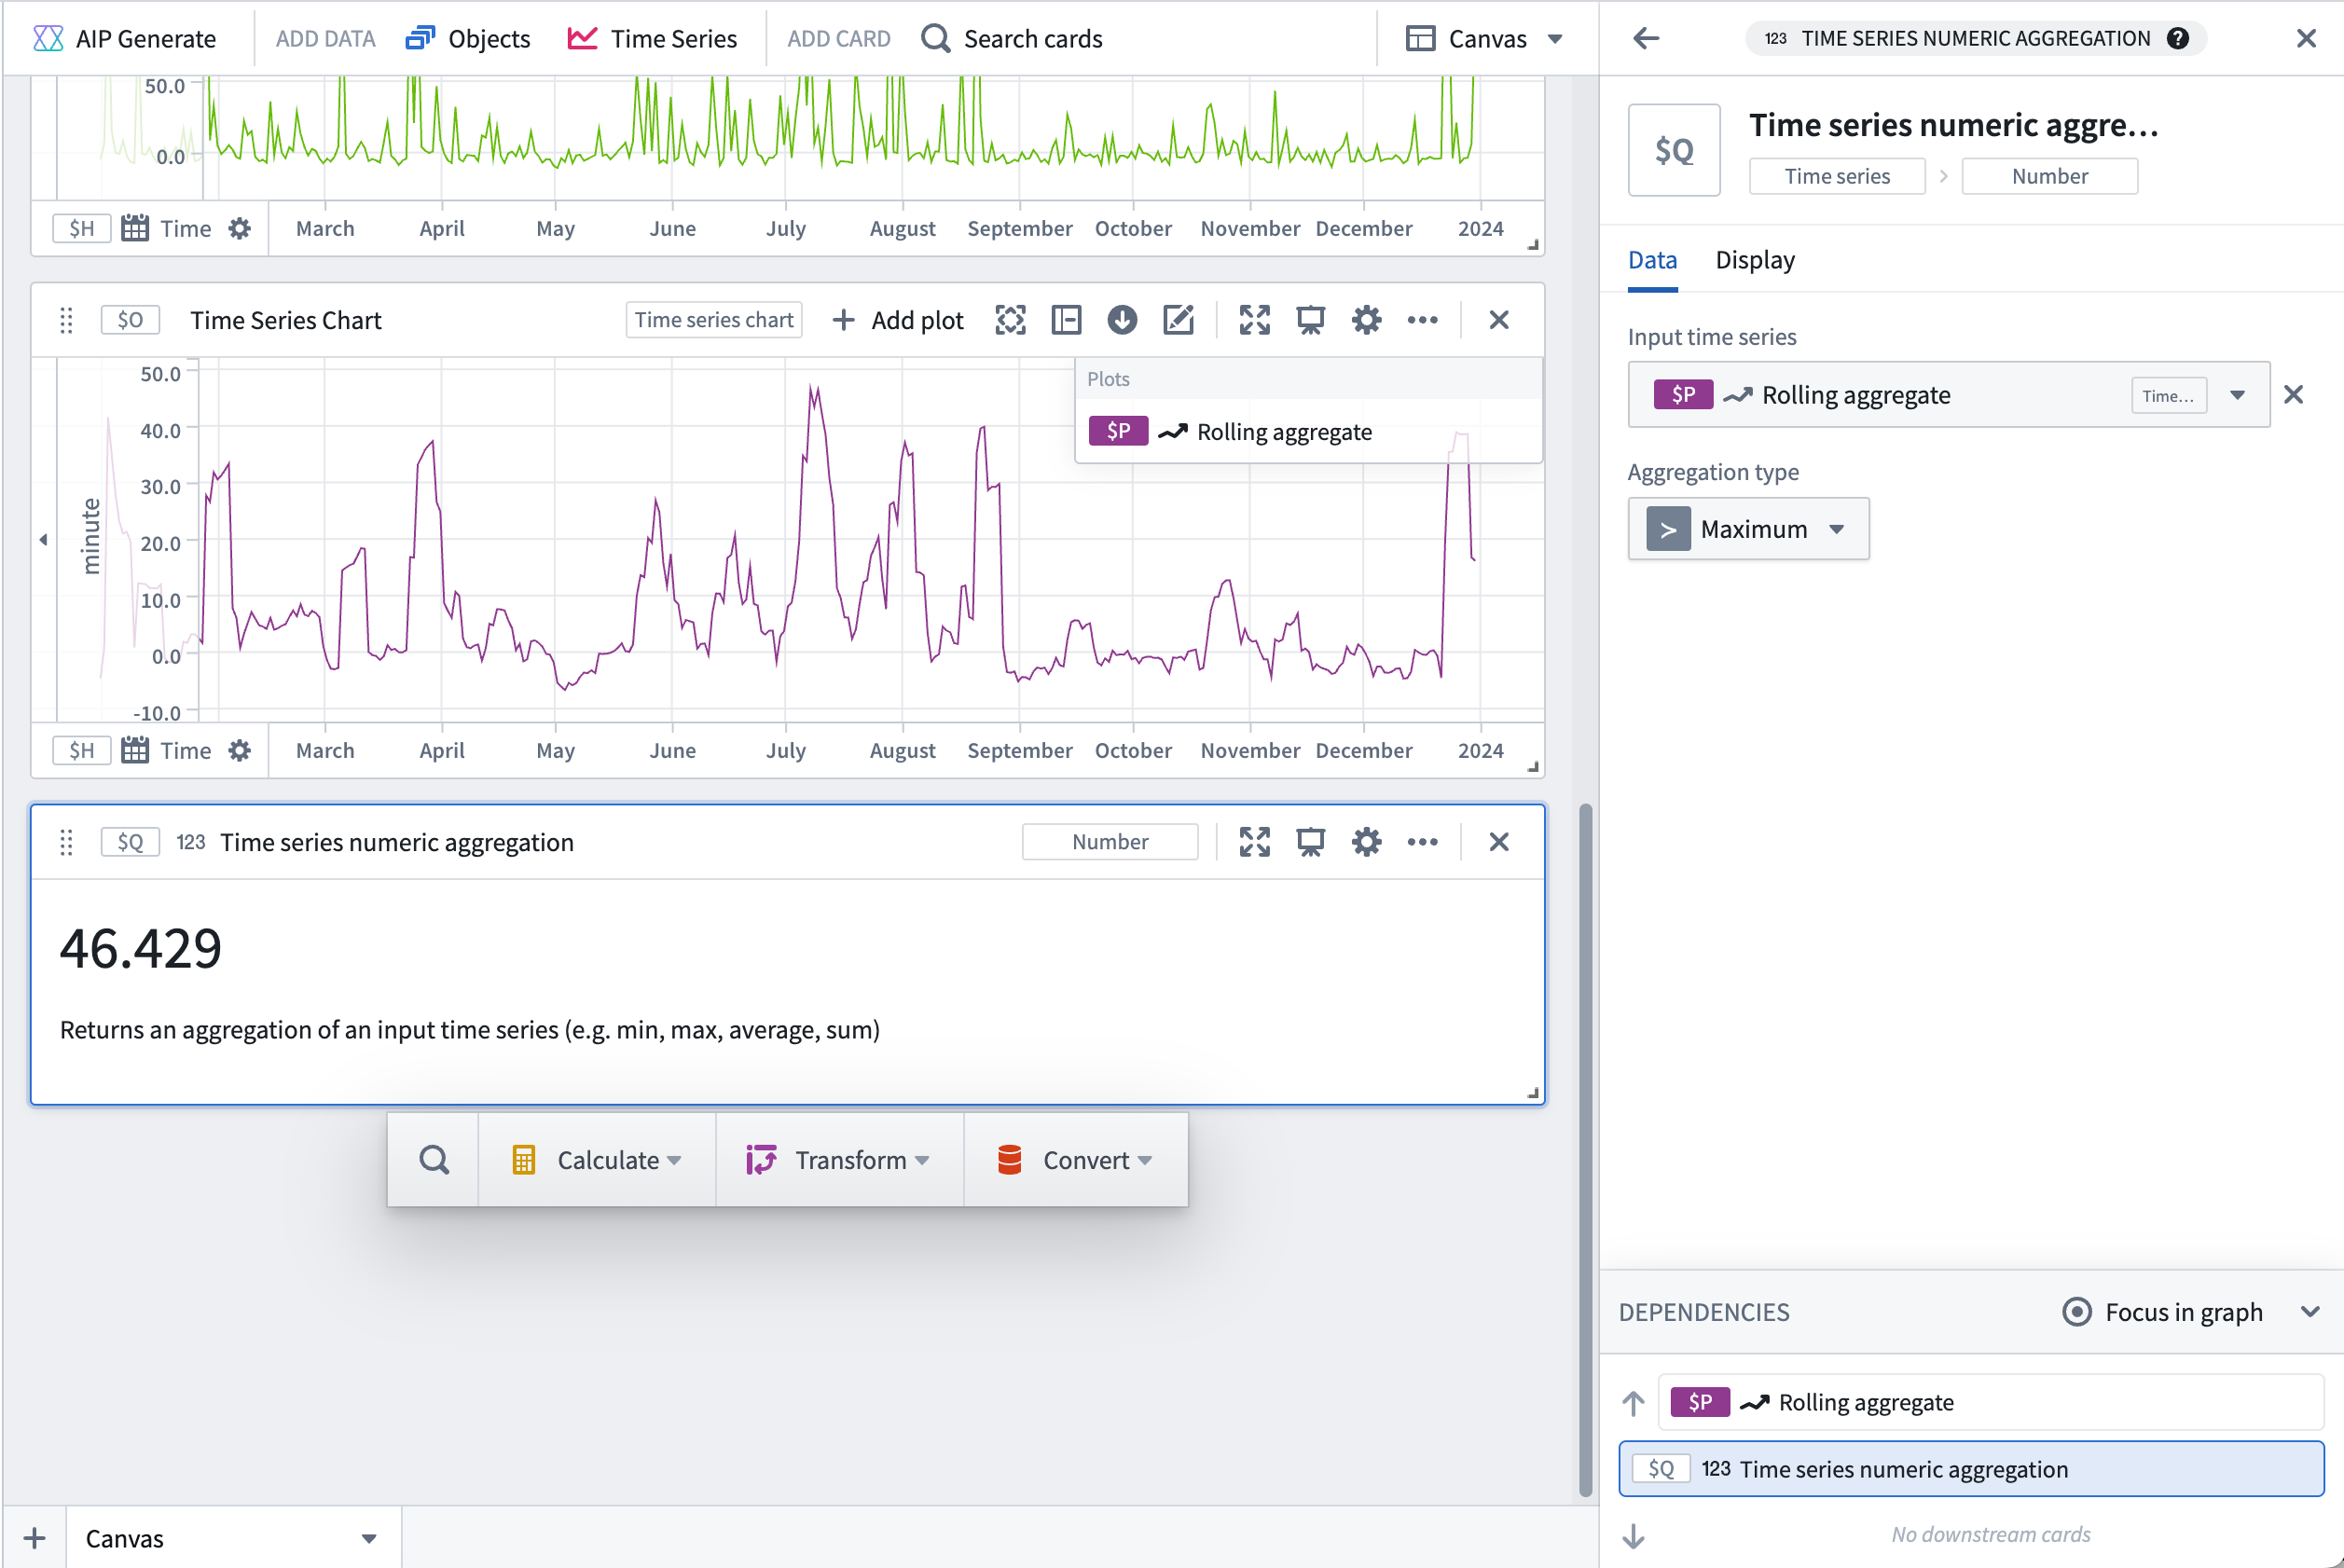
- Select the Add plot button and search for "rolling aggregate" to add a Rolling aggregate card to the canvas.
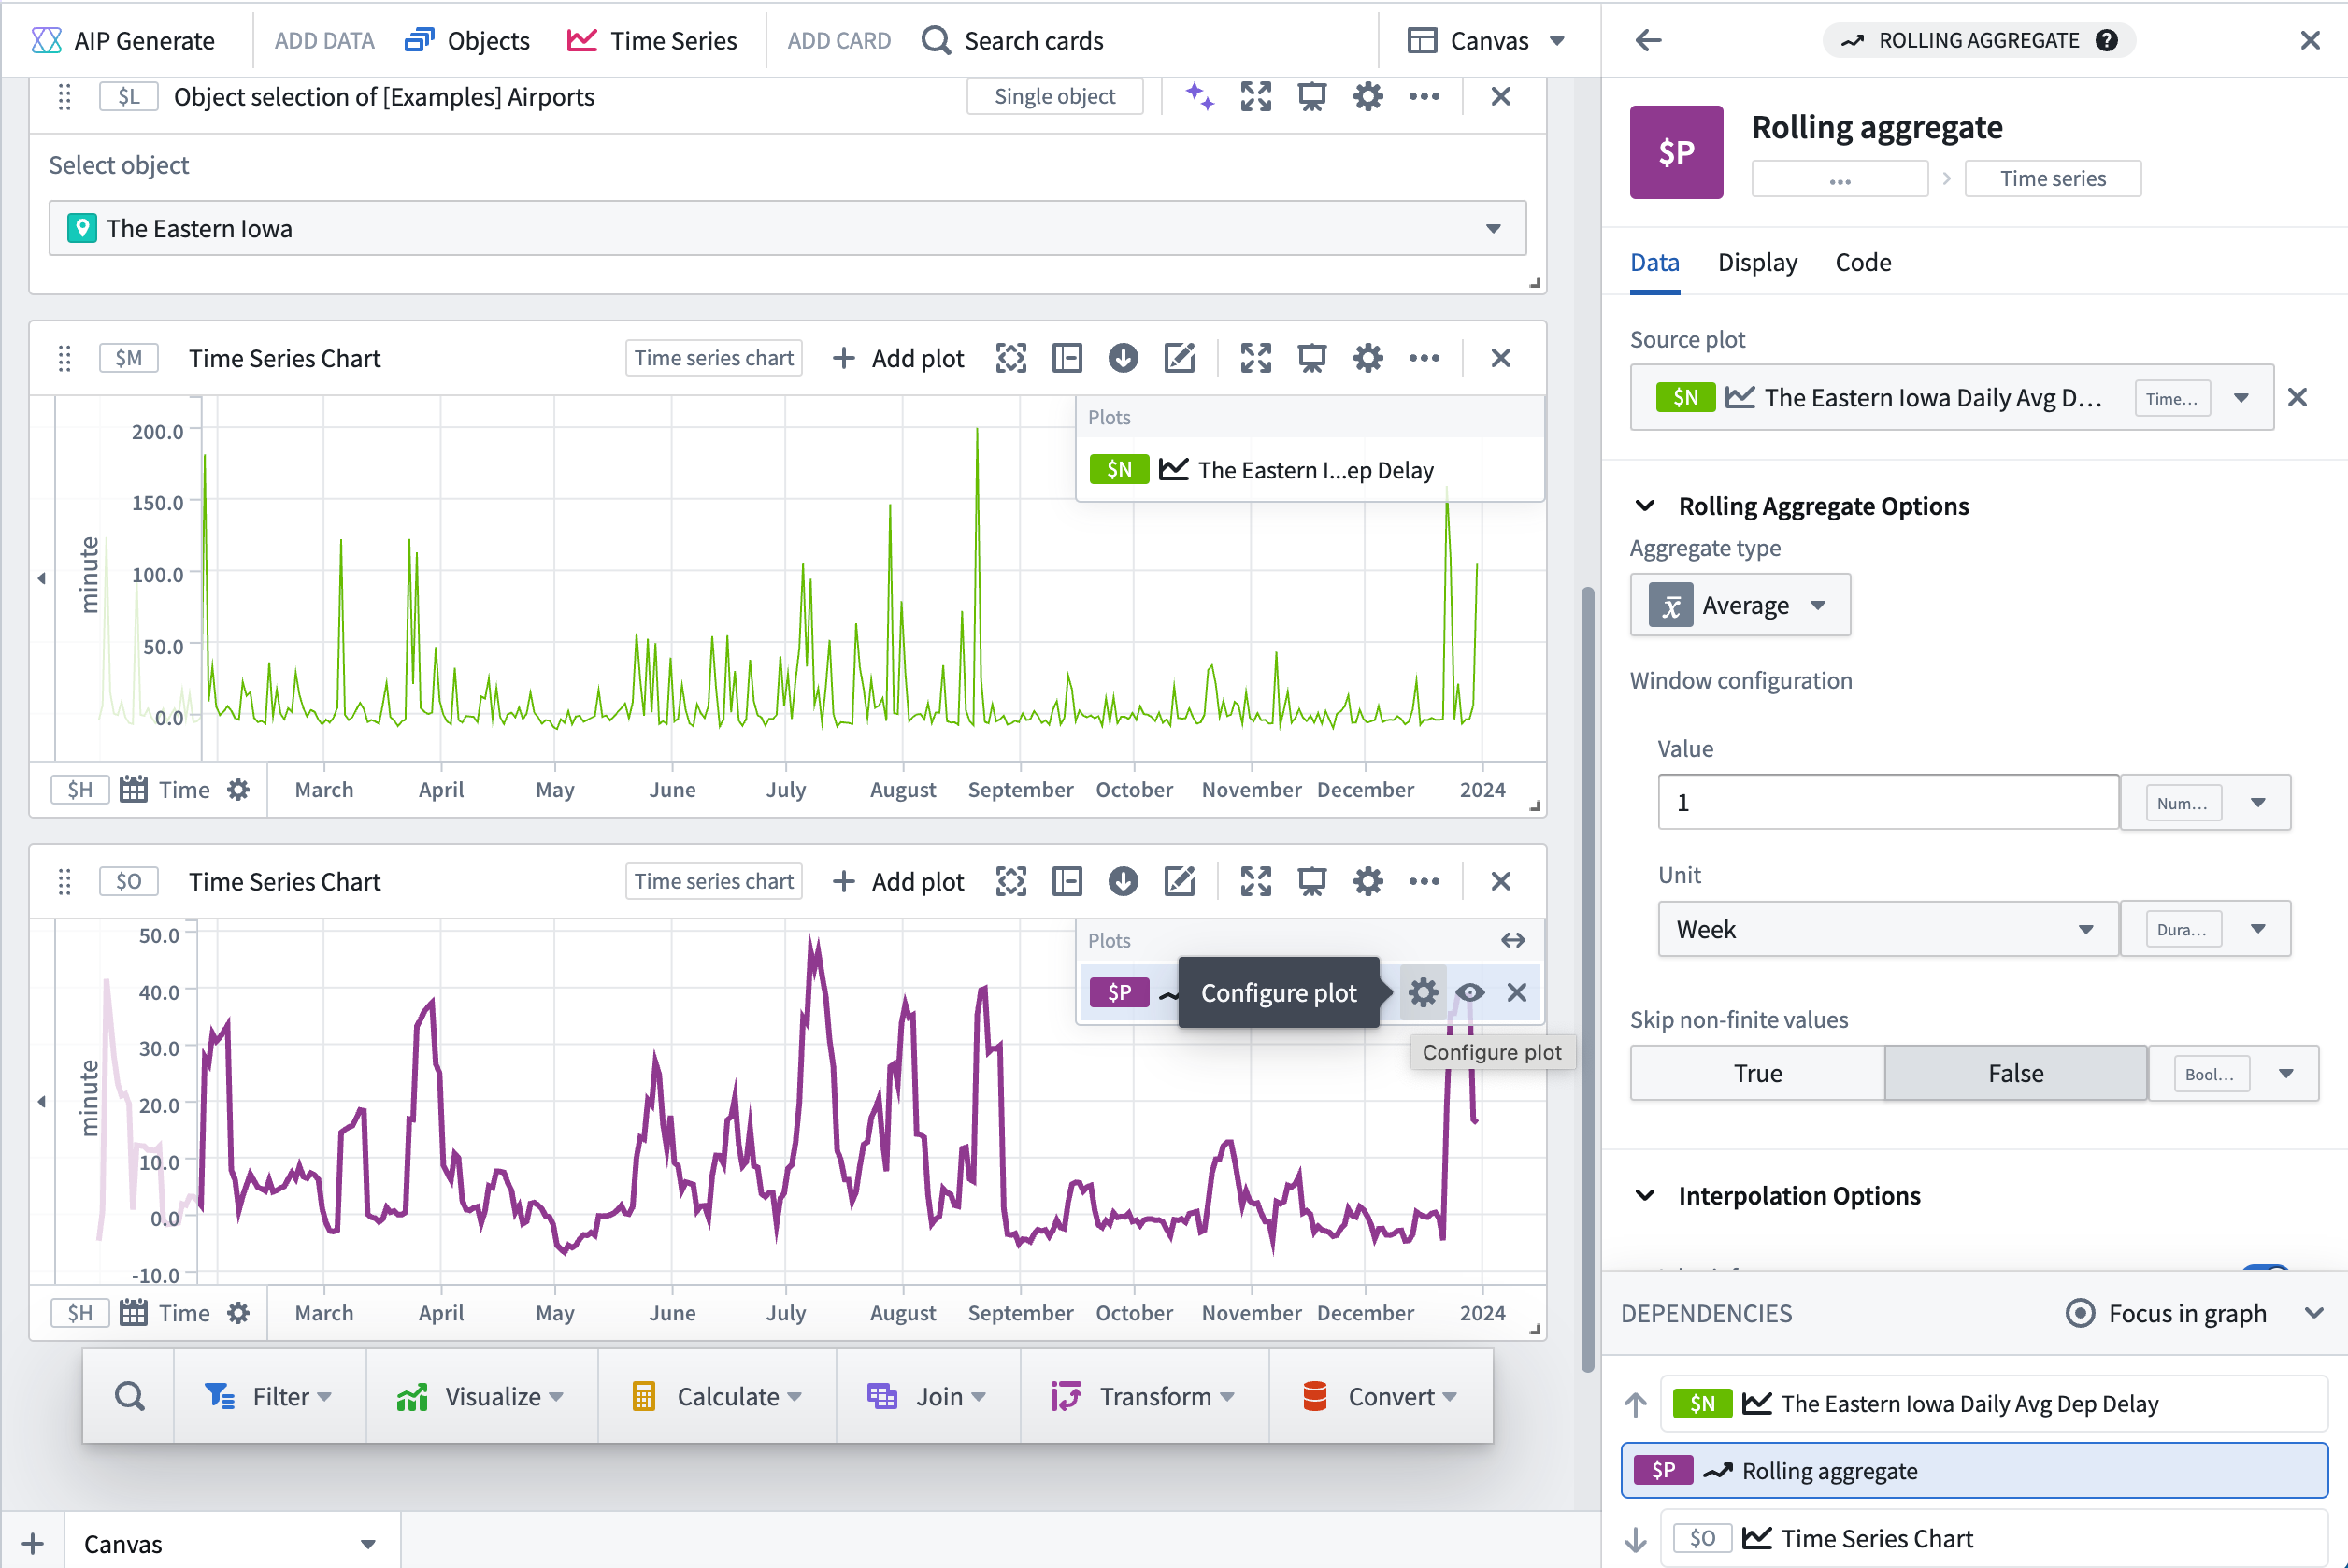
- From the settings menu on the plot in the upper right of the card, choose Average with a Value of 1 and a Unit of Week, indicating every one week.
- Hover over the plot until the menu appears. From the next actions menu, Continue analysis from the newly created rolling aggregate. Select Search and search for "numeric aggregation". In the numeric aggregation settings, set the Aggregate type to be Minimum. Repeat this step to add a maximum numeric aggregation card.
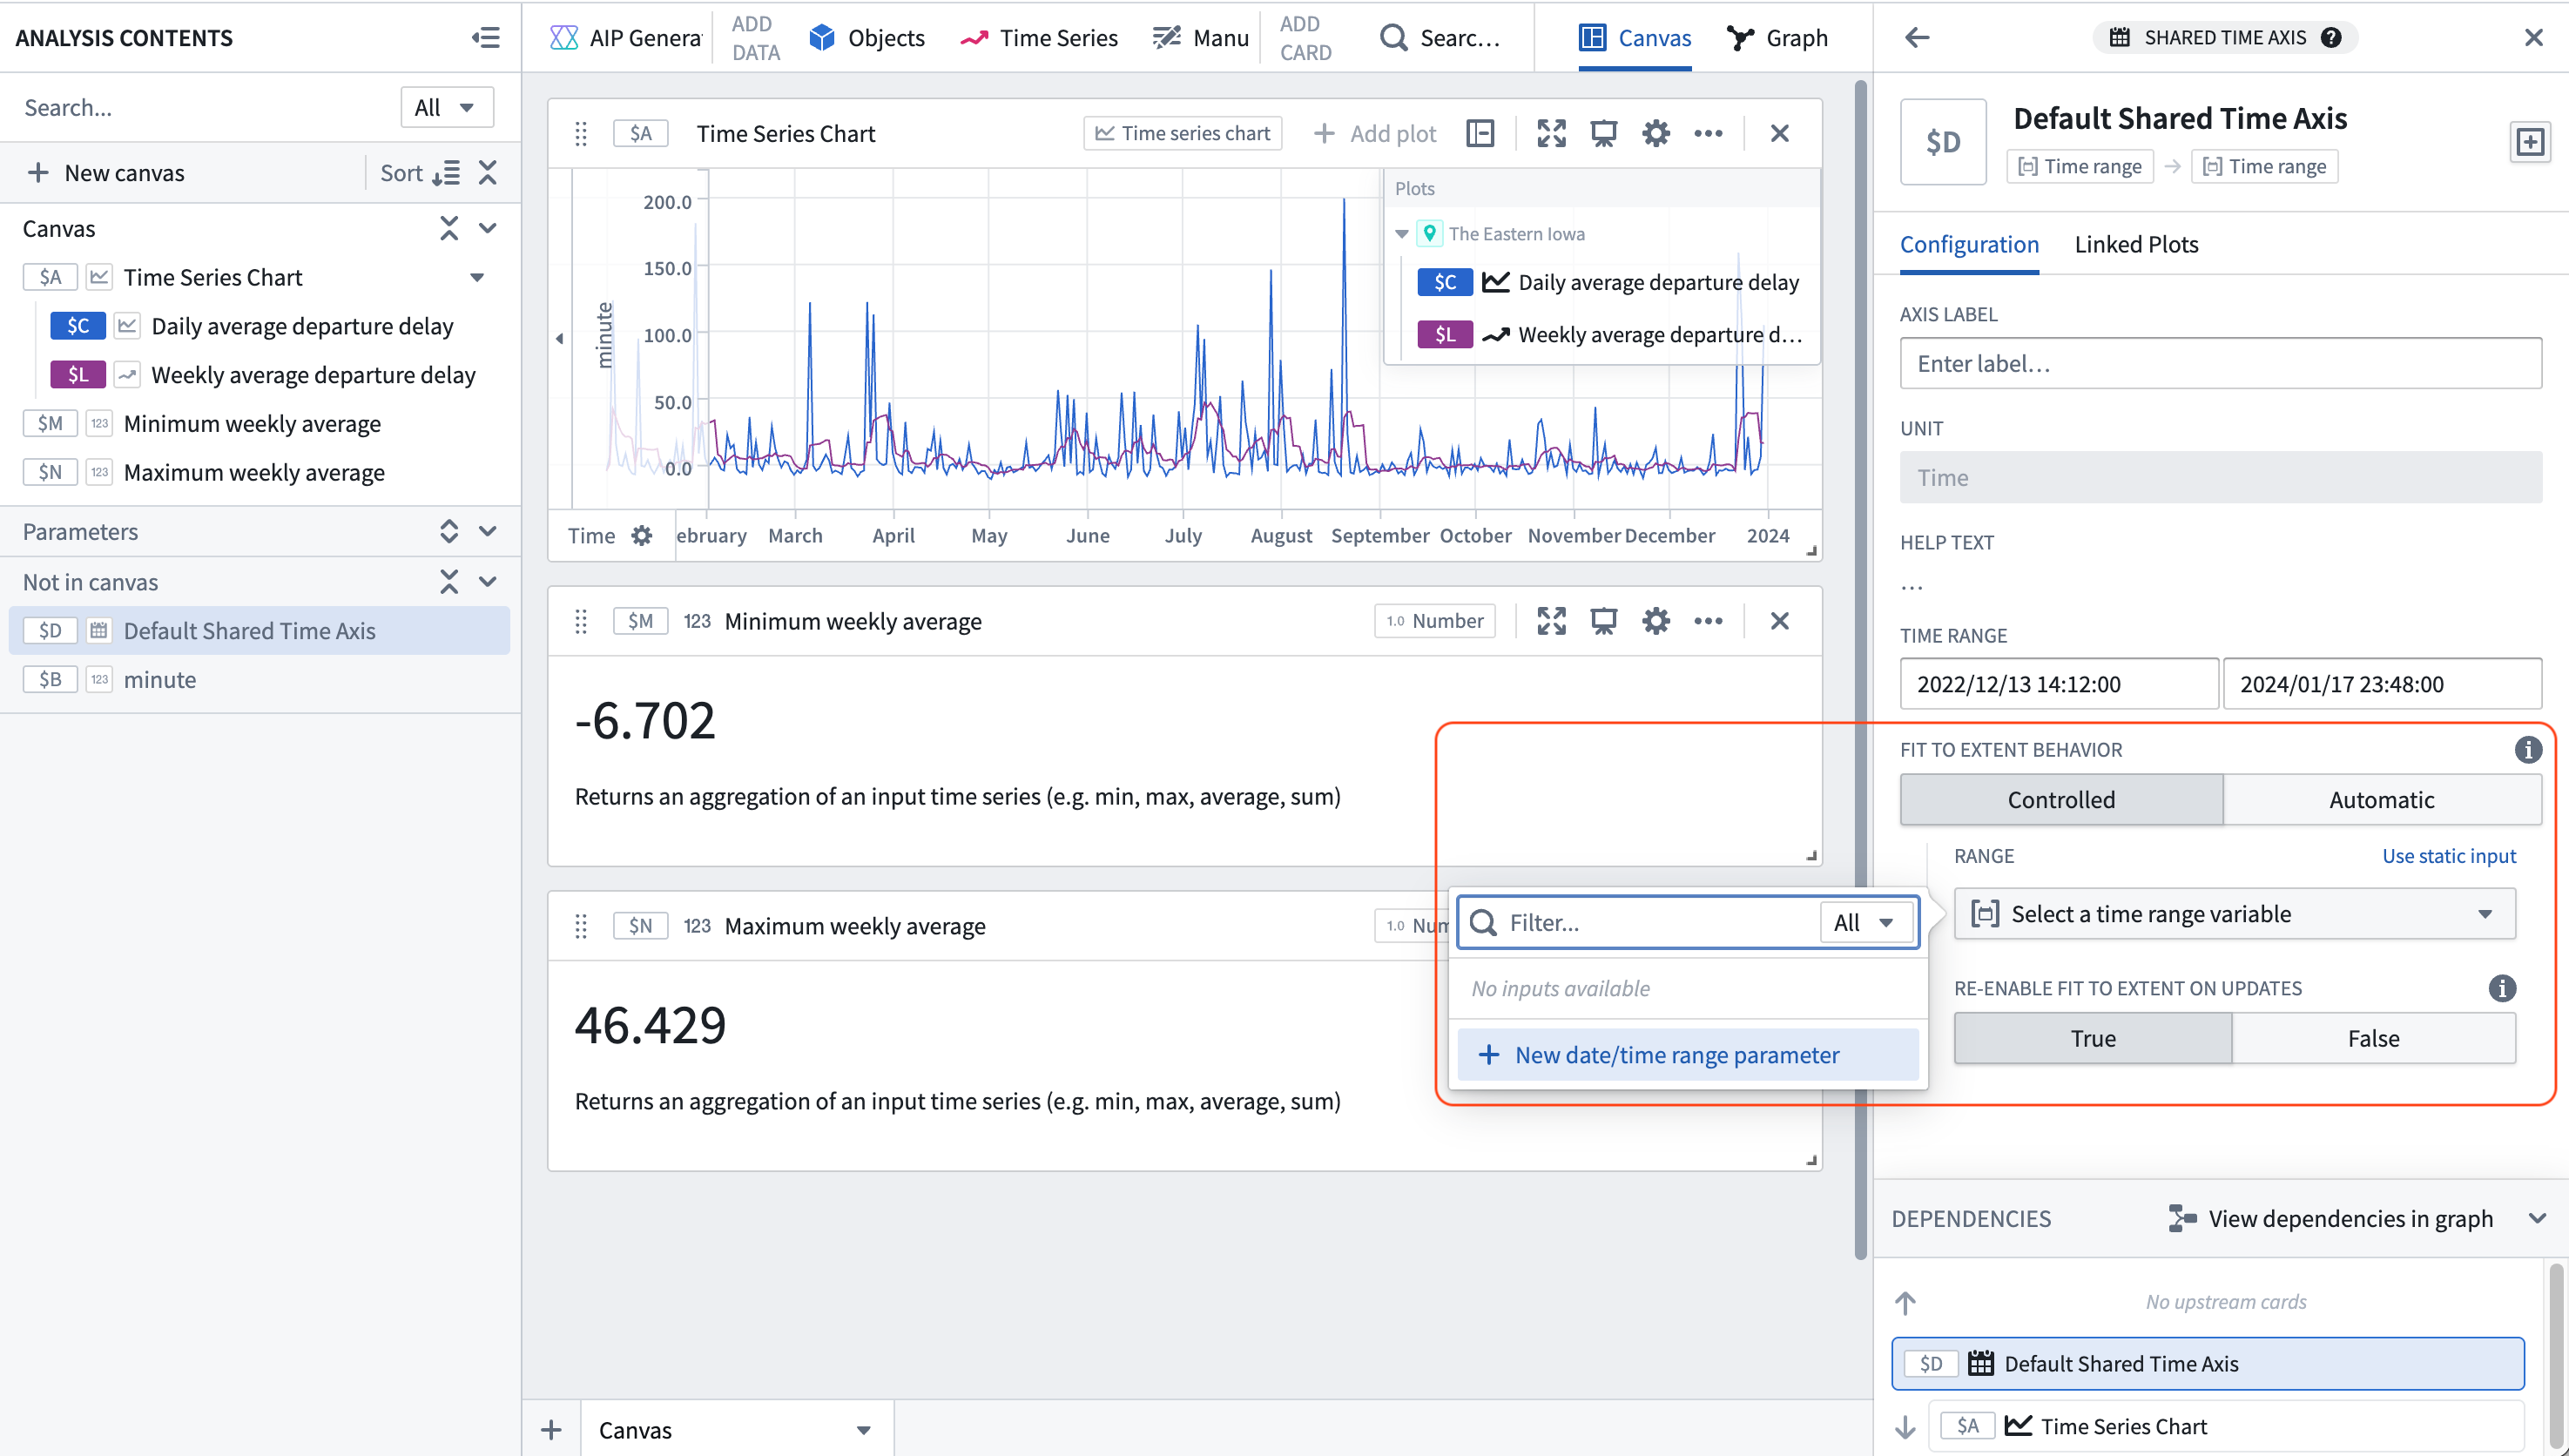
- In the Analysis contents panel, find the Default Shared Time Axis. In the configuration side panel on the right, toggle on the Controlled option, select Use variable input, and select New date/time range parameter in the Range dropdown. This will create a new date/time range parameter that will be used to control the time range of the shared time axis.
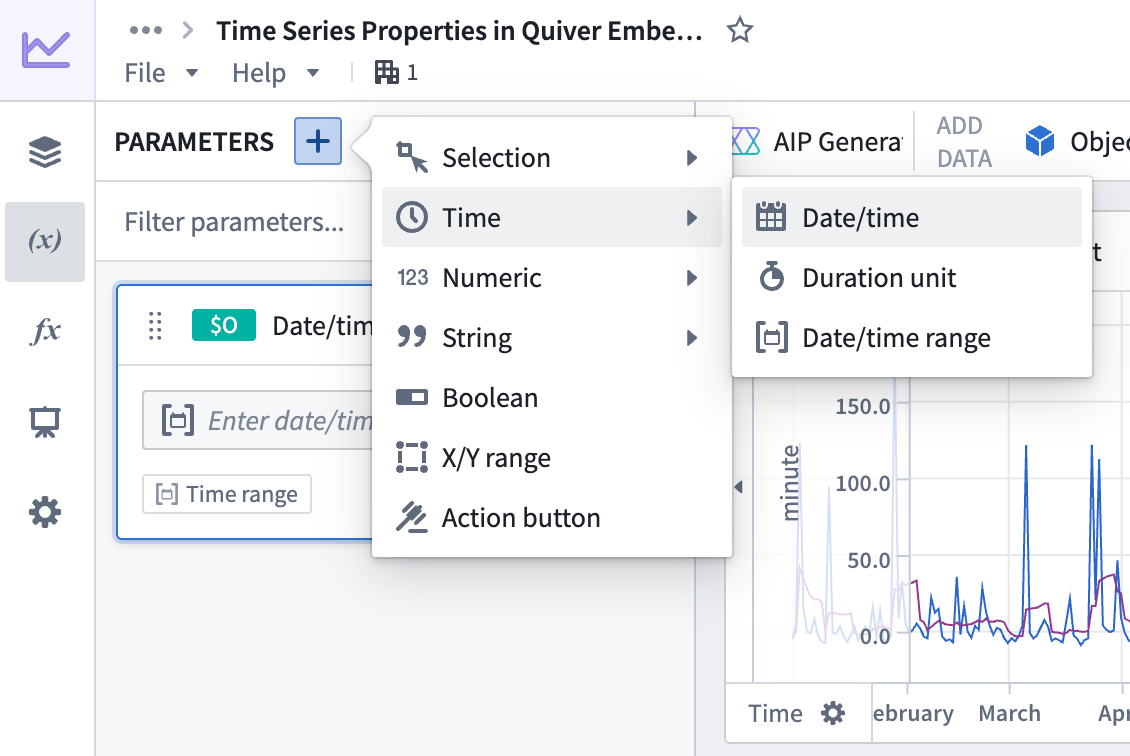
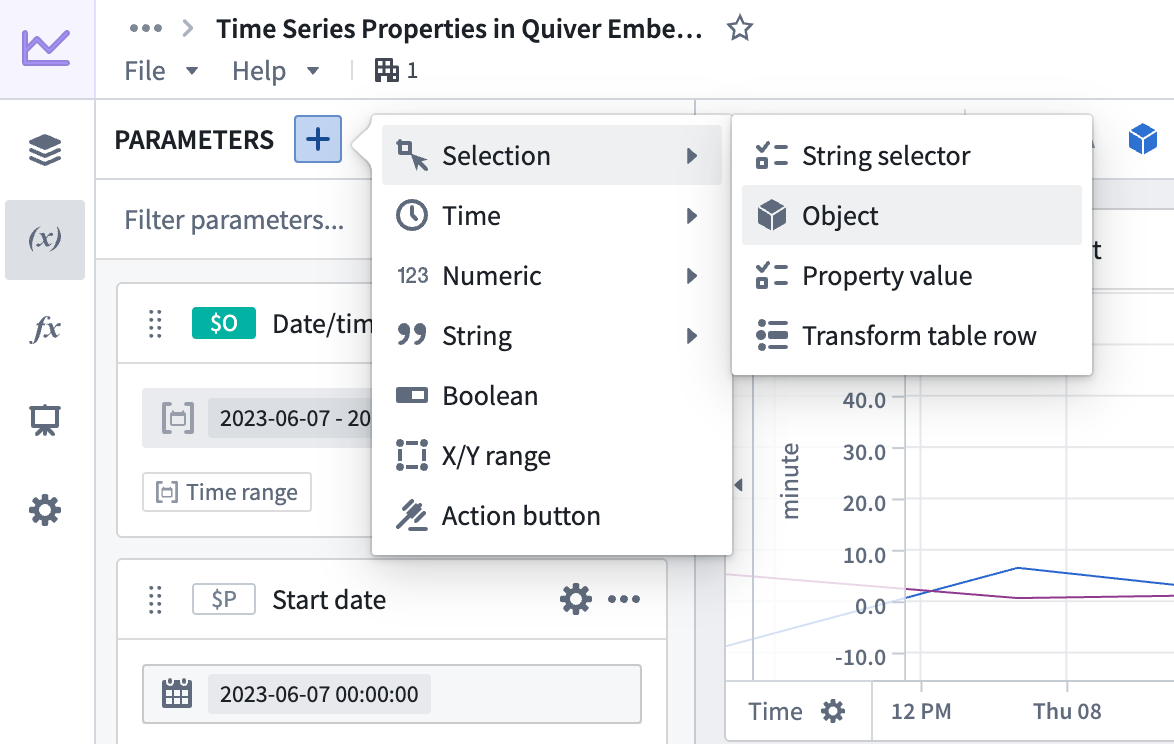
- In the Parameters panel you should see the newly created date/time range parameter. Create two date/time parameters, one representing the start of the time range and one representing the end of the time range.
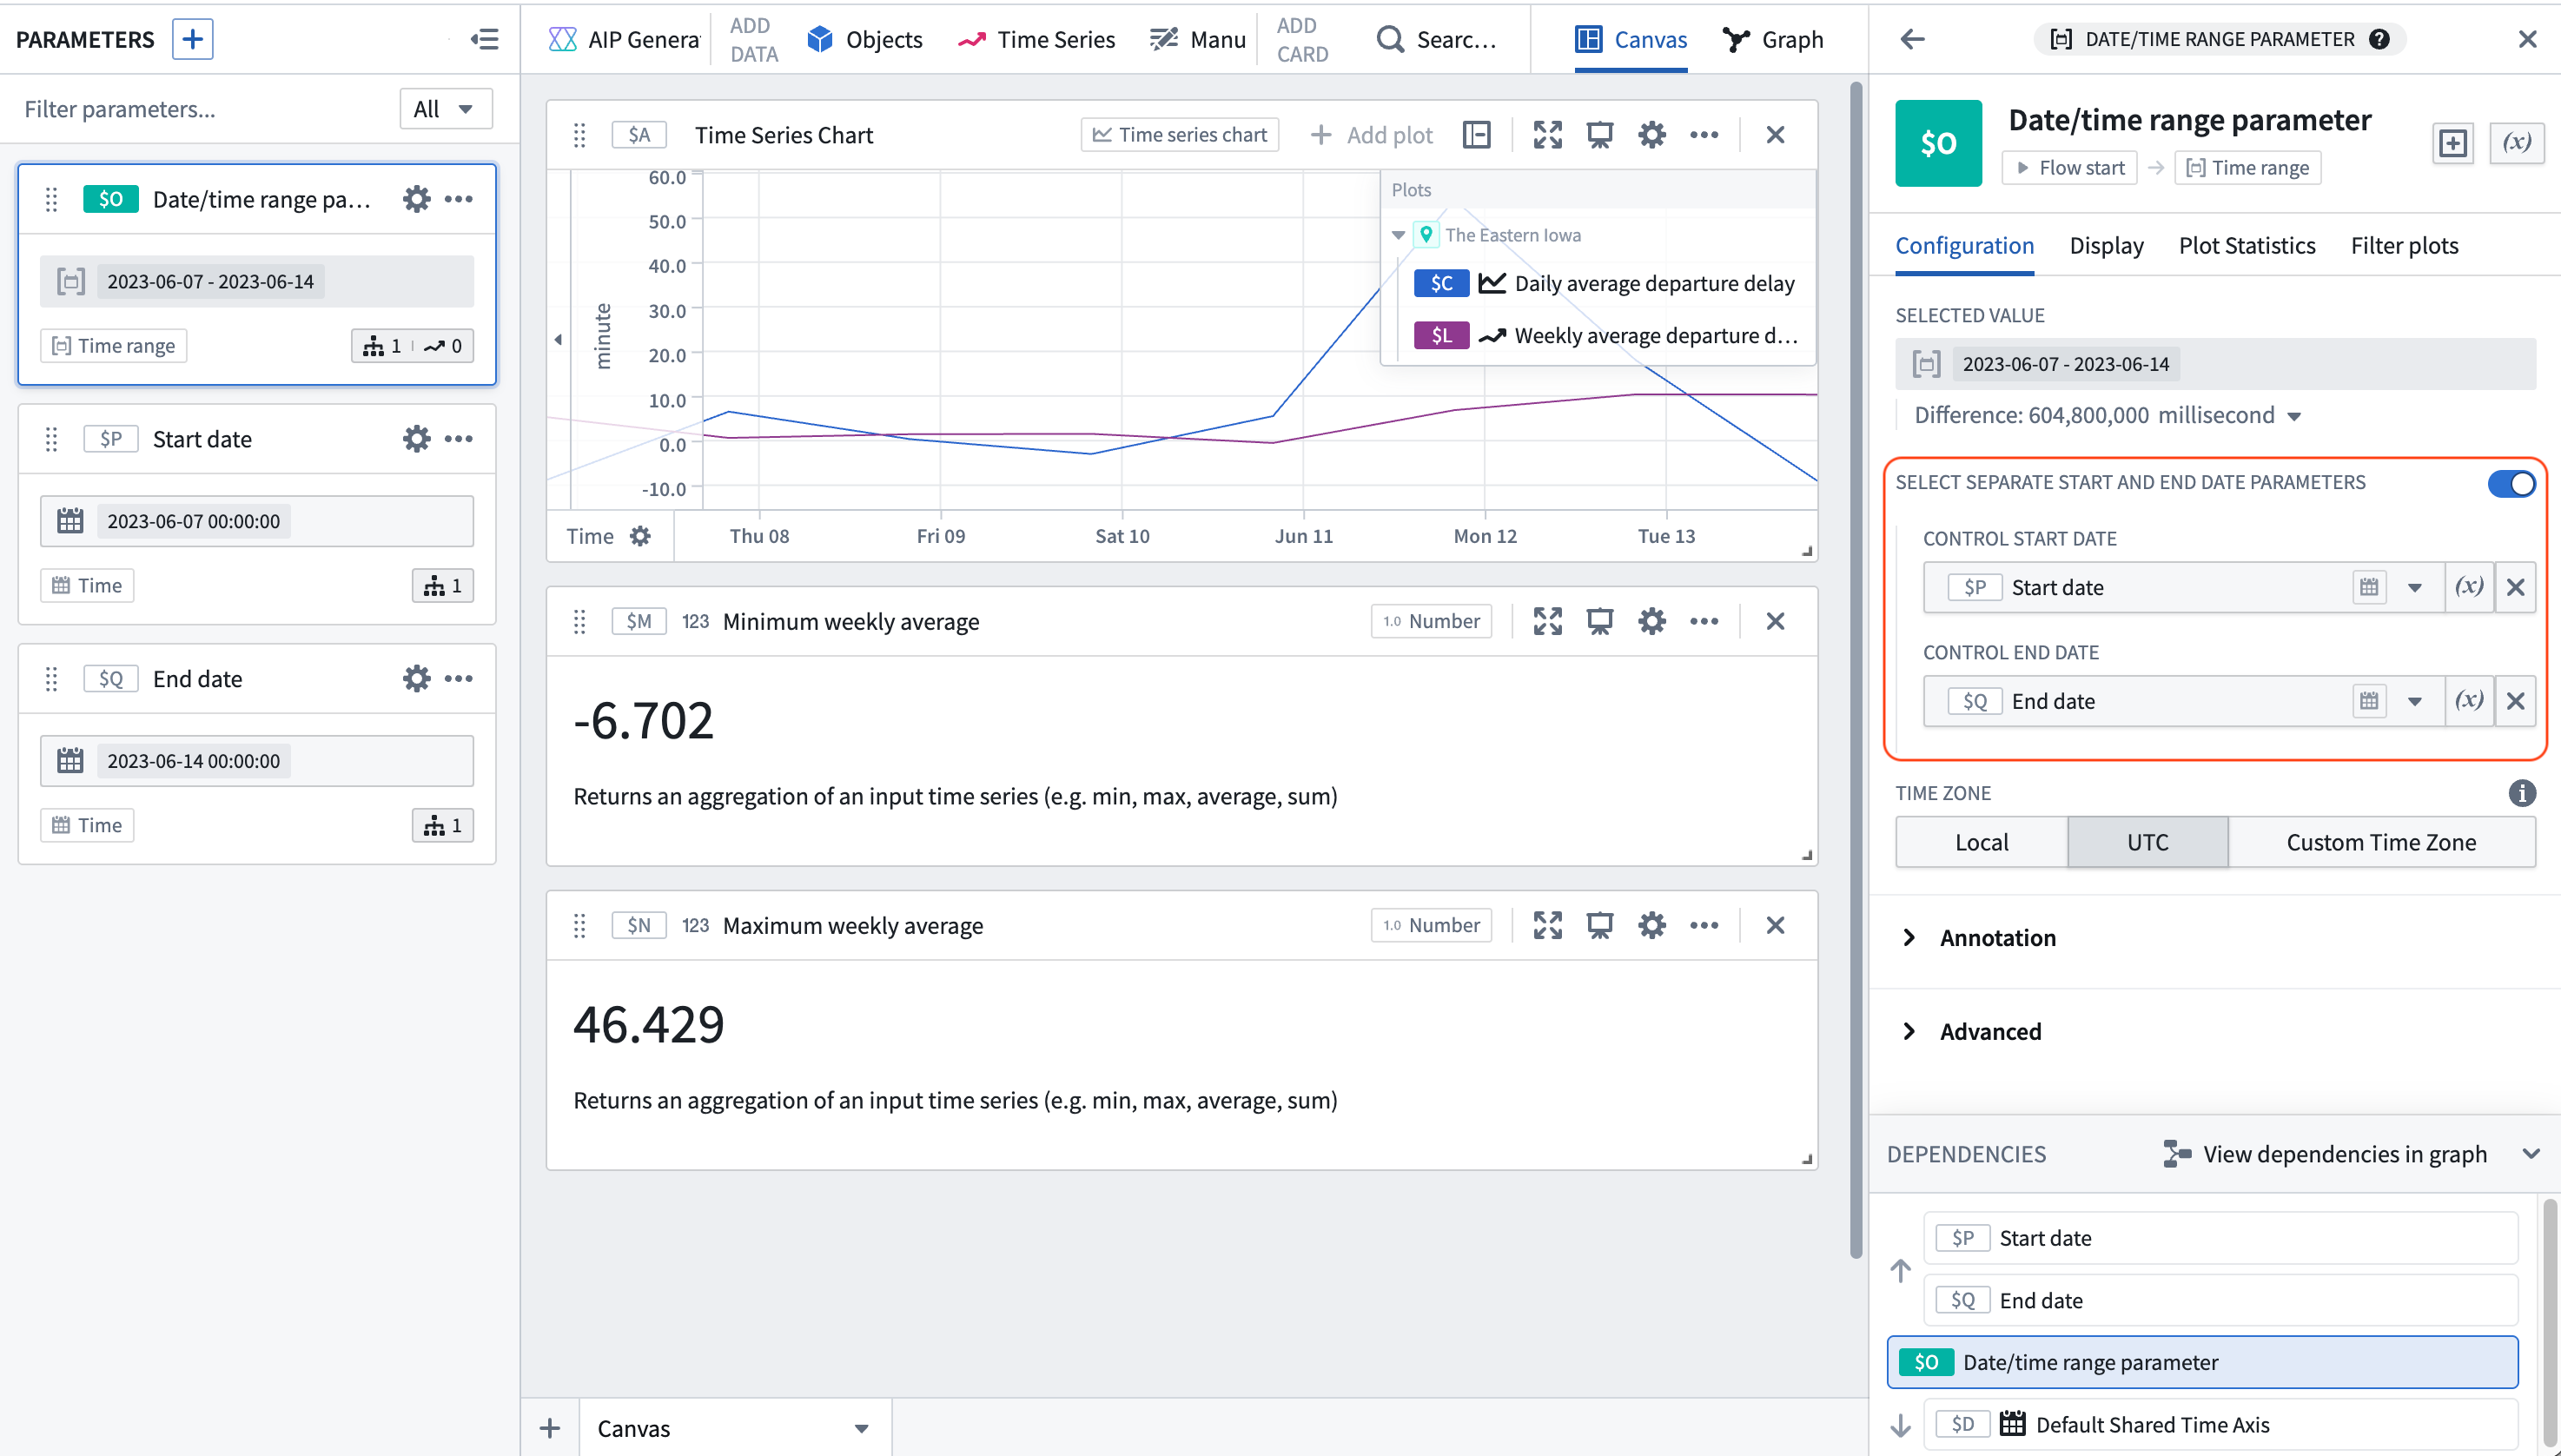
- Select the date/time range parameter created in step 9, and in the right configuration panel toggle on Select separate start and end date parameters. Then, select the start and end parameters created in step 10 from the dropdown menus. Now the time axis of the plots can be controlled by the start and end parameters.
- In the parameters panel, create a new Object parameter.
- In the right side configuration panel, select the
Airportobject type and select any airport from the dropdown.
- Select the
Daily Avg Dep Delaycard that was created in step 2. In the configuration panel on the right select Use variable input next to the Series Object configuration and select the newly created object selector parameter. Now, the airport can be controlled, and theDaily Avg Dep Delaytime series will update along with all of our downstream operations.
- Hover over the plot containing the rolling weekly aggregate and select the rolling aggregate from the Continue analysis from dropdown in the next actions menu, then search for "shift time series". Add the Shift time series card and configure it to shift the input series back one week.
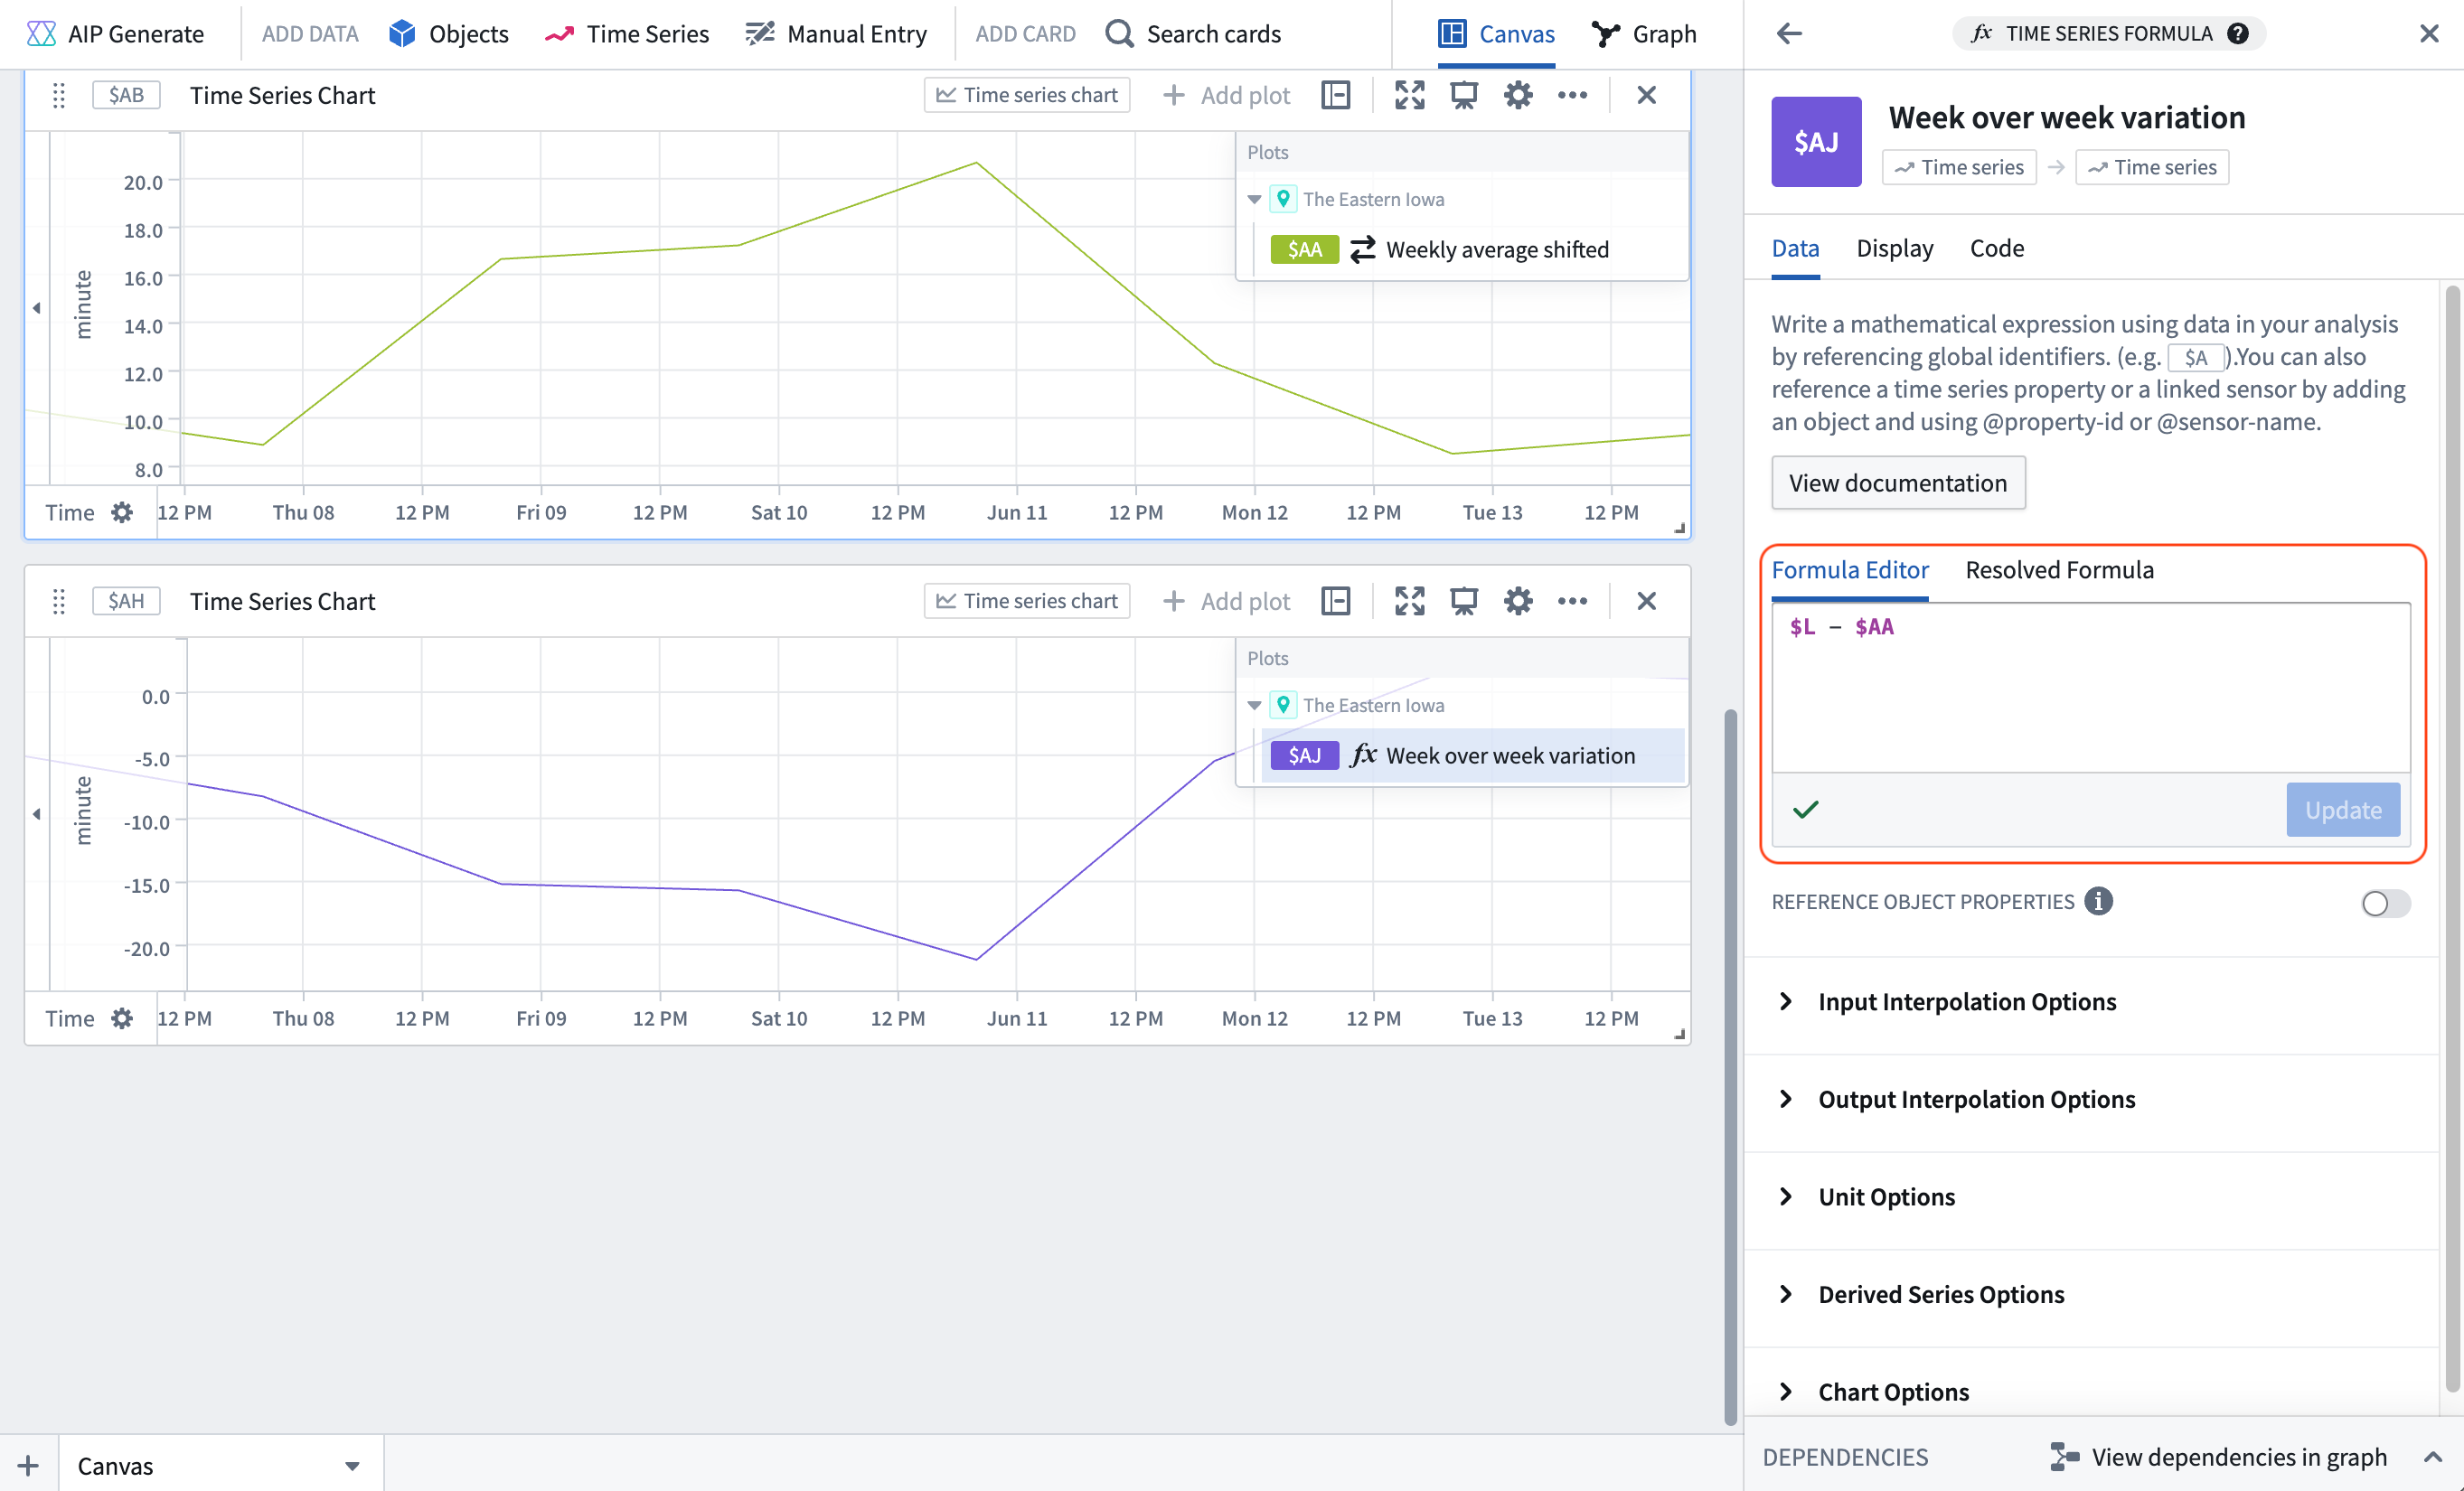
- Add another plot by hovering over the existing plot, and use the Search action in the next actions menu to search for "time series formula". Add the Time series formula card and add the following formula to the card configuration:
$L - $AA; where$Lis the weekly average departure delay, and$AAis the weekly average delay shifted back one week. The result is a week over week variation.
Part II: Set up Quiver dashboard
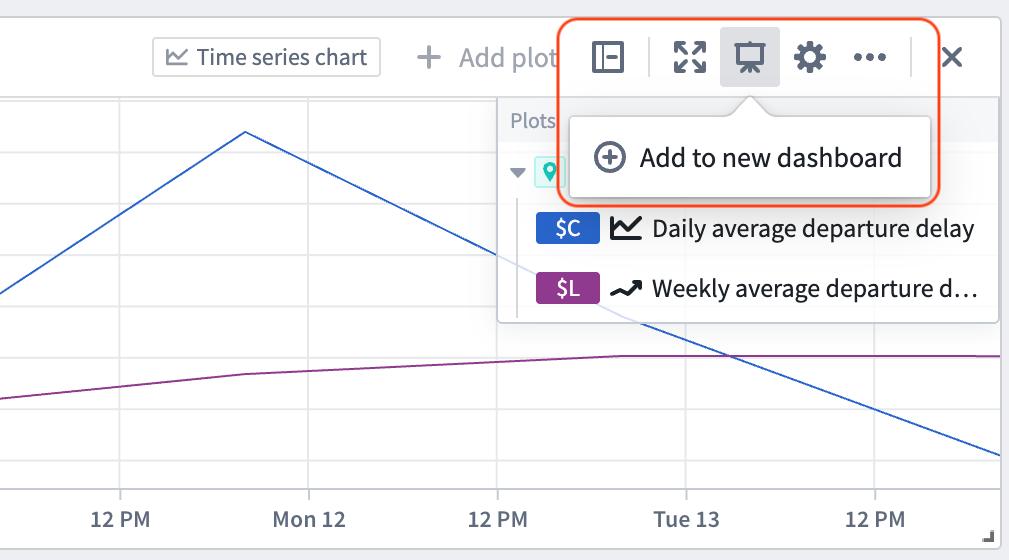
- Select Add to new dashboard from the top right corner of the time series chart containing the rolling weekly aggregate and the average departure delays for the airport.
- Open your dashboard using the dashboard icon in the left sidebar. From the dashboard view, drag the numeric aggregations representing the minimum and maximum weekly average delay and the week over week variation from the left panel into the dashboard content.
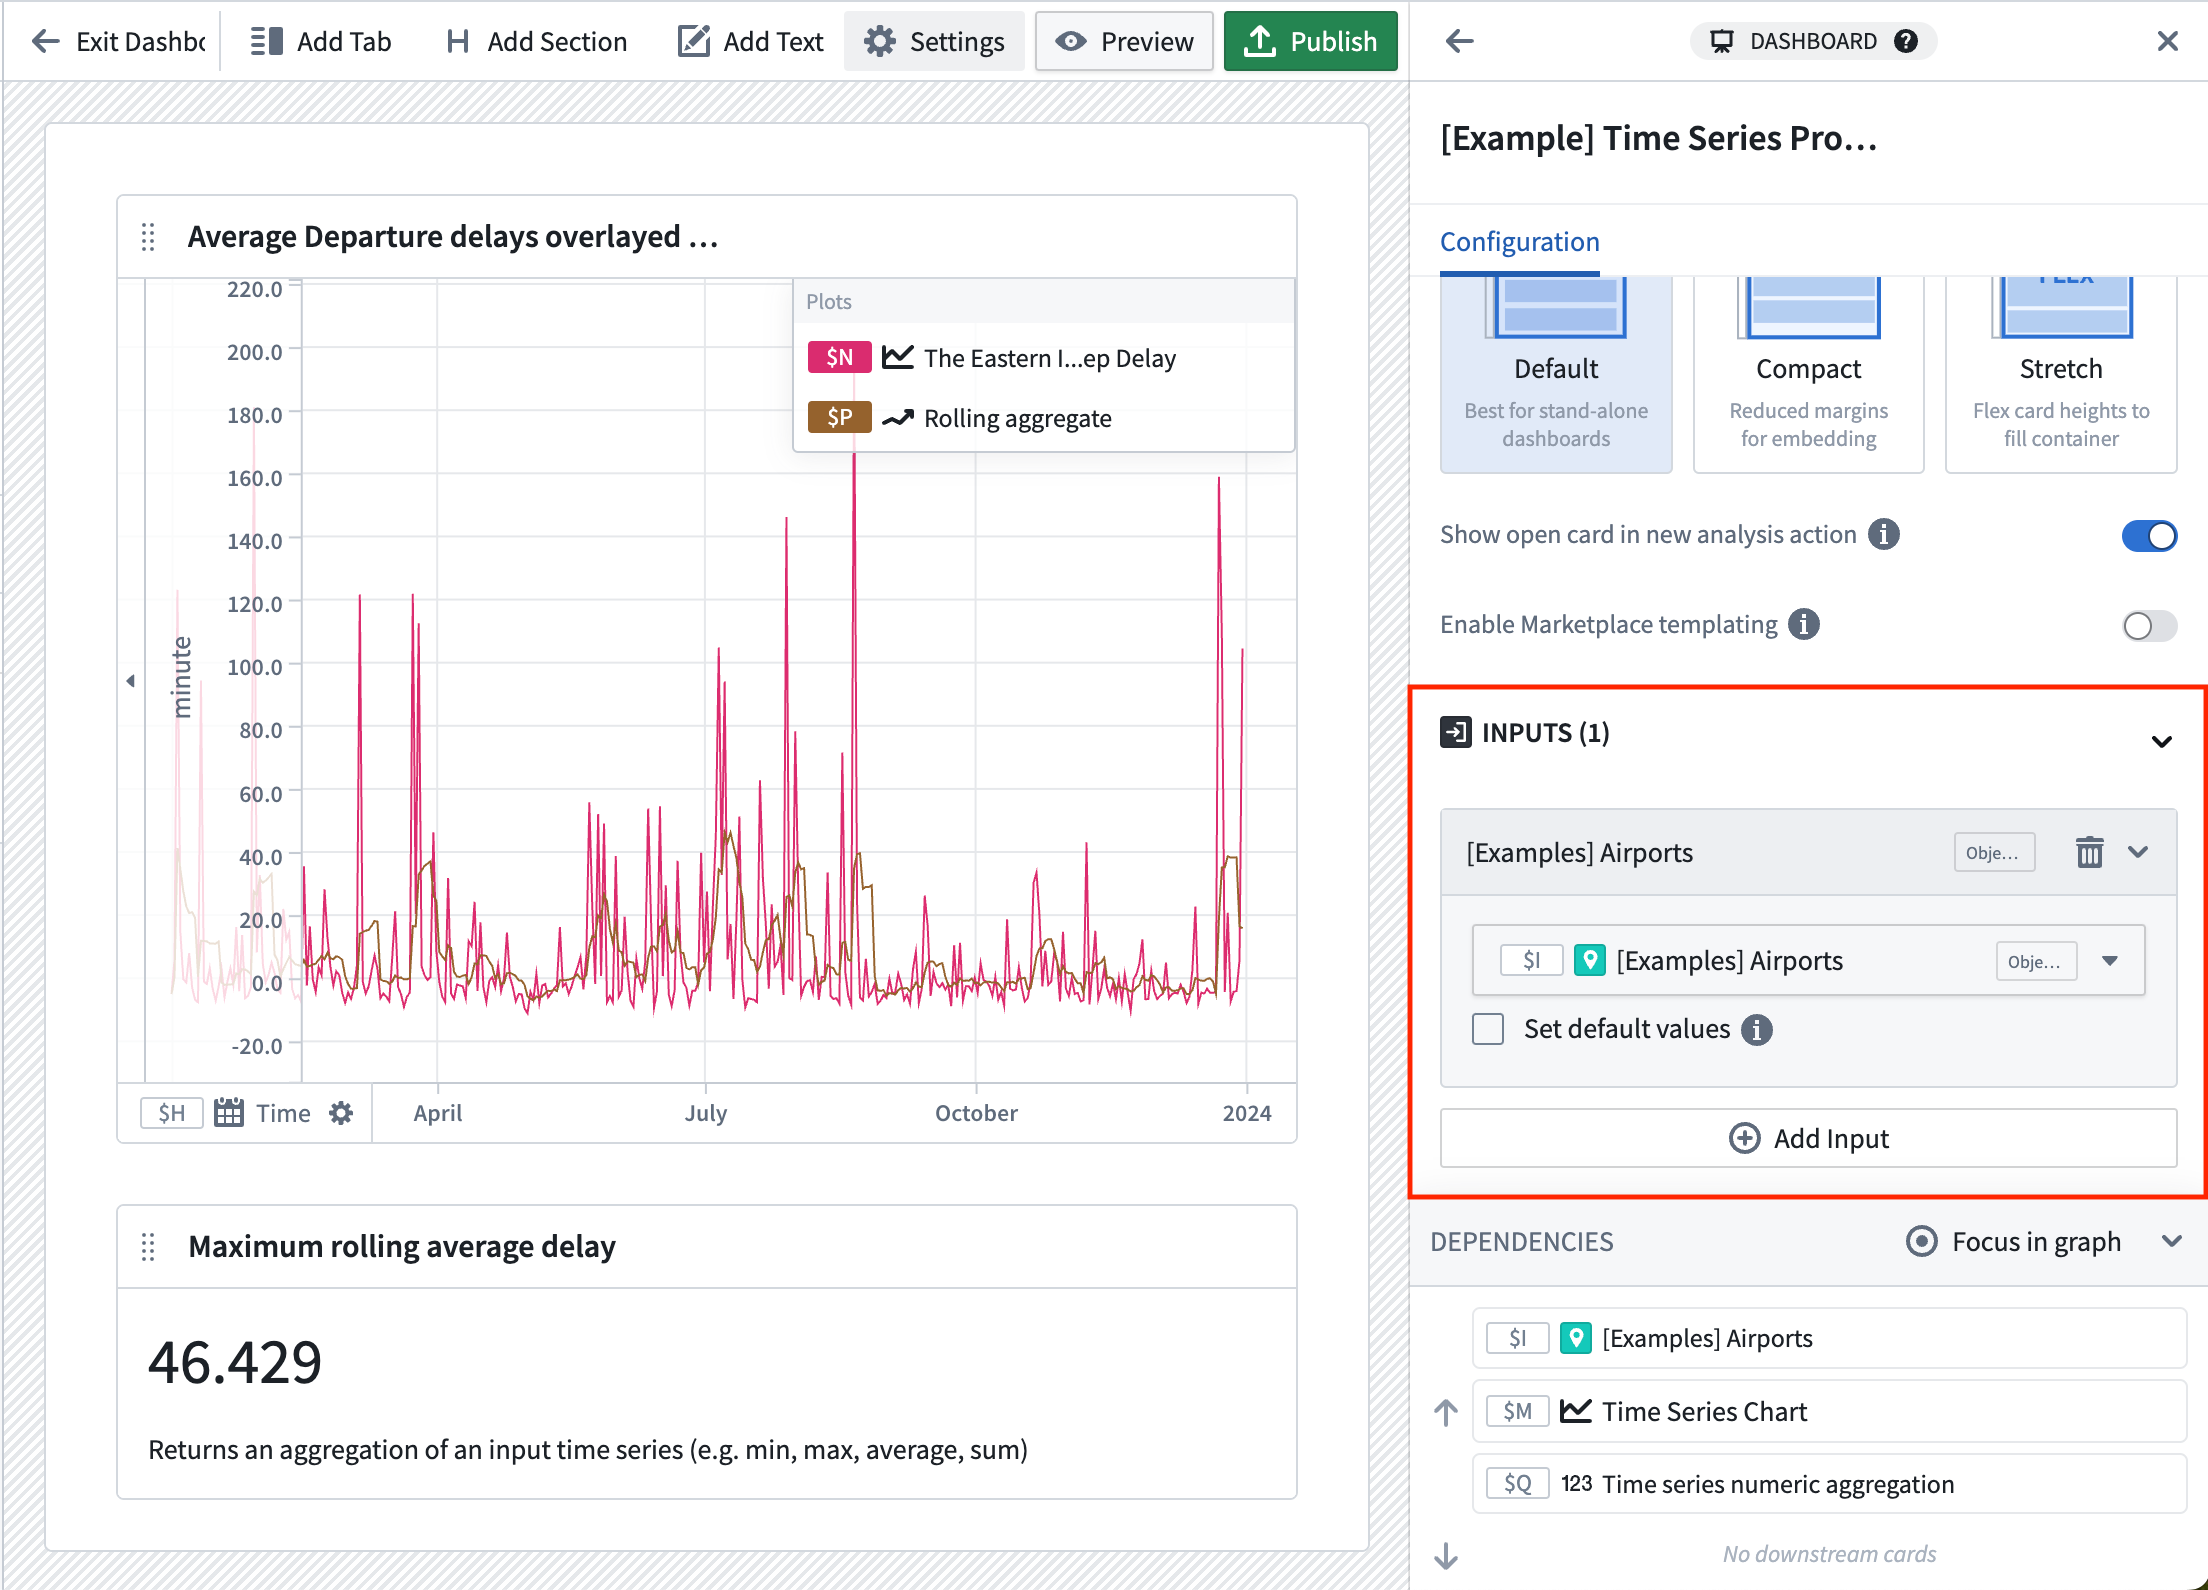
- In the Inputs section of the Dashboard settings panel on the right, add three inputs for the
Airportobject selector parameter, the start time parameter, and the end time parameter.
- Publish the dashboard.
Part IV: Embed your dashboard in Workshop
- Create a date range widget for controlling the start and end times.
- Add a Quiver Dashboard widget, then select your newly created dashboard. Additionally, wire up the workshop airport
Selected Airport,Start dateandEnd datevariables to the associated Quiver dashboard inputs.
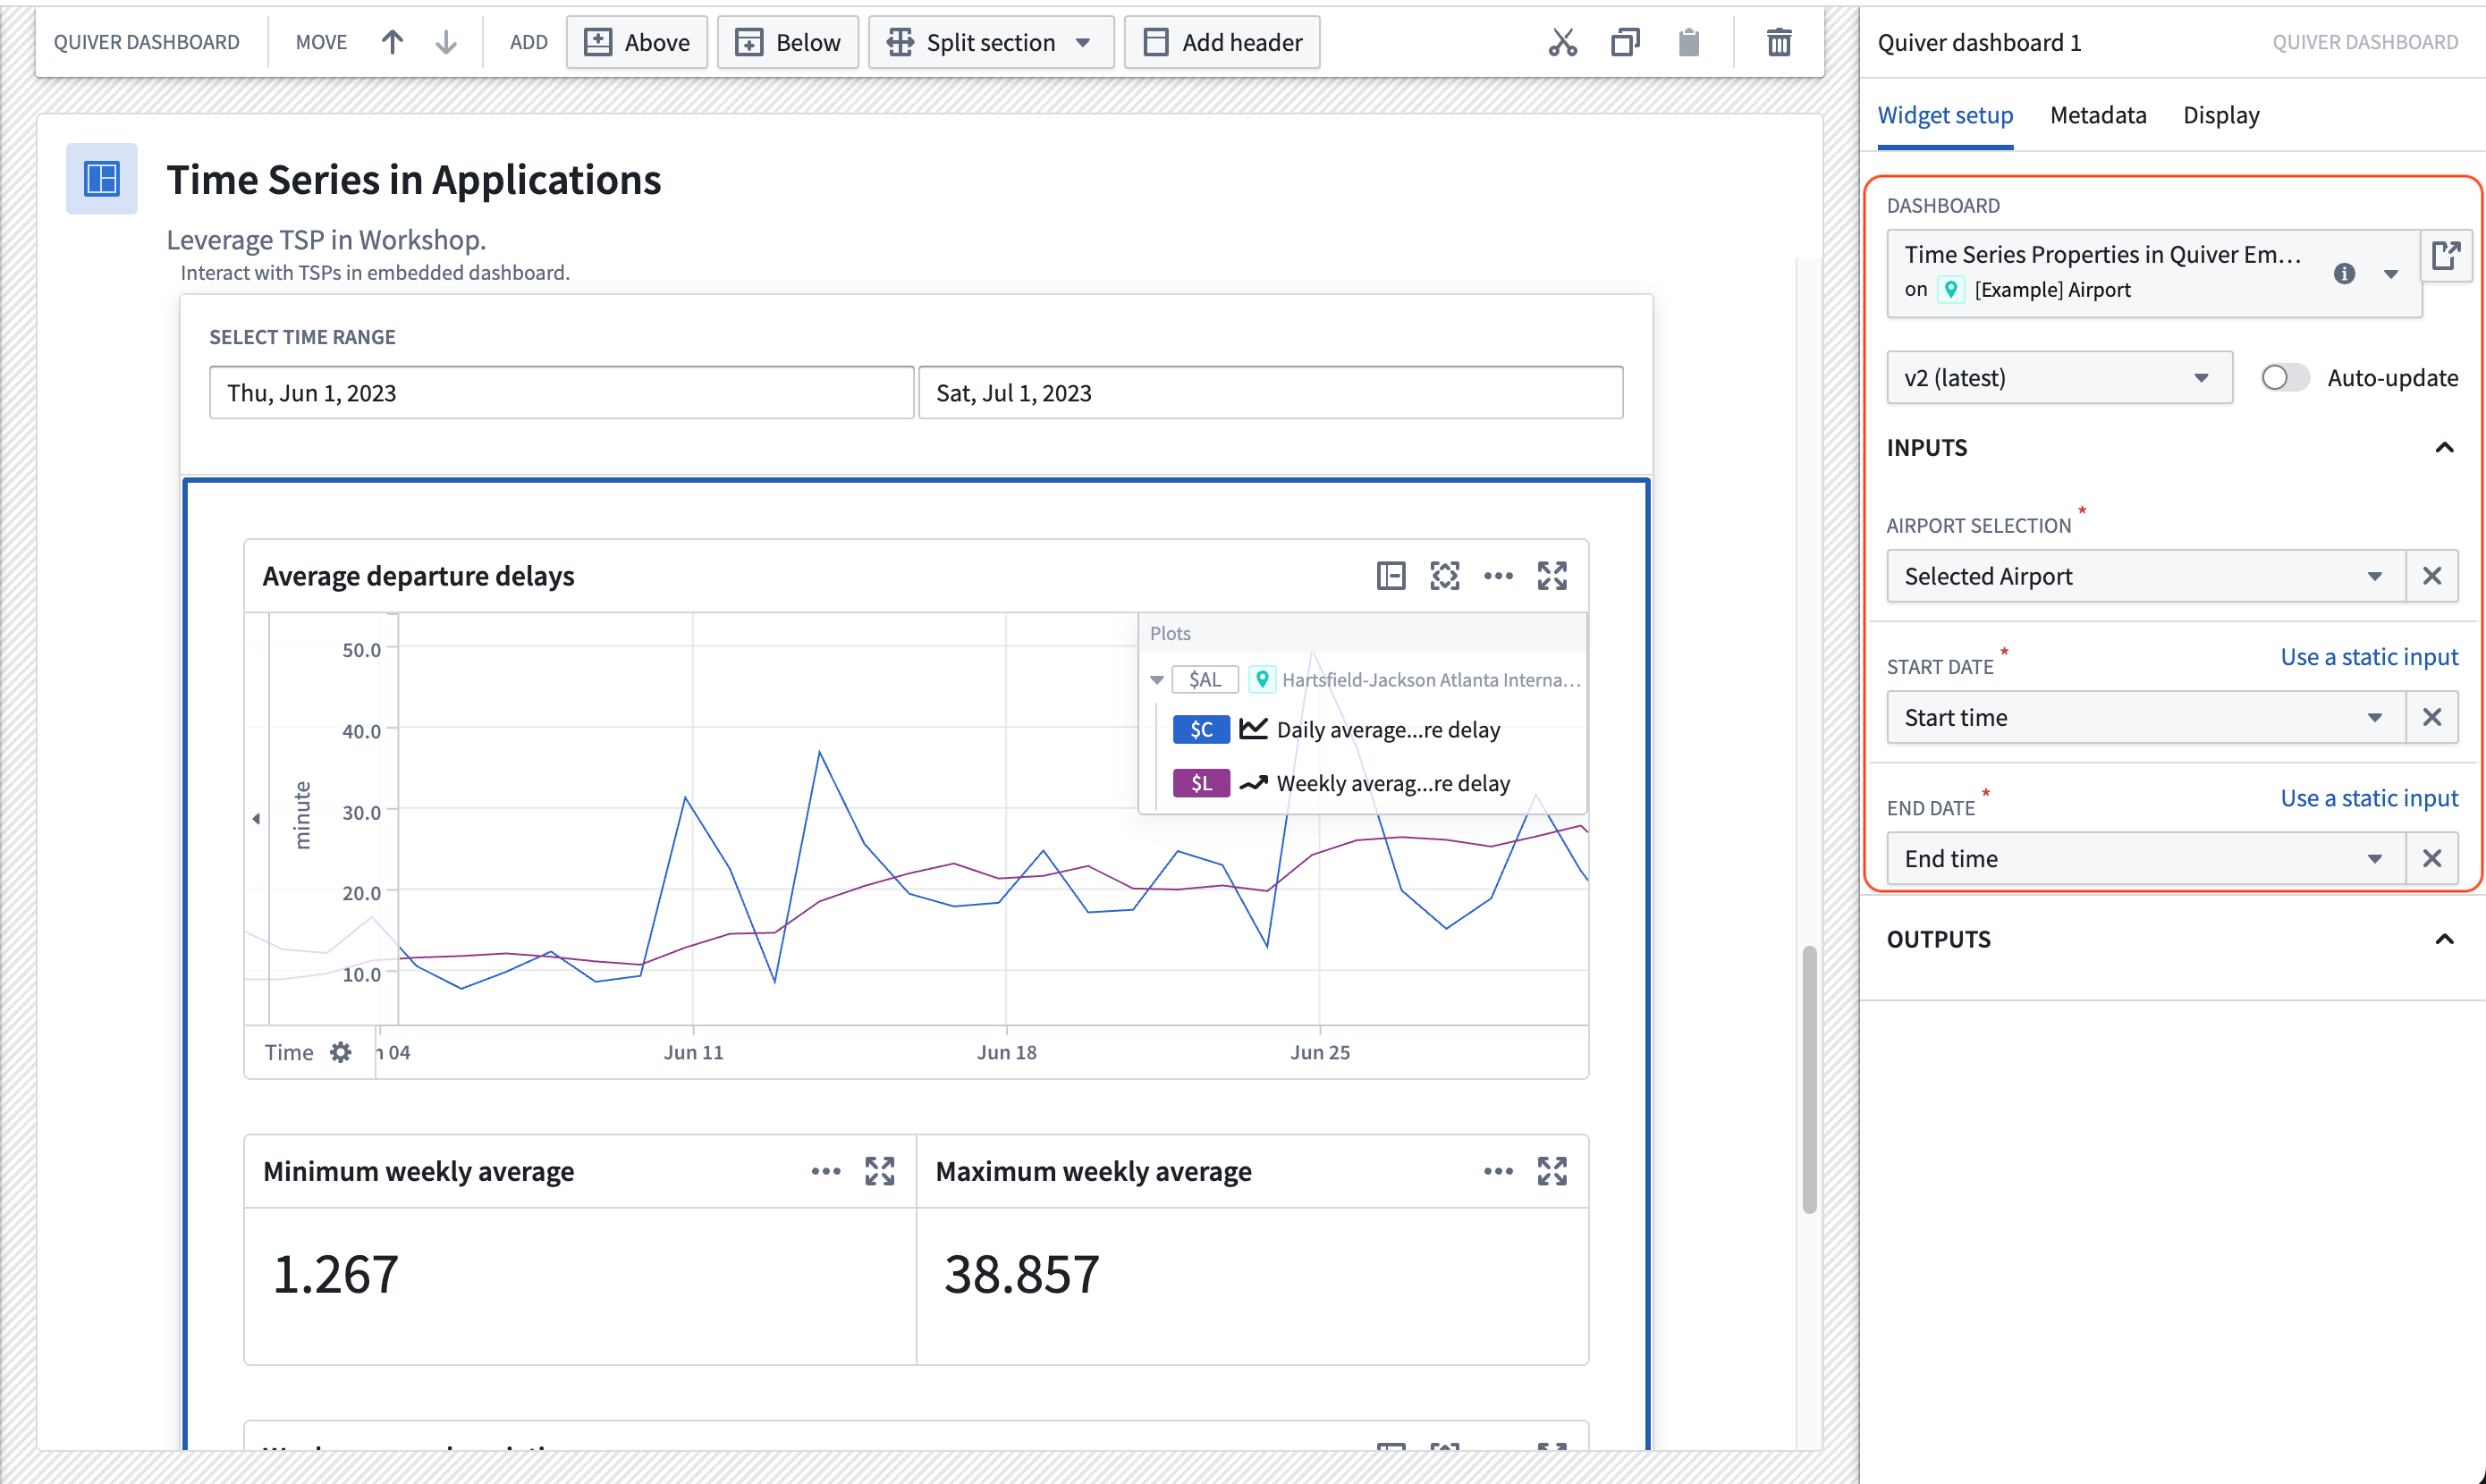
Now, the selected Airport object and the configured time range in the Workshop module will be reflected in the Quiver dashboard.
中文翻译
在 Workshop 模块和 Quiver 分析中使用对象的时间序列属性
本示例中构建的 Workshop 模块([示例] 对象的时间序列属性 | 延迟 TSP)基于参考本体中的航空本体构建,该本体在您的环境中可能可用也可能不可用。有关这些对象之间关系的更多信息,请参阅用例概述。在您使用时间序列属性配置自己的 Workshop 模块时,本示例模块将作为参考。
在 Workshop 中选择对象
模块的选择对象部分包含两个标准的 Workshop 微件功能。下文简要说明了这些微件,您可以在我们的文档中了解 Workshop 的通用功能。在向模块添加时间序列属性之前,请按照以下步骤配置这些微件。
第一部分:添加筛选列表微件
筛选微件应获取 Flight 对象集,并基于 Airport 属性应用筛选。该筛选微件应输出一个 Airport 筛选,可用于对象表格微件。
- 在您的 Workshop 模块中,选择 + 添加微件,然后选择筛选列表微件。
- 在筛选列表微件的右侧配置中,为对象集输入创建一个新变量,并将其命名为"所有机场"。起始对象集应使用
[Example] Airport对象类型。
- 通过选择 + 添加筛选按钮,添加
Airport、Complete Flight History、Airport State Name、Arriving Flight Count和Departing Flight Count属性。
- 向下移动到筛选输出字段,您会看到已为您创建了一个筛选输出。为其指定一个描述性名称,如"机场筛选";无需其他配置。
第二部分:添加对象表格微件
对象表格微件将使用户能够筛选对象集并选择一个机场进行进一步研究。
- 在您的 Workshop 模块中,选择 + 添加微件,然后选择对象表格微件。
- 在输入数据部分,创建一个新变量并将其命名为"已筛选机场"。在起始对象集下,为
all airports选择现有对象集变量。
- 在筛选...部分,选择使用变量,然后选择我们为筛选列表微件创建的输出变量
airport_filter。
-
在列配置中,通过选择 + 添加列来添加
Title、Daily Avg Arr Delay、Daily Avg Dep Delay和Daily count of flights列。 -
将默认排序配置为属性,然后选择选择要排序的属性。接着,选择
Arriving Flight Count。
- 在对象表格配置的选择部分,设置所选表格的输出。配置输出以对所选机场的时间序列属性进行分析。
Workshop 中的时间序列属性
模块的Workshop 中的时间序列属性部分使用了 Workshop 中可用的时间序列转换。按照以下说明设置仪表板中显示的 Chart XY 和指标卡微件。
第一部分:添加 Chart XY 微件
- 在您的 Workshop 模块中,选择 + 添加微件,然后选择 Chart XY 微件。
- 在右侧的配置菜单中,选择添加一个绘图图层。
- 在菜单中选择该图层,将数据输入配置为时间序列集。
- 创建一个新变量,包含
daily count of flights for selected airport时间序列属性,其中所选机场是对象表格微件的输出变量。请务必为新变量指定一个易于理解的名称。
- 为
daily dep delay for selected airport时间序列属性添加另一个绘图图层和变量。 - 为
Weekly Avg Dep delay属性添加第三个绘图图层。这次,在设置时间序列集变量时,选择同时添加一个转换。在转换中,选择滚动,然后选择平均值,聚合方法为 1 周。请务必为新变量指定一个易于理解的名称。
- 确保轴已设置,以便每个图层都有一个轴。您还可以选择每个绘图图层的轴单位显示位置(图表的左侧或右侧)。
第二部分:在 Chart XY 微件旁边添加指标卡
- 添加一个指标卡微件。
- 在配置菜单中,选择添加指标或使用添加微件时创建的默认指标。然后,悬停在指标上以打开更多配置选项,并选择数字作为值类型。
- 选择选择数值...,悬停在新建数值变量上,然后选择时间序列。
- 选择您在设置 Chart XY 微件的第三个绘图图层时创建的
Max weekly average departure delay变量。 - 选择最大值聚合类型,时间范围为全部时间,作为单值指标。请务必为新变量指定一个易于理解的名称。
- 根据需要设置数字格式。
Quiver 中的时间序列属性
以下指南假设您具备 Quiver 导航的基本知识。要了解有关 Quiver 通用功能的更多信息,请查阅我们的文档。
示例 Workshop 模块的Quiver 中的时间序列属性部分包含一个嵌入的 Quiver 仪表板。该 Quiver 仪表板执行与上述 Workshop 微件类似的计算。按照以下说明设置仪表板中显示的时间序列图表和指标卡。
完成以下步骤后,生成的仪表板应如下例所示:
第一部分:在 Quiver 分析中设置时间序列比较
-
创建一个新的 Quiver 分析,然后从顶部栏打开时间序列菜单。
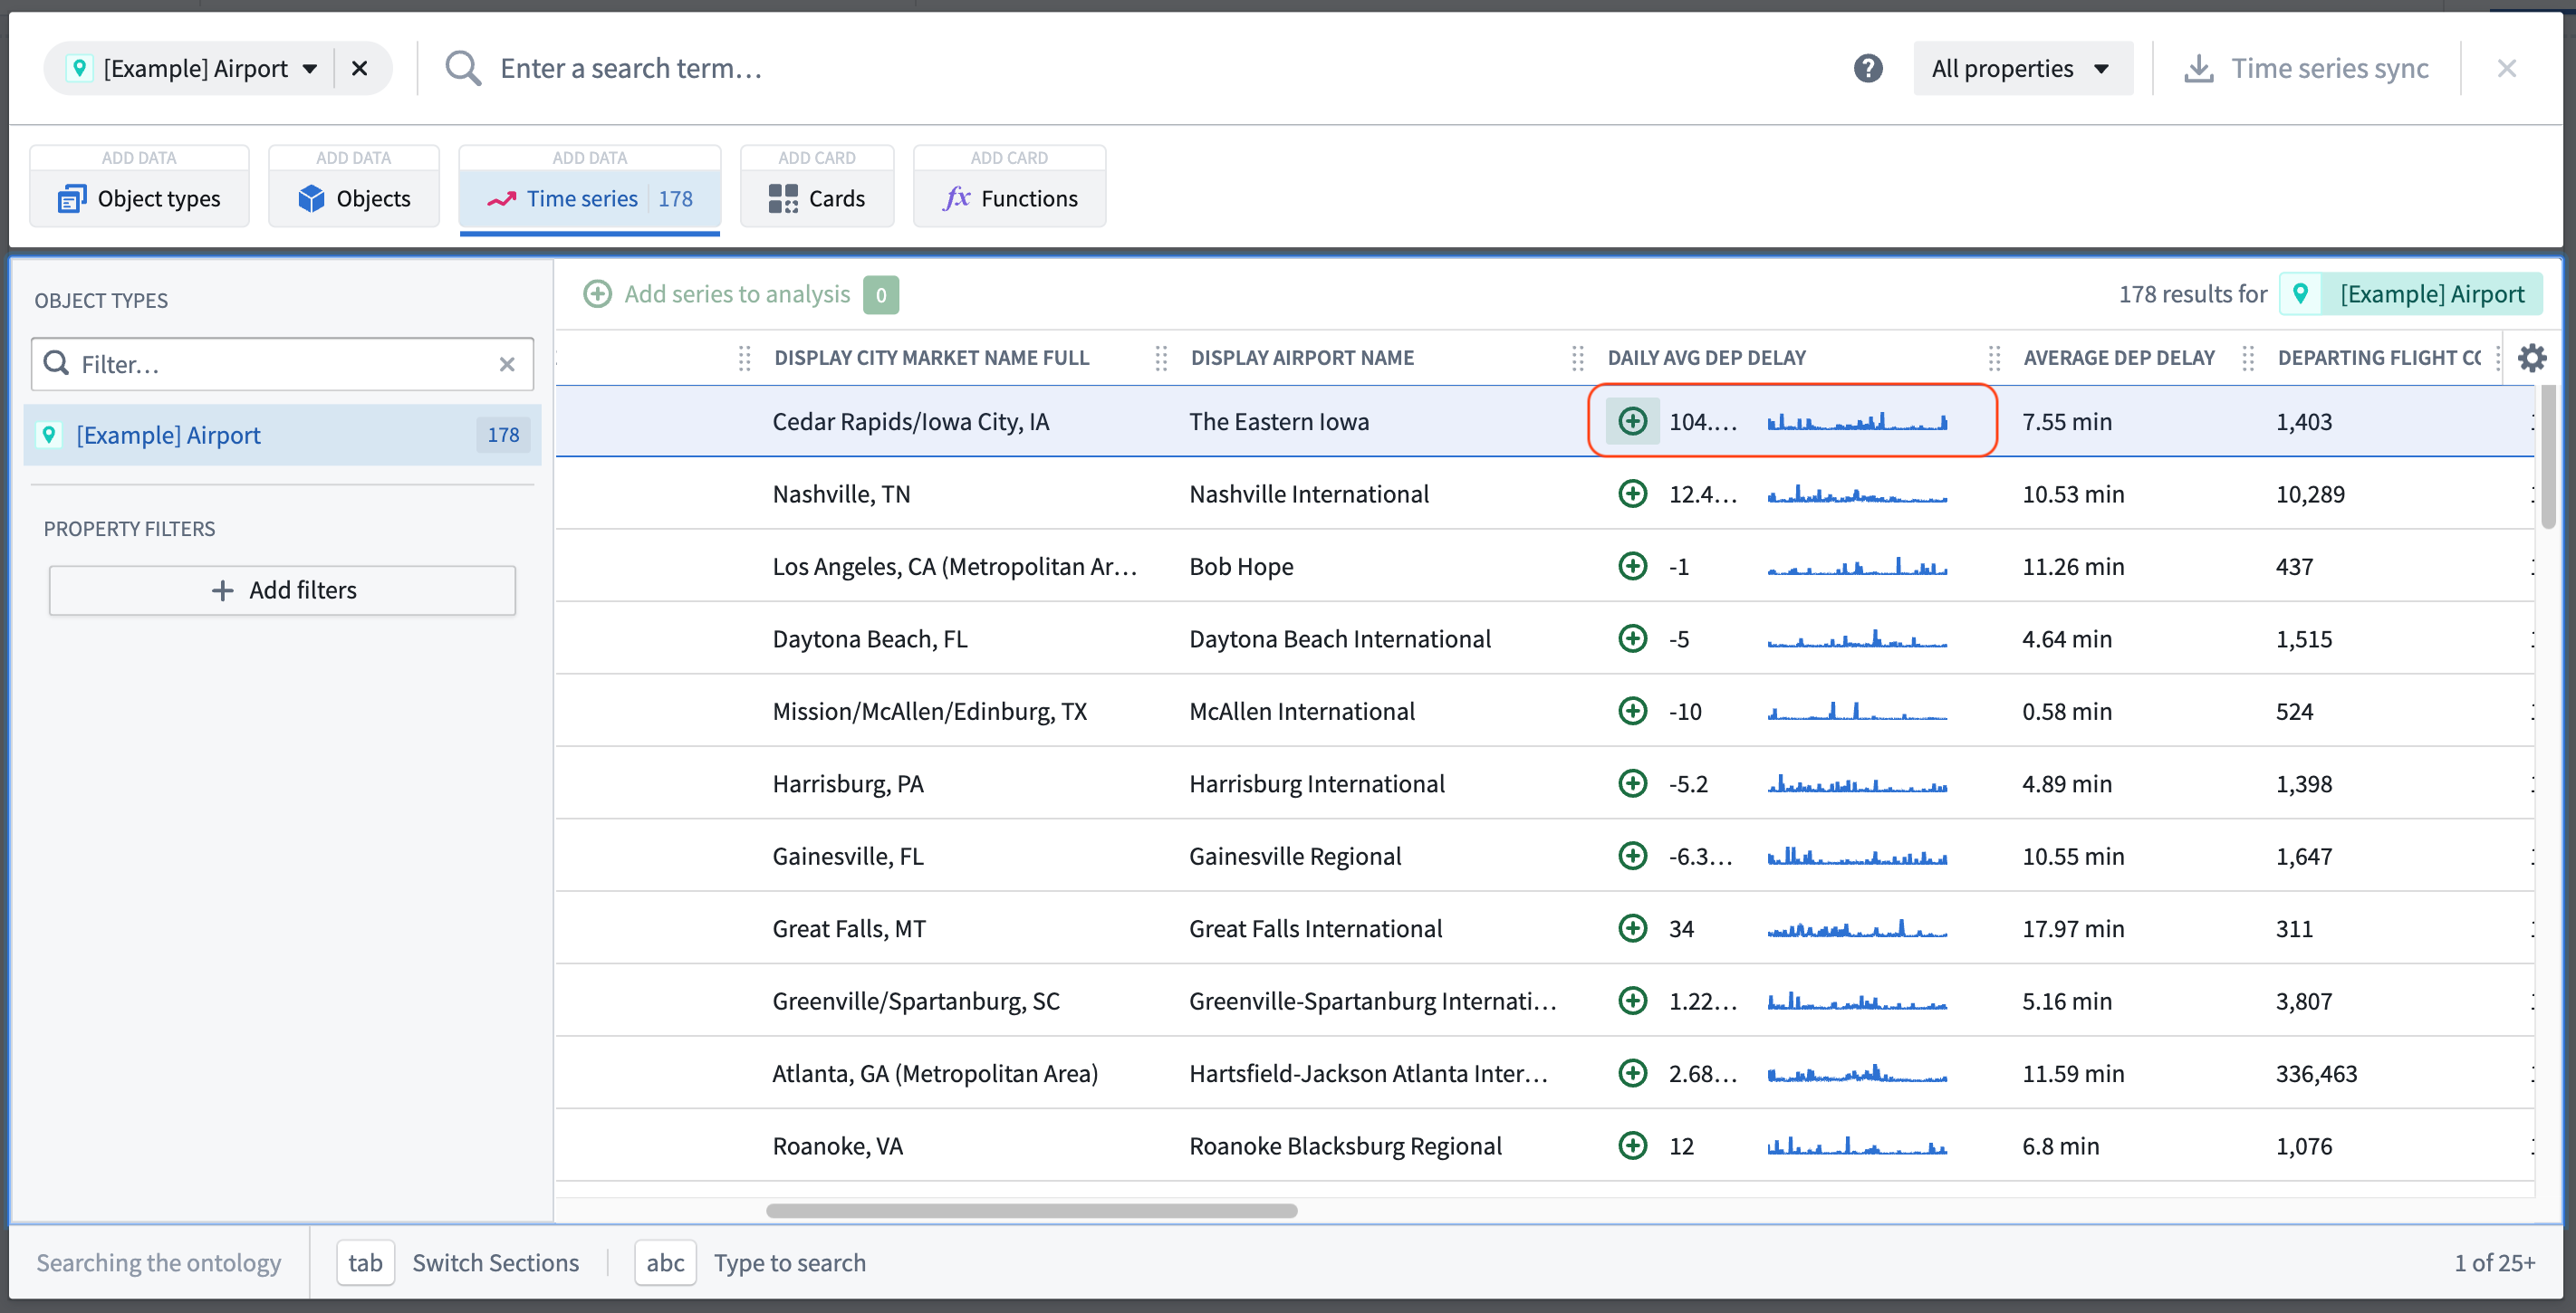
-
在左上角,将结果筛选为
Airport对象类型,并从其中一个对象中选择 Daily Avg Dep Delay 时间序列属性。
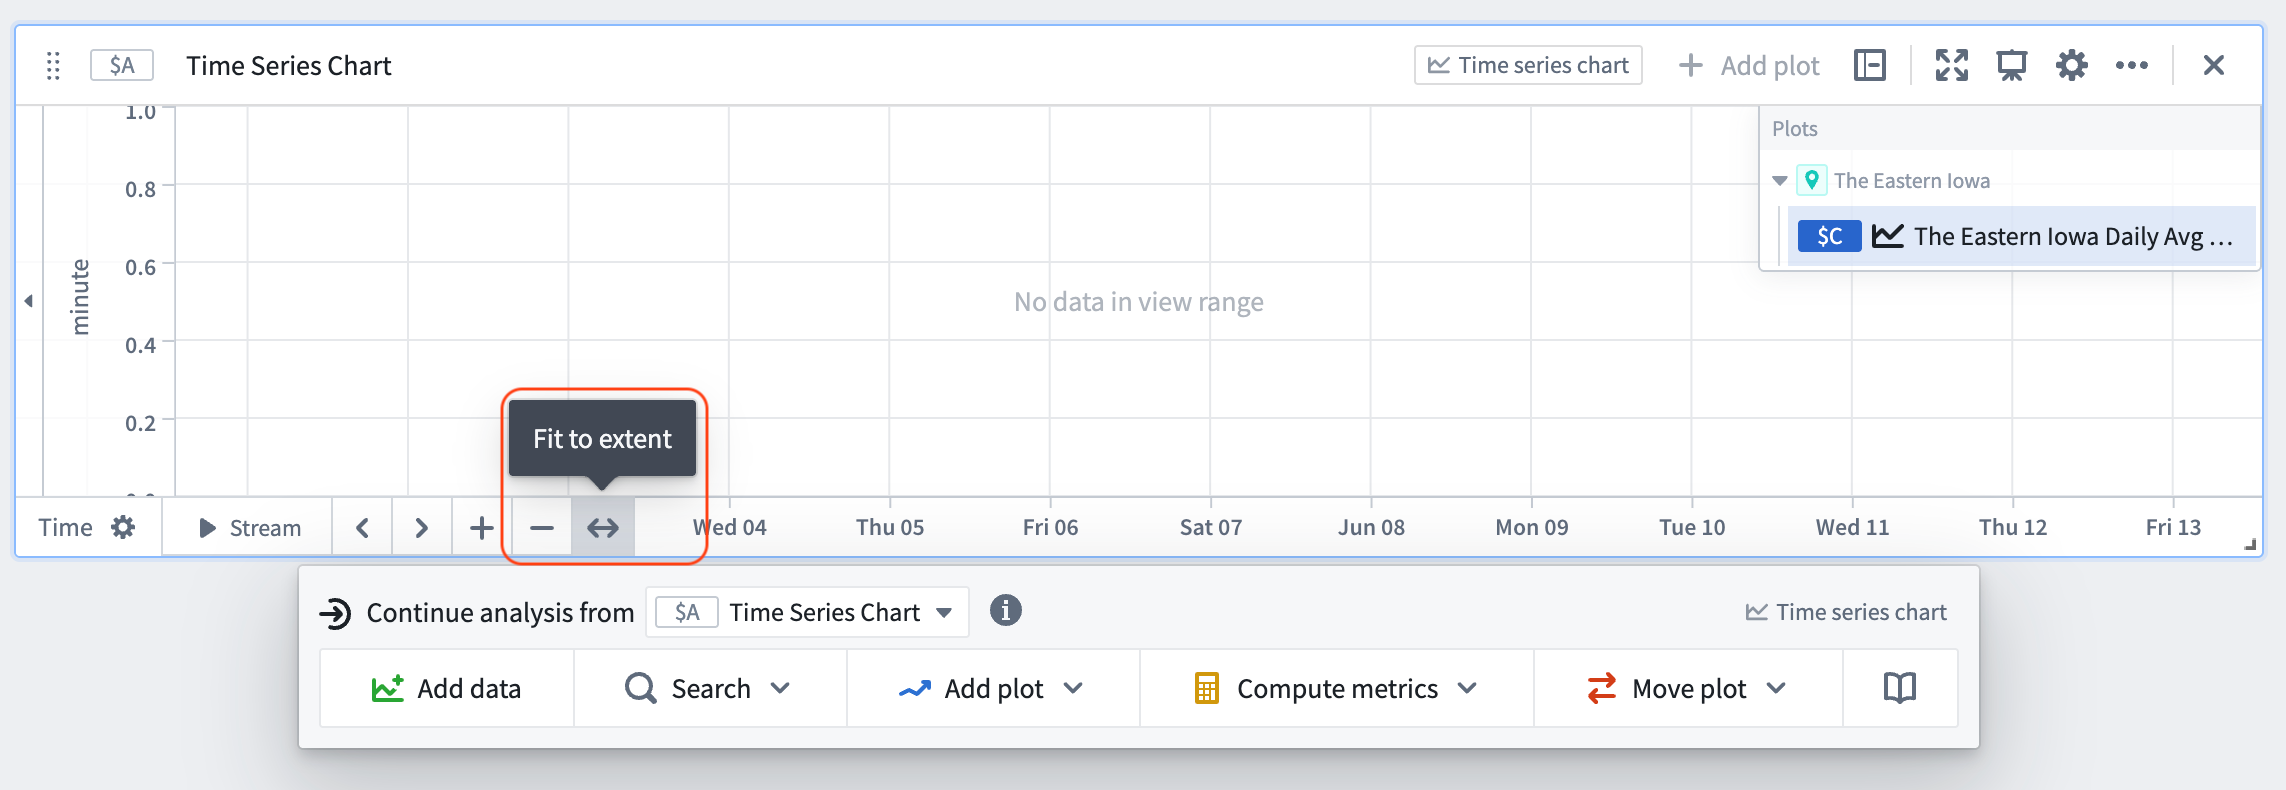
- 将生成的绘图的 X 轴配置为适应范围,这将确保轴按数据的时间范围进行缩放。
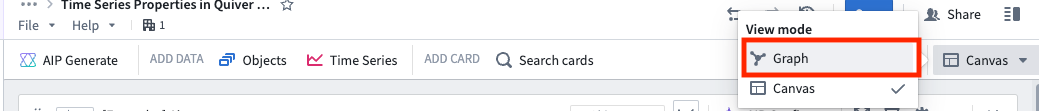
- 在可视内容的右上角选择图形,进入分析图形视图。
请注意,通过添加对象的时间序列属性,还会生成一个时间序列图表、一个数值轴(单位)和一个默认的共享时间轴卡片。
- 悬停在对象的时间序列属性卡片上,直到出现菜单。从下一步操作菜单中,从继续分析下拉菜单中选择时间序列属性。
- 选择添加绘图按钮,搜索"滚动聚合",将滚动聚合卡片添加到画布。
- 在卡片右上角的绘图设置菜单中,选择平均值,值为 1,单位为周,表示每 1 周。
- 悬停在绘图上,直到出现菜单。从下一步操作菜单中,继续分析新创建的滚动聚合。选择搜索并搜索"数值聚合"。在数值聚合设置中,将聚合类型设置为最小值。重复此步骤以添加一个最大值数值聚合卡片。
- 在分析内容面板中,找到默认共享时间轴。在右侧的配置侧面板中,打开受控选项,选择使用变量输入,然后在范围下拉菜单中选择新建日期/时间范围参数。这将创建一个新的日期/时间范围参数,用于控制共享时间轴的时间范围。
- 在参数面板中,您应该看到新创建的日期/时间范围参数。创建两个日期/时间参数,一个表示时间范围的开始,一个表示时间范围的结束。
- 选择步骤 9 中创建的日期/时间范围参数,在右侧配置面板中打开选择单独的起始和结束日期参数。然后,从下拉菜单中选择步骤 10 中创建的起始和结束参数。现在,绘图的时间轴可以由起始和结束参数控制。
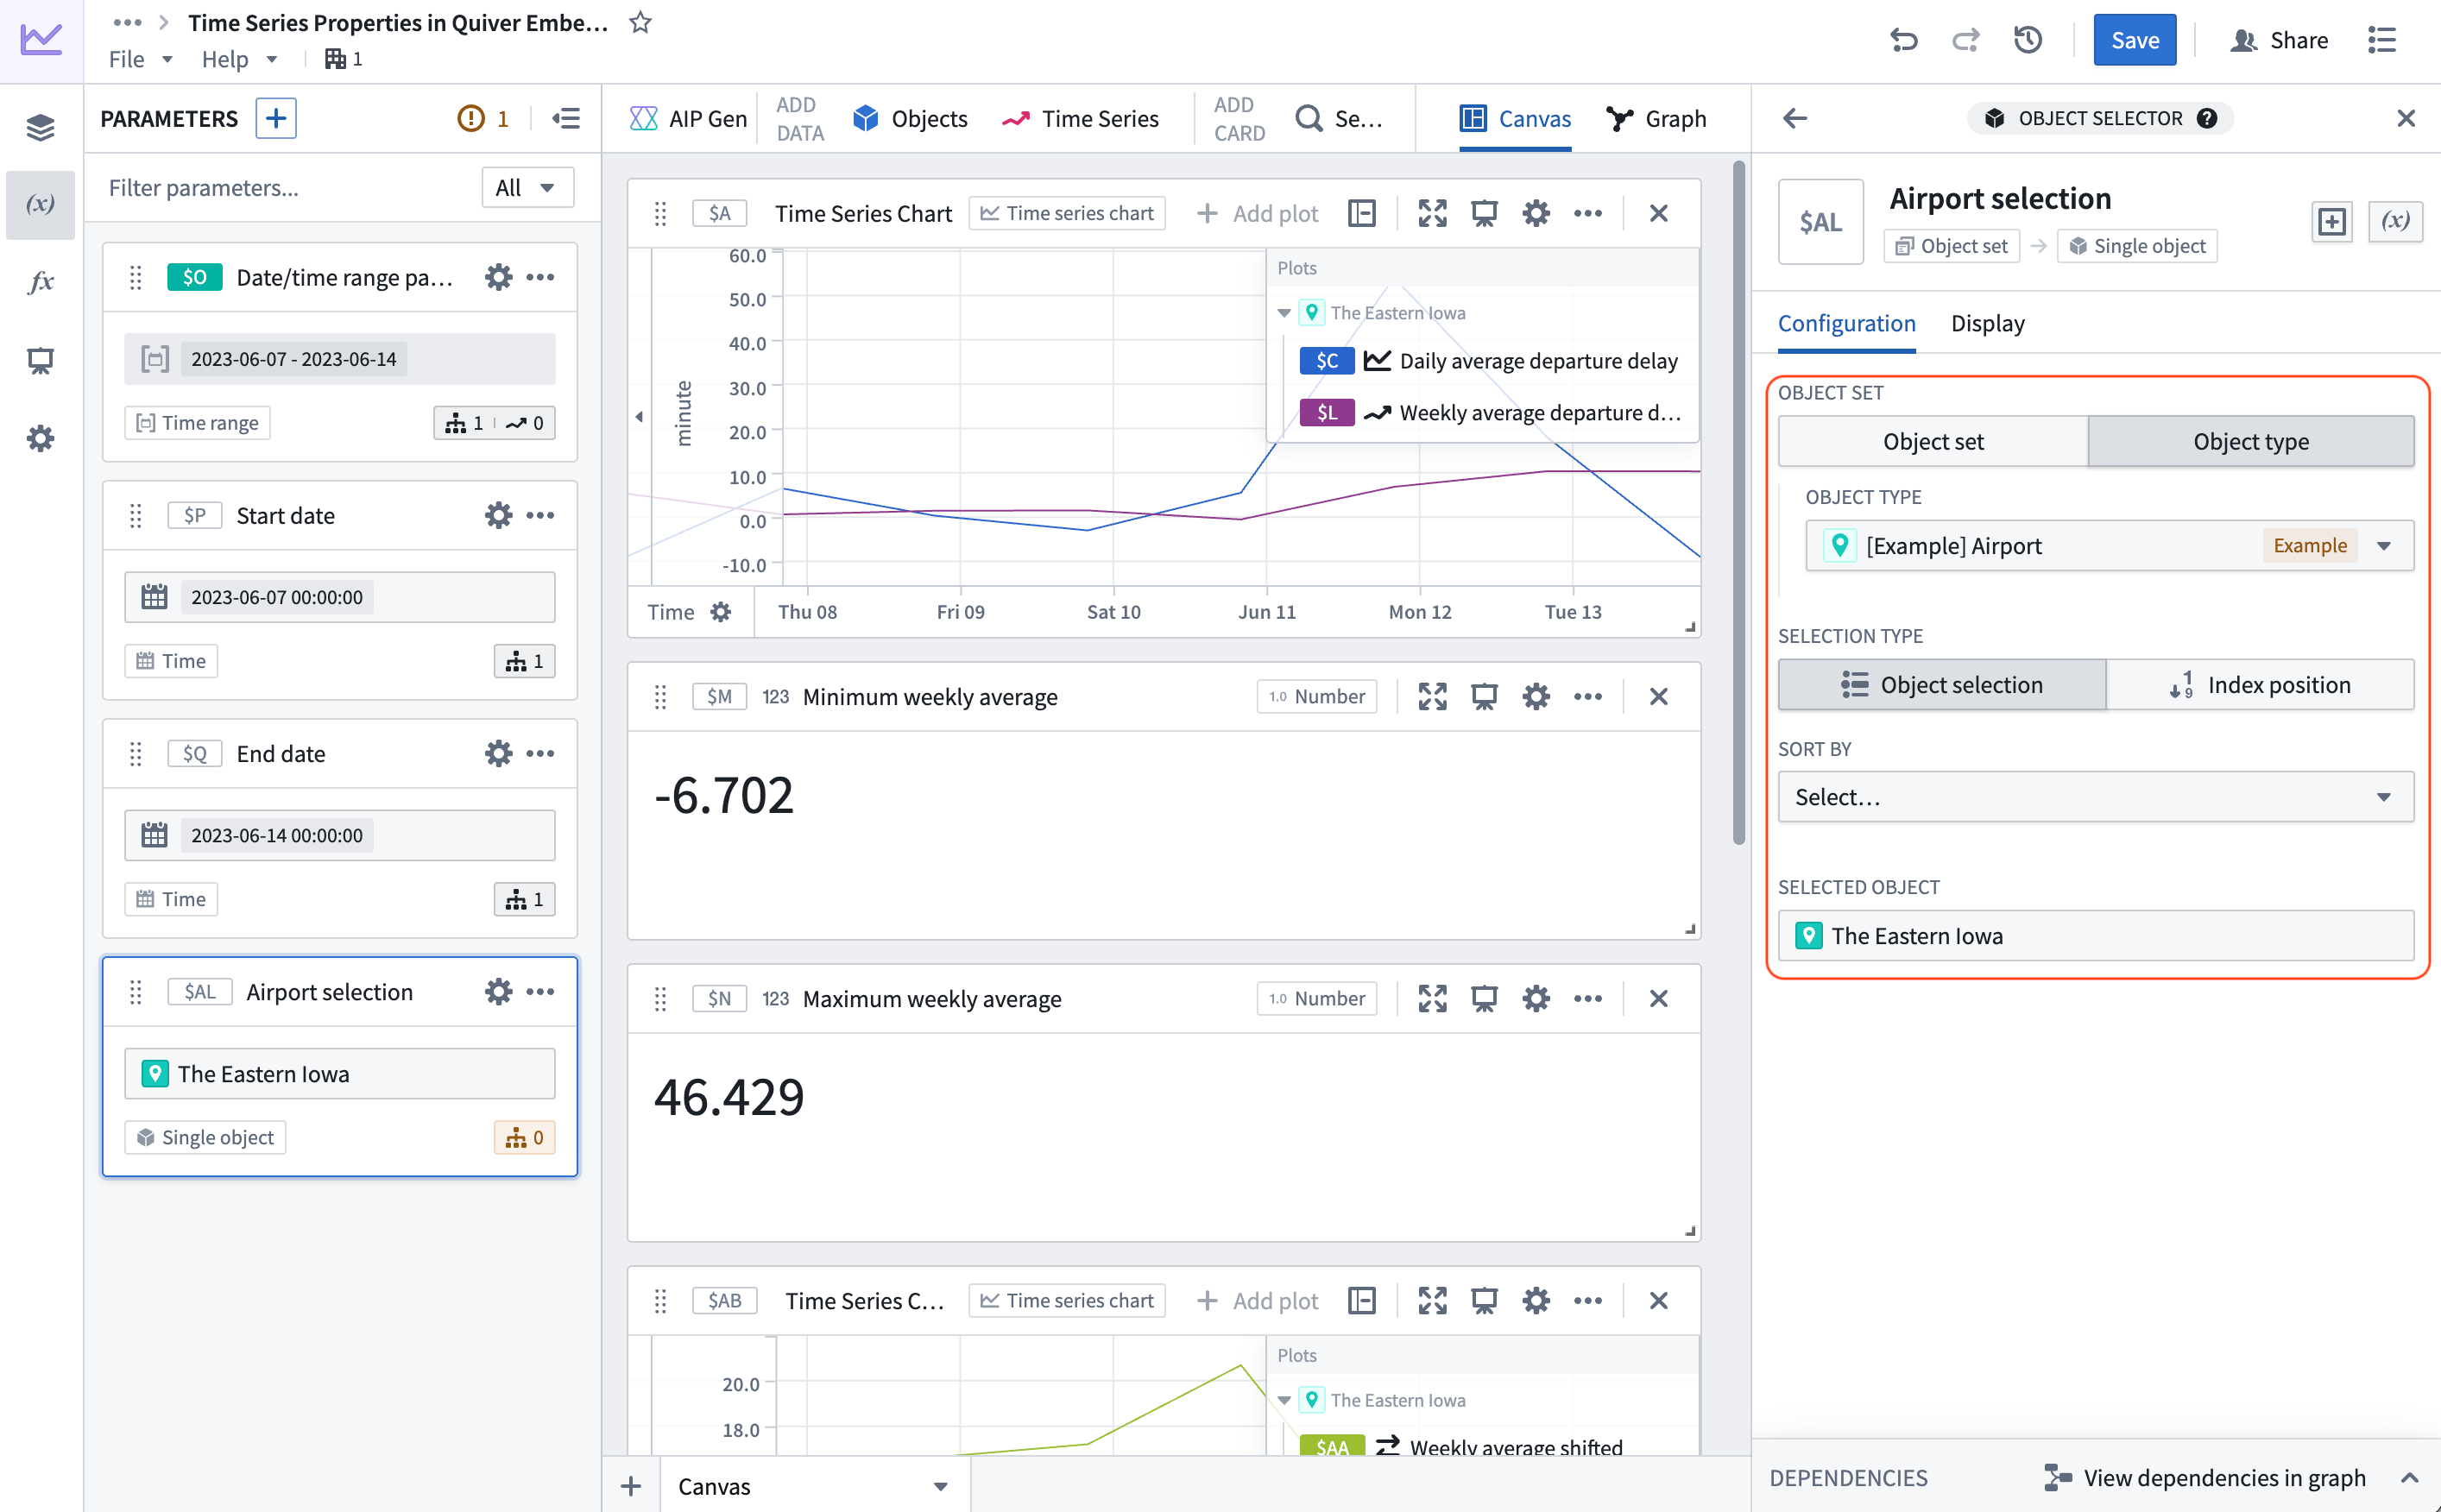
- 在参数面板中,创建一个新的对象参数。
- 在右侧配置面板中,选择
Airport对象类型,然后从下拉菜单中选择任意机场。
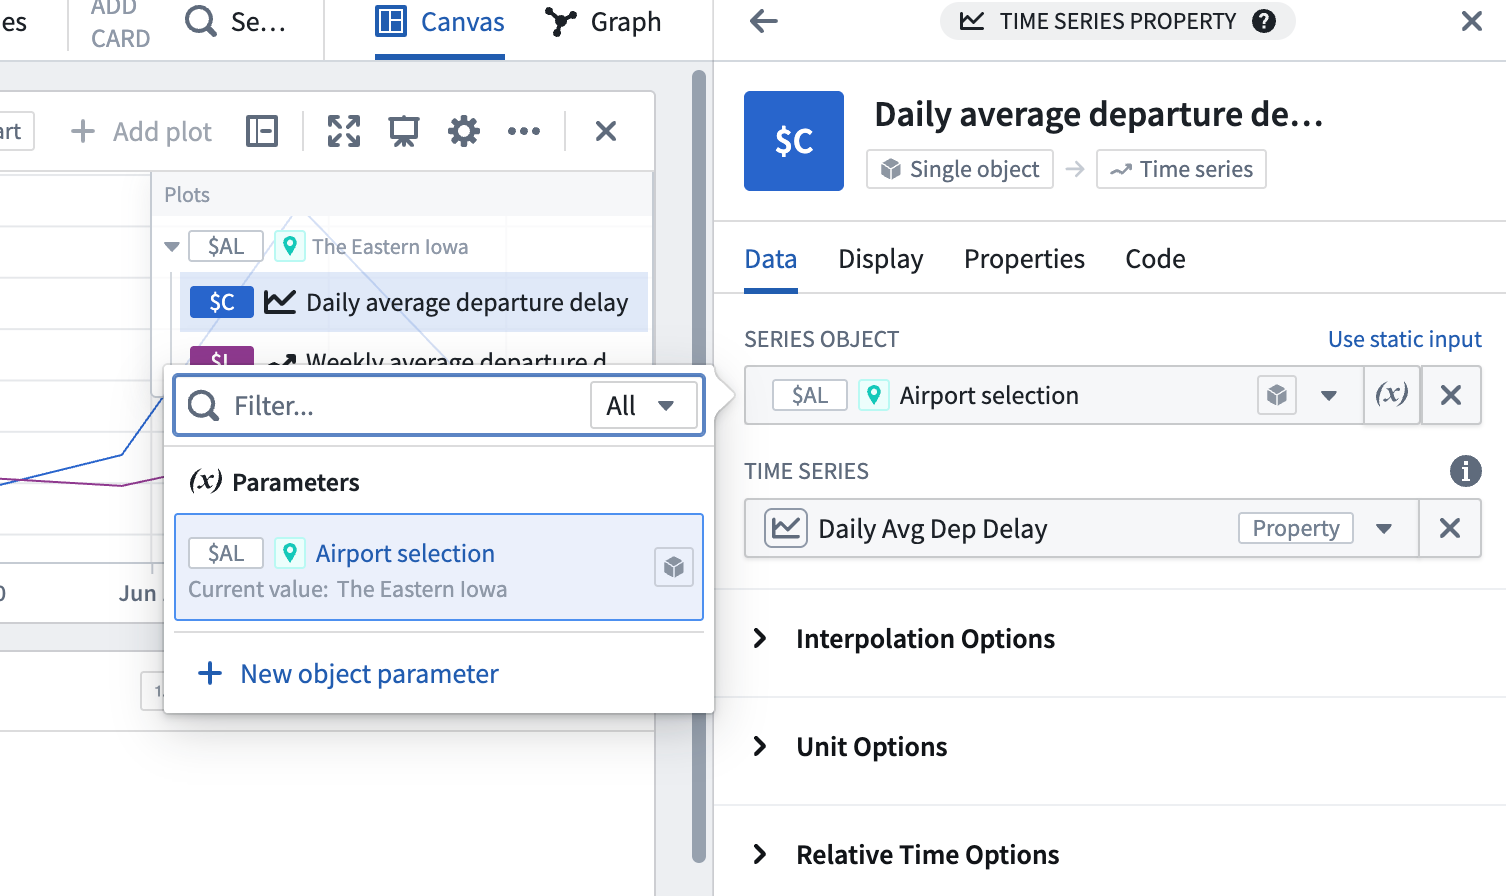
- 选择步骤 2 中创建的
Daily Avg Dep Delay卡片。在右侧配置面板中,选择系列对象配置旁边的使用变量输入,然后选择新创建的对象选择器参数。现在,机场可以被控制,Daily Avg Dep Delay时间序列将随我们所有的下游操作一起更新。
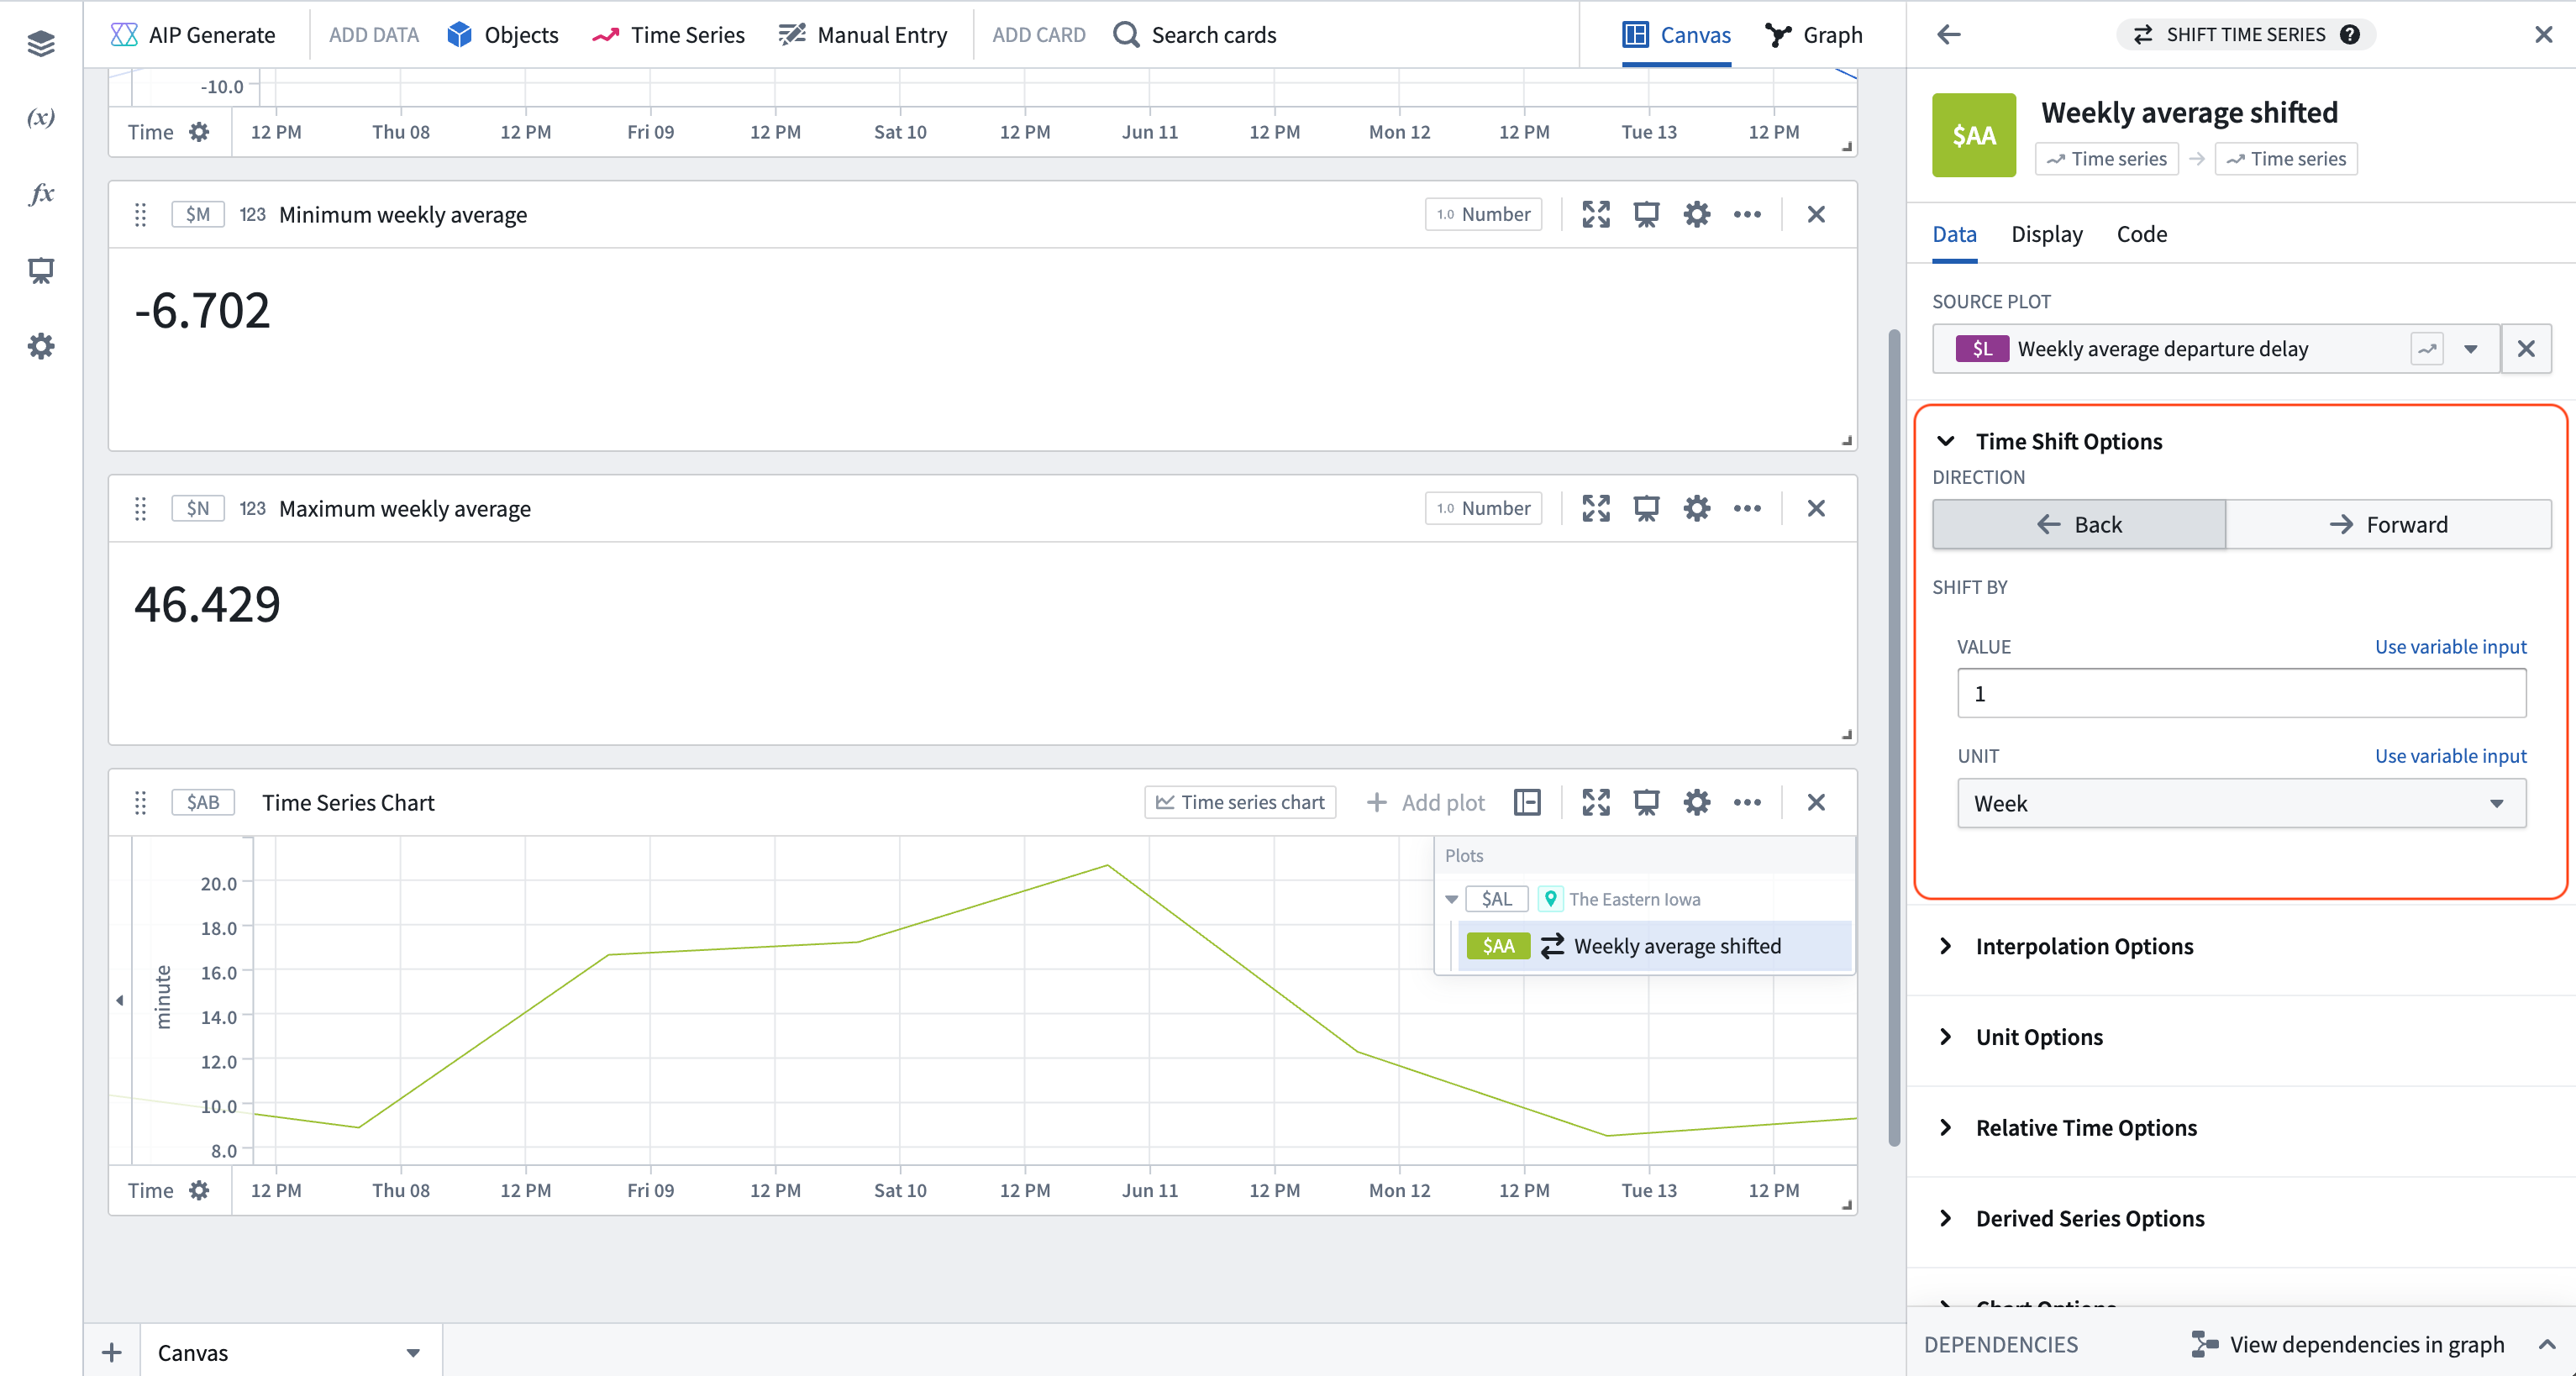
- 悬停在包含滚动周聚合的绘图上,从下一步操作菜单的继续分析下拉菜单中选择滚动聚合,然后搜索"时间序列平移"。添加时间序列平移卡片,并将其配置为将输入序列向后平移一周。
- 通过悬停在现有绘图上添加另一个绘图,使用下一步操作菜单中的搜索操作搜索"时间序列公式"。添加时间序列公式卡片,并在卡片配置中添加以下公式:
$L - $AA;其中$L是周平均出发延迟,$AA是向后平移一周的周平均延迟。结果是周环比变化。
第二部分:设置 Quiver 仪表板
- 从包含滚动周聚合和机场平均出发延迟的时间序列图表的右上角选择添加到新仪表板。
- 使用左侧边栏中的仪表板图标打开您的仪表板。从仪表板视图中,将表示最小和最大周平均延迟以及周环比变化的数值聚合从左侧面板拖入仪表板内容。
- 在右侧仪表板设置面板的输入部分,为
Airport对象选择器参数、开始时间参数和结束时间参数添加三个输入。
- 发布仪表板。
第四部分:将仪表板嵌入 Workshop
- 创建一个日期范围微件,用于控制开始和结束时间。
- 添加一个 Quiver 仪表板微件,然后选择您新创建的仪表板。此外,将 Workshop 的
Selected Airport、Start date和End date变量连接到相应的 Quiver 仪表板输入。
现在,Workshop 模块中选定的 Airport 对象和配置的时间范围将反映在 Quiver 仪表板中。