Create time series data with Pipeline Builder(使用 Pipeline Builder 创建时间序列数据)
The pipeline you will create with this guide will generate time series data that backs a time series sync to associate with time series properties on the Carrier, Route, and Airport object types to create new time series objects. This pipeline involves a more complex set up than standard mappings from time series datasets to time series properties, as we will make calculations on non-time series data to generate time series data. Review our Pipeline Builder documentation for information on general pipeline guidance.
The flight dataset we are working with includes the following columns that we will use to create time series properties:
- flight_id:
string| A unique string to identify the flight and every row in the dataset. - date:
date| The date the flight took place. - destination_airport_id:
string| The string to identify the destination airport. - airline_id:
string| The ID of the airline carrier. - origin_airport_id:
string| The ID of the origin airport. - dep_delay:
integer| The number of minutes the departure was delayed. - arr_delay:
integer| The number of minutes the arrival was delayed. - route_id:
string| A unique string to identify the route.
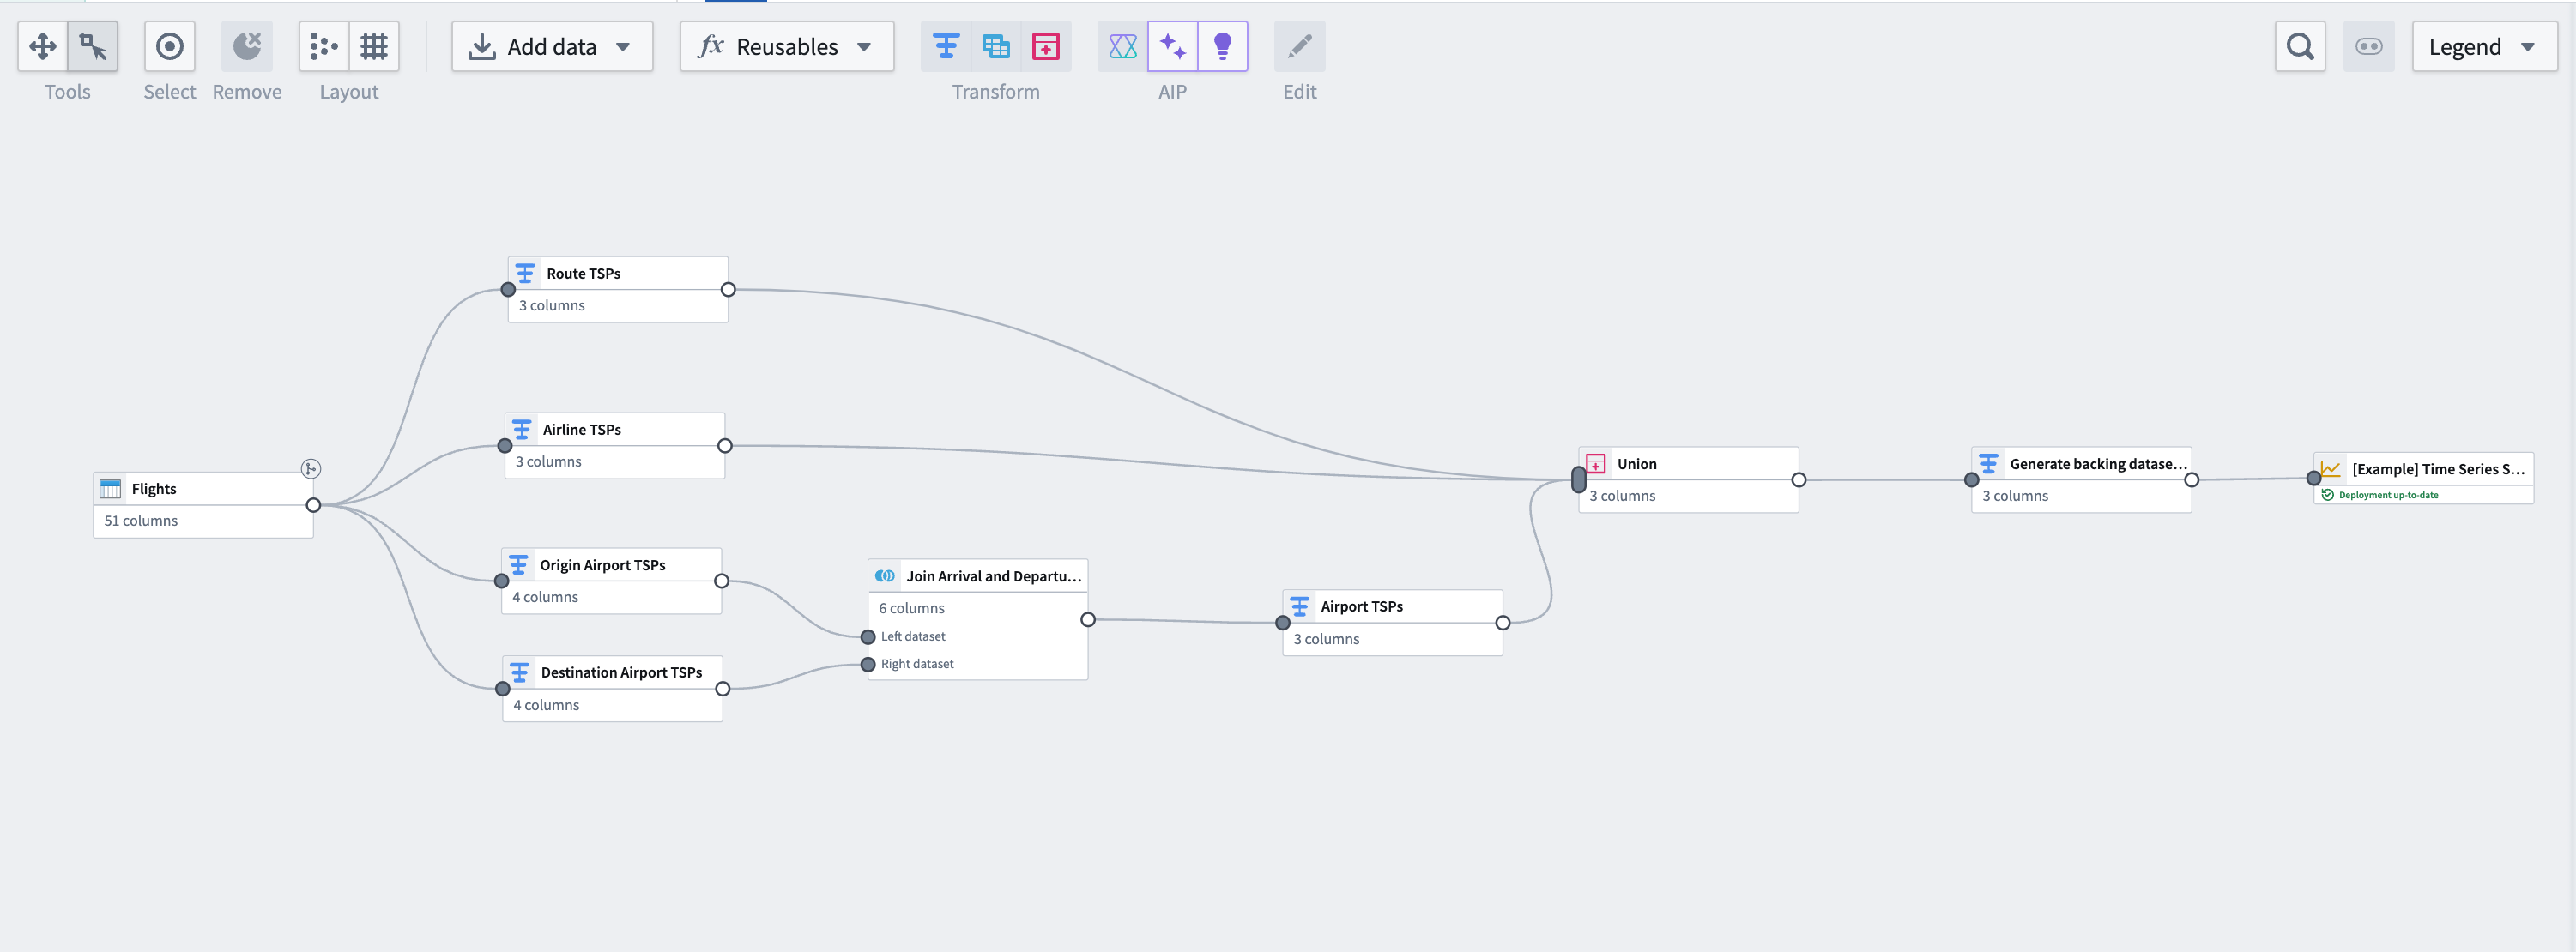
The pipeline at the end of this guide will look like this:
Part I: Generate time series data
Using the same flights dataset that is used to back the Flightsobject type, we can perform some aggregation transformations and generate time series data based on flight metrics. Note that this step is not necessary if you have time series data coming into Foundry from a historian or edge sensor. You can move on to generate a time series sync.
1. Apply transforms to Carrier and Route object types
From the flights dataset, apply transforms using the steps below. You will do this for both the Carrier and Route object types.
Aggregate the data
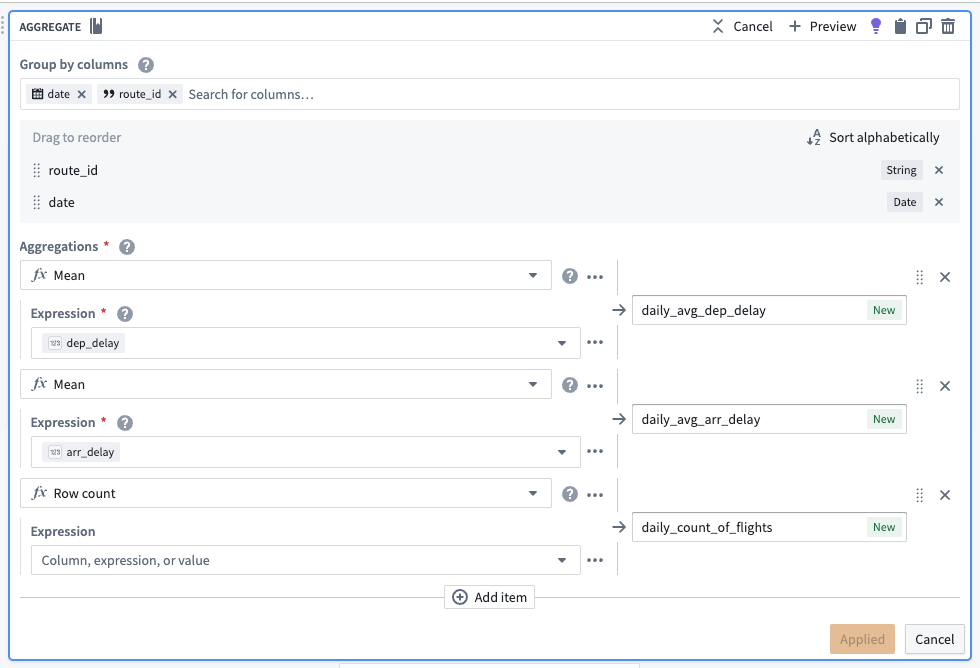
Use the aggregate transform to group by date and ID of the object, (in this case, using the route_id for the Route object type; you will separately need to do the same using airline_id for the Carrier object type), and calculate average arrival delays, average departure delays, and daily flight counts.
After aggregating, the dataset should preview with the following schema:
| route_id | date | daily_avg_dep_delay | daily_avg_arr_delay | daily_count_of_flights |
|---|---|---|---|---|
| ATL -> SFO | 2023-06-12 | 33.4545454545450000 | 40.0000000000000000 | 11 |
| ATL -> FLL | 2023-08-24 | 29.7272727272720000 | 19.4090909090909100 | 22 |
| ATL -> TVC | 2023-07-05 | -8.0000000000000000 | -8.0000000000000000 | 1 |
Cast to a new data type
To use this new data as a time series, we must create a timestamp type column. To do this, use the cast transform to cast the date column to a timestamp type column. We will also soon apply an unpivot transform to merge daily_avg_dep_delay, daily_avg_arr_delay, and daily_count_of_flights values into one column. Since this function requires that all values be of the same data type, we must also cast our daily count of flights metric to a double type (the same data type as the average delay metrics).

Unpivot to merge time series values
Since this dataset contains time series data in different columns, we must use an unpivot transform to merge it into one value column so the data can match the required schema for a time series sync, as shown below:
- series ID:
string| The series ID for the set of timestamp and value pairs referred to by a TSP, which must match the TSP's series ID. - timestamp:
timestamporlong| The time at which the quantity is measured. - value:
integer,float,double,string| The value of the quantity at the point that it is measured. A string type indicates a categorical time series; each categorical time series can have, at most, 10,000 unique variants.
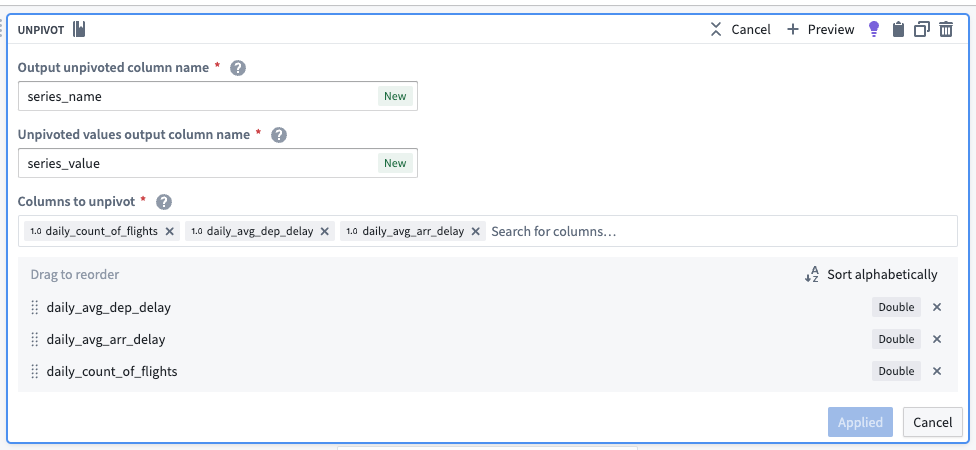
The unpivot transform shown below places values for daily_avg_dep_delay, daily_avg_arr_delay, and daily_count_of_flights into the same series_value column. Those original column names are outputs to the new series_name column that will be used in the series_id.
The dataset schema should now appear as follows:
| series_name | series_value | route_id | date |
|---|---|---|---|
| daily_avg_dep_delay | 33.4545454545450000 | ATL -> SFO | 2023-06-12T00:00:00.000Z |
| daily_avg_arr_delay | 40.0000000000000000 | ATL -> SFO | 2023-06-12T00:00:00.000Z |
| daily_count_of_flights | 11.0000000000000000 | ATL -> SFO | 2023-06-12T00:00:00.000Z |
Concatenate string values to create the series ID
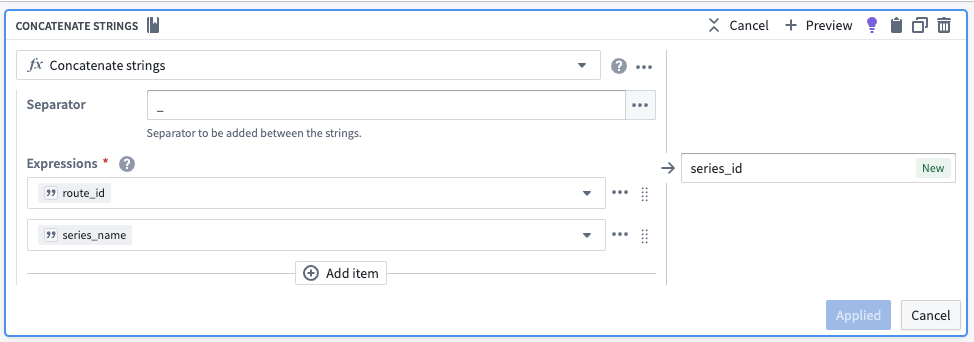
Now, we can use the concatenate strings transform to create the series ID (the identifier for the associated time series values). Use the transform to combine the series_name (what each sensor represents) with the primary key of each object.
| series_id | series_name | series_value | route_id | date |
|---|---|---|---|---|
| CMH -> IAH_daily_avg_dep_delay | daily_avg_dep_delay | 33.4545454545450000 | ATL -> SFO | 2023-06-12T00:00:00.000Z |
| CMH -> IAH_daily_avg_arr_delay | daily_avg_arr_delay | 40.0000000000000000 | ATL -> SFO | 2023-06-12T00:00:00.000Z |
| CMH -> IAH_daily_count_of_flights | daily_count_of_flights | 11.0000000000000000 | ATL -> SFO | 2023-06-12T00:00:00.000Z |
Select necessary columns
Using the select columns transform, we will only keep the columns that are required for the time series sync: series_id, series_value, and date. The flights backing dataset will hold time series values for all series, regardless of what they are measuring. Repeat this for the airline_carrier_id column (from the flights dataset).

| series_id | series_value | date |
|---|---|---|
| CMH -> IAH_daily_avg_dep_delay | 33.4545454545450000 | 2023-06-12T00:00:00.000Z |
| CMH -> IAH_daily_avg_arr_delay | 40.0000000000000000 | 2023-06-12T00:00:00.000Z |
| CMH -> IAH_daily_count_of_flights | 11.0000000000000000 | 2023-06-12T00:00:00.000Z |
2. Add a transform to aggregate and generate data for origin and destination airports
Now, you must repeat the aggregate and cast transform steps for both origin airports and destination airports.
Aggregate for the number of flights per day per route
Use the aggregate transform to group by date and origin_airport_id, then calculate the average arrival and departure times. The total number of rows in each group is equivalent to the number of flights per day per route.
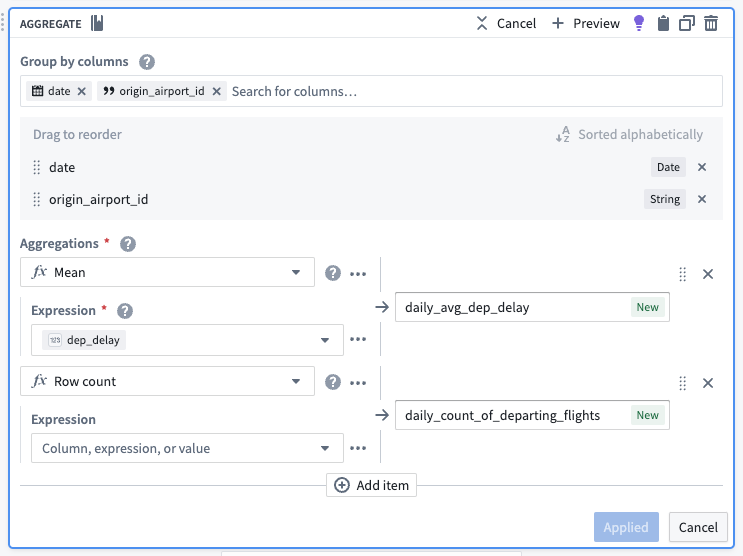
| date | origin_airport_id | daily_avg_dep_delay | daily_count_of_departing_flights |
|---|---|---|---|
| 2023-07-02 | 10299 | 9.34375000000000000 | 33 |
| 2023-09-06 | 10431 | -2.3333333333333333 | 6 |
| 2023-01-12 | 10620 | -7.0000000000000000 | 2 |
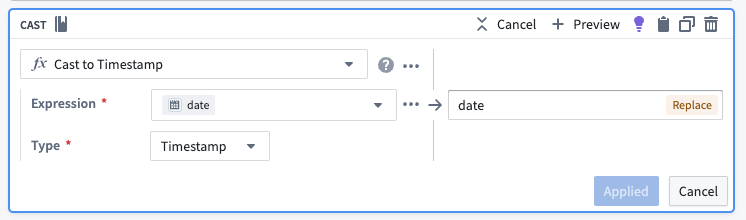
Cast to timestamp
To use this new data as a time series, we must create a timestamp column. To do this, use the cast transform to cast the date column to a timestamp type column.
3. Create a join to combine destination and origin airports
Using the join board, create a left join that combines data from the destination airport and origin airport, resulting in complete time series properties for airport data. Be sure the following configuration are set for your join:
- Match the date and
origin_airport_idto thedest_airport_id. - Auto-select columns from the left dataset.
- As the right columns, select the two that represent daily average delay and the daily count of flights.
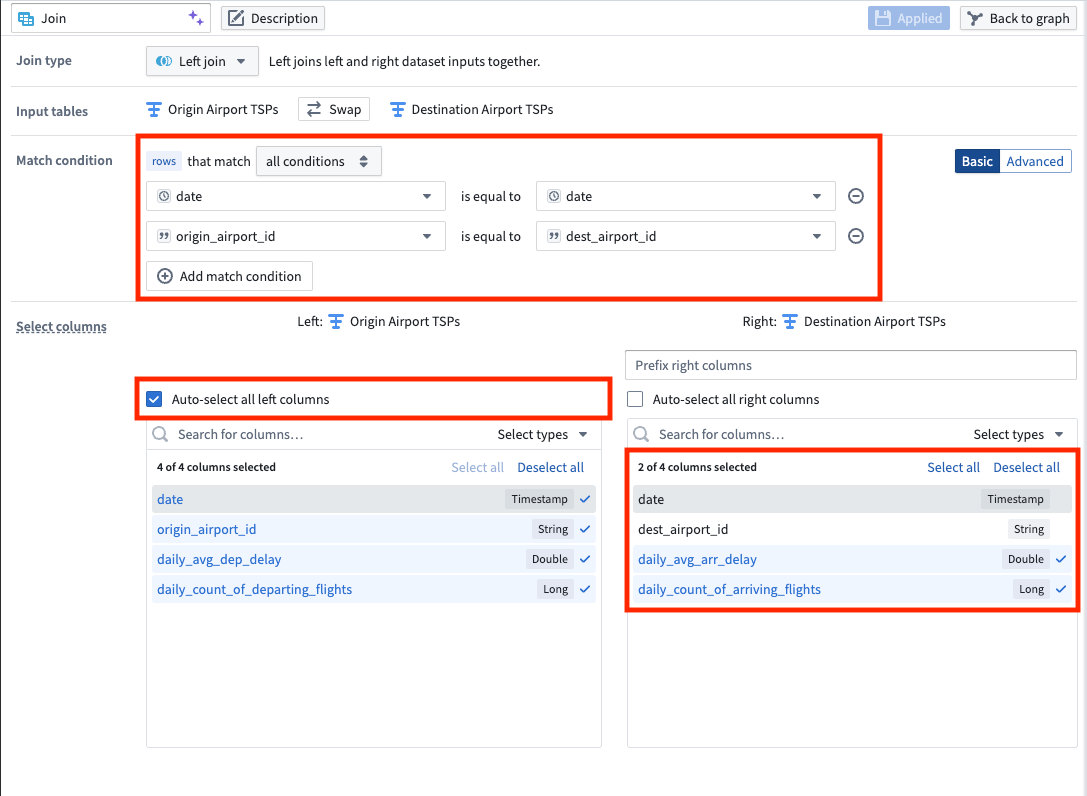
| date | origin_airport_id | daily_avg_dep_delay | daily_count_of_departing_flights | daily_avg_arr_delay | daily_count_of_arriving_flights |
|---|---|---|---|---|---|
| 2023-07-02 | 10299 | 9.34375000000000000 | 33 | 18.5294117647058840 | 34 |
| 2023-09-06 | 10431 | -2.3333333333333333 | 6 | -8.0000000000000000 | 6 |
| 2023-01-12 | 10620 | -7.0000000000000000 | 2 | 56.5000000000000000 | 2 |
4. Apply transforms to format data for a time series sync
Rename column
Now that we joined the origin airport data with the destination airport data, we have both arrival and departure metrics for all airports. We no longer need to differentiate origin from destination, so we can use the rename columns transform to change origin_airport_id to simply airport_id.
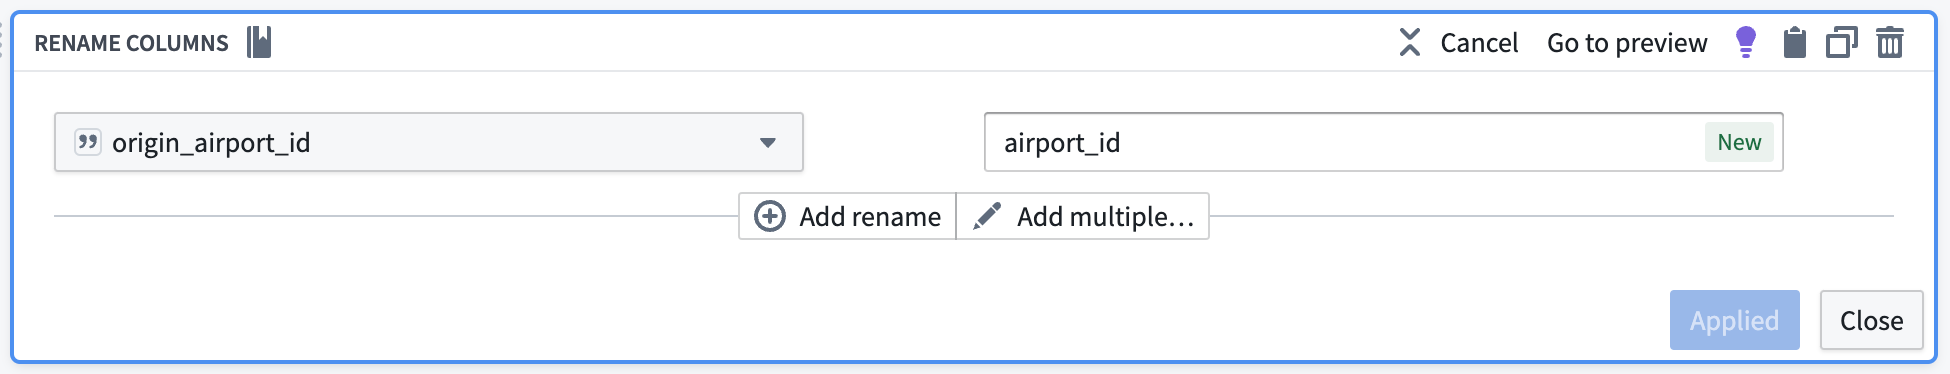
The data should preview as follows with the renamed column:
| date | airport_id | daily_avg_dep_delay | daily_count_of_departing_flights | daily_avg_arr_delay | daily_count_of_arriving_flights |
|---|---|---|---|---|---|
| 2023-07-02 | 10299 | 9.34375000000000000 | 33 | 18.5294117647058840 | 34 |
| 2023-09-06 | 10431 | -2.3333333333333333 | 6 | -8.0000000000000000 | 6 |
| 2023-01-12 | 10620 | -7.0000000000000000 | 2 | 56.5000000000000000 | 2 |
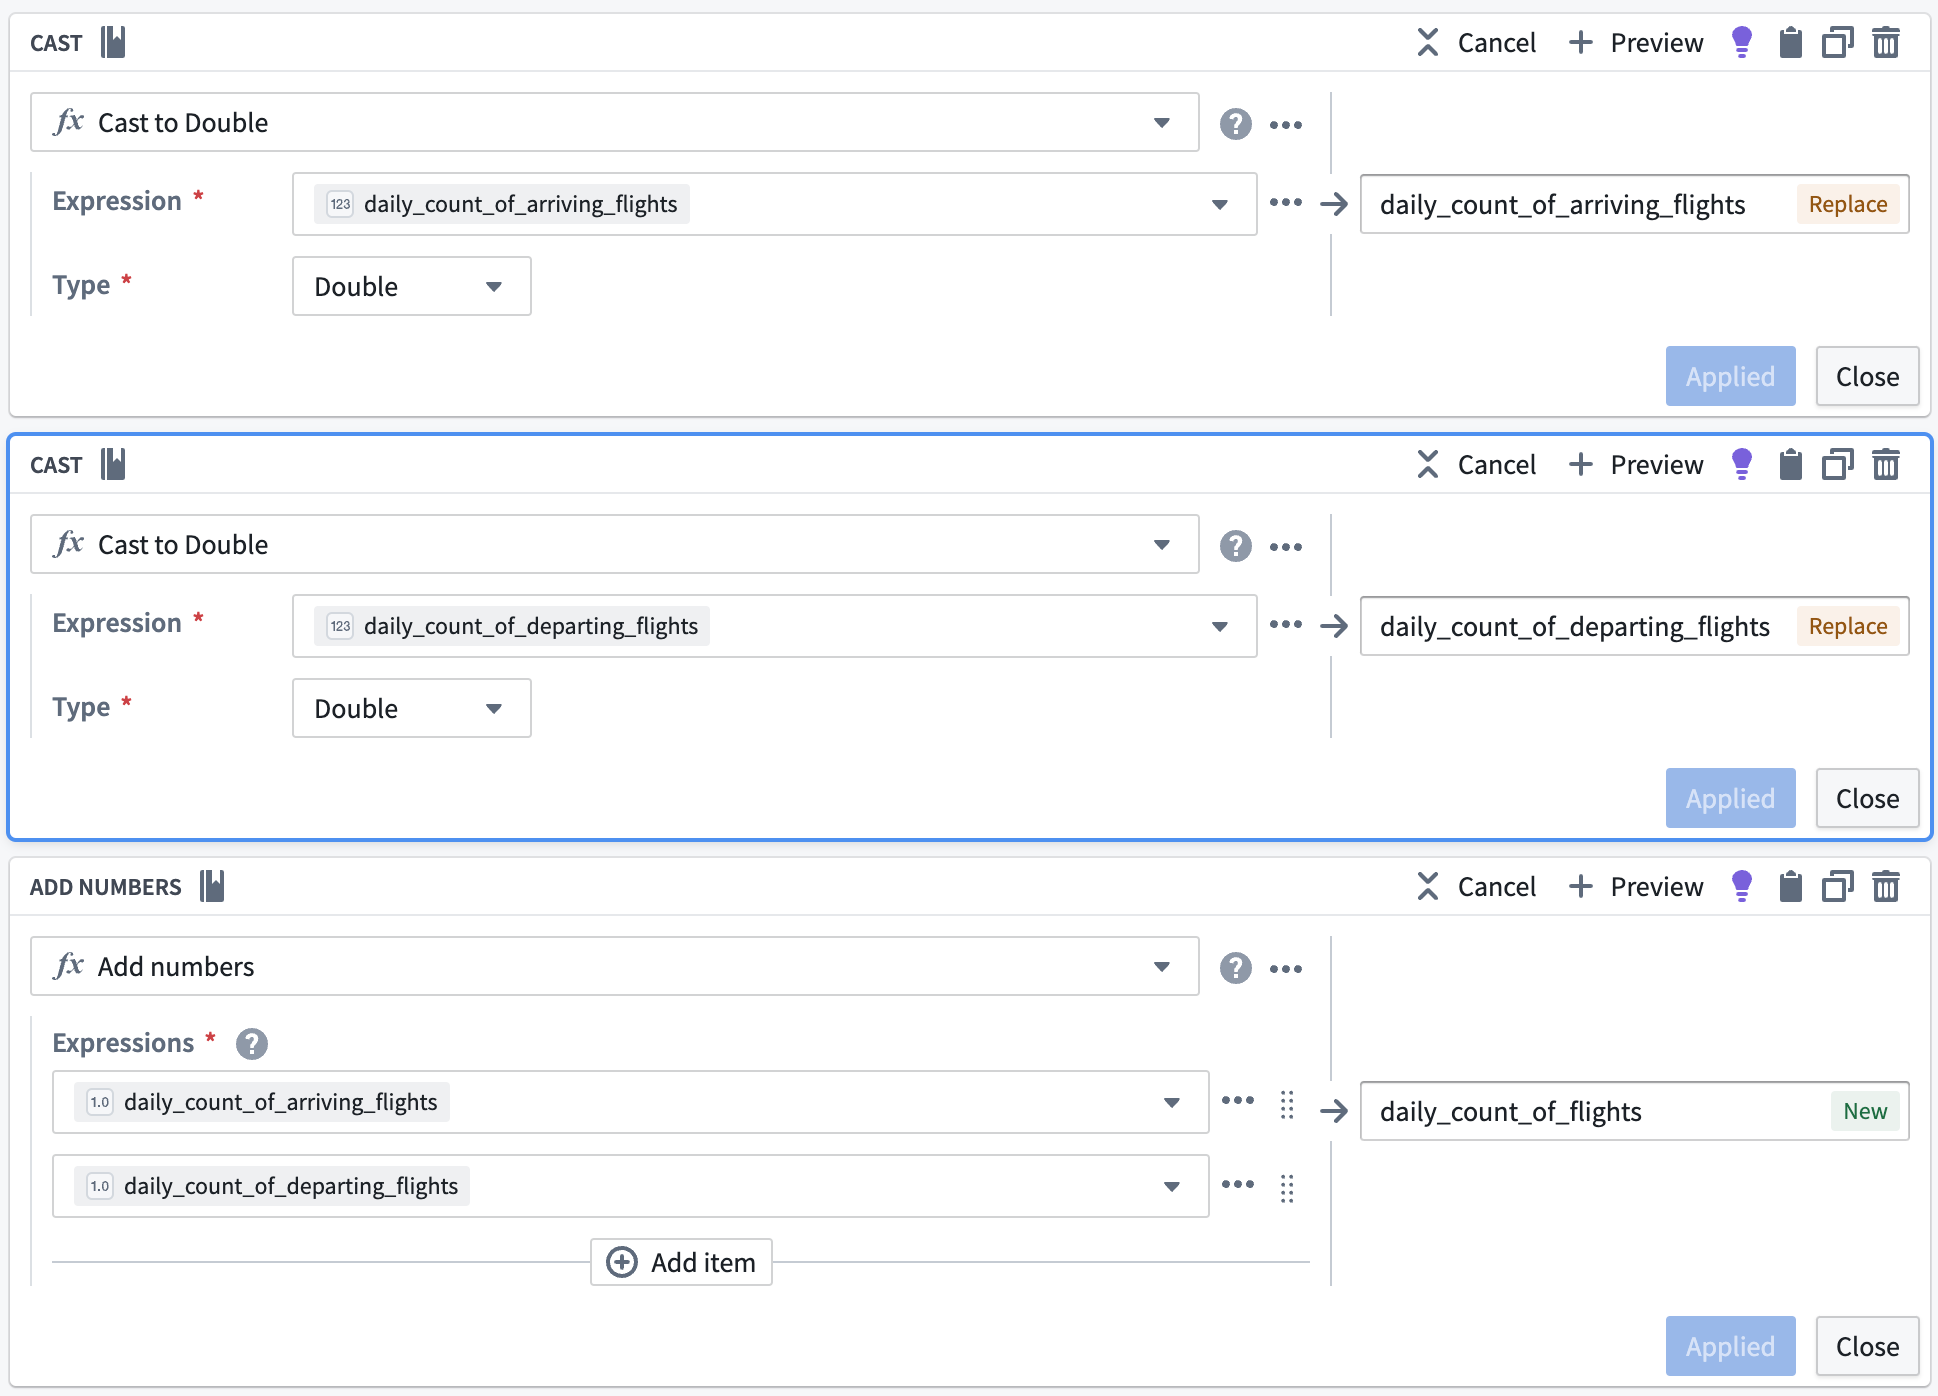
Cast to double
We will soon apply an unpivot transform. This function requires that all values be of the same data type, so we must use the cast transform board again to cast our daily count of flights metrics to a double data type so they are the same type as the average delay metrics.
Add flight numbers
To calculate the full daily flight count, we will use the add numbers transform to add together the daily count of arriving flights and the daily count of departing flights, as shown below.
| daily_count_of_flights | date | airport_id | daily_avg_dep_delay | daily_count_of_departing_flights | daily_avg_arr_delay | daily_count_of_arriving_flights |
|---|---|---|---|---|---|---|
| 77 | 2023-07-02 | 10299 | 9.34375000000000000 | 33 | 18.5294117647058840 | 34 |
| 12 | 2023-09-06 | 10431 | -2.3333333333333333 | 6 | -8.0000000000000000 | 6 |
| 4 | 2023-01-12 | 10620 | -7.0000000000000000 | 2 | 56.5000000000000000 | 2 |
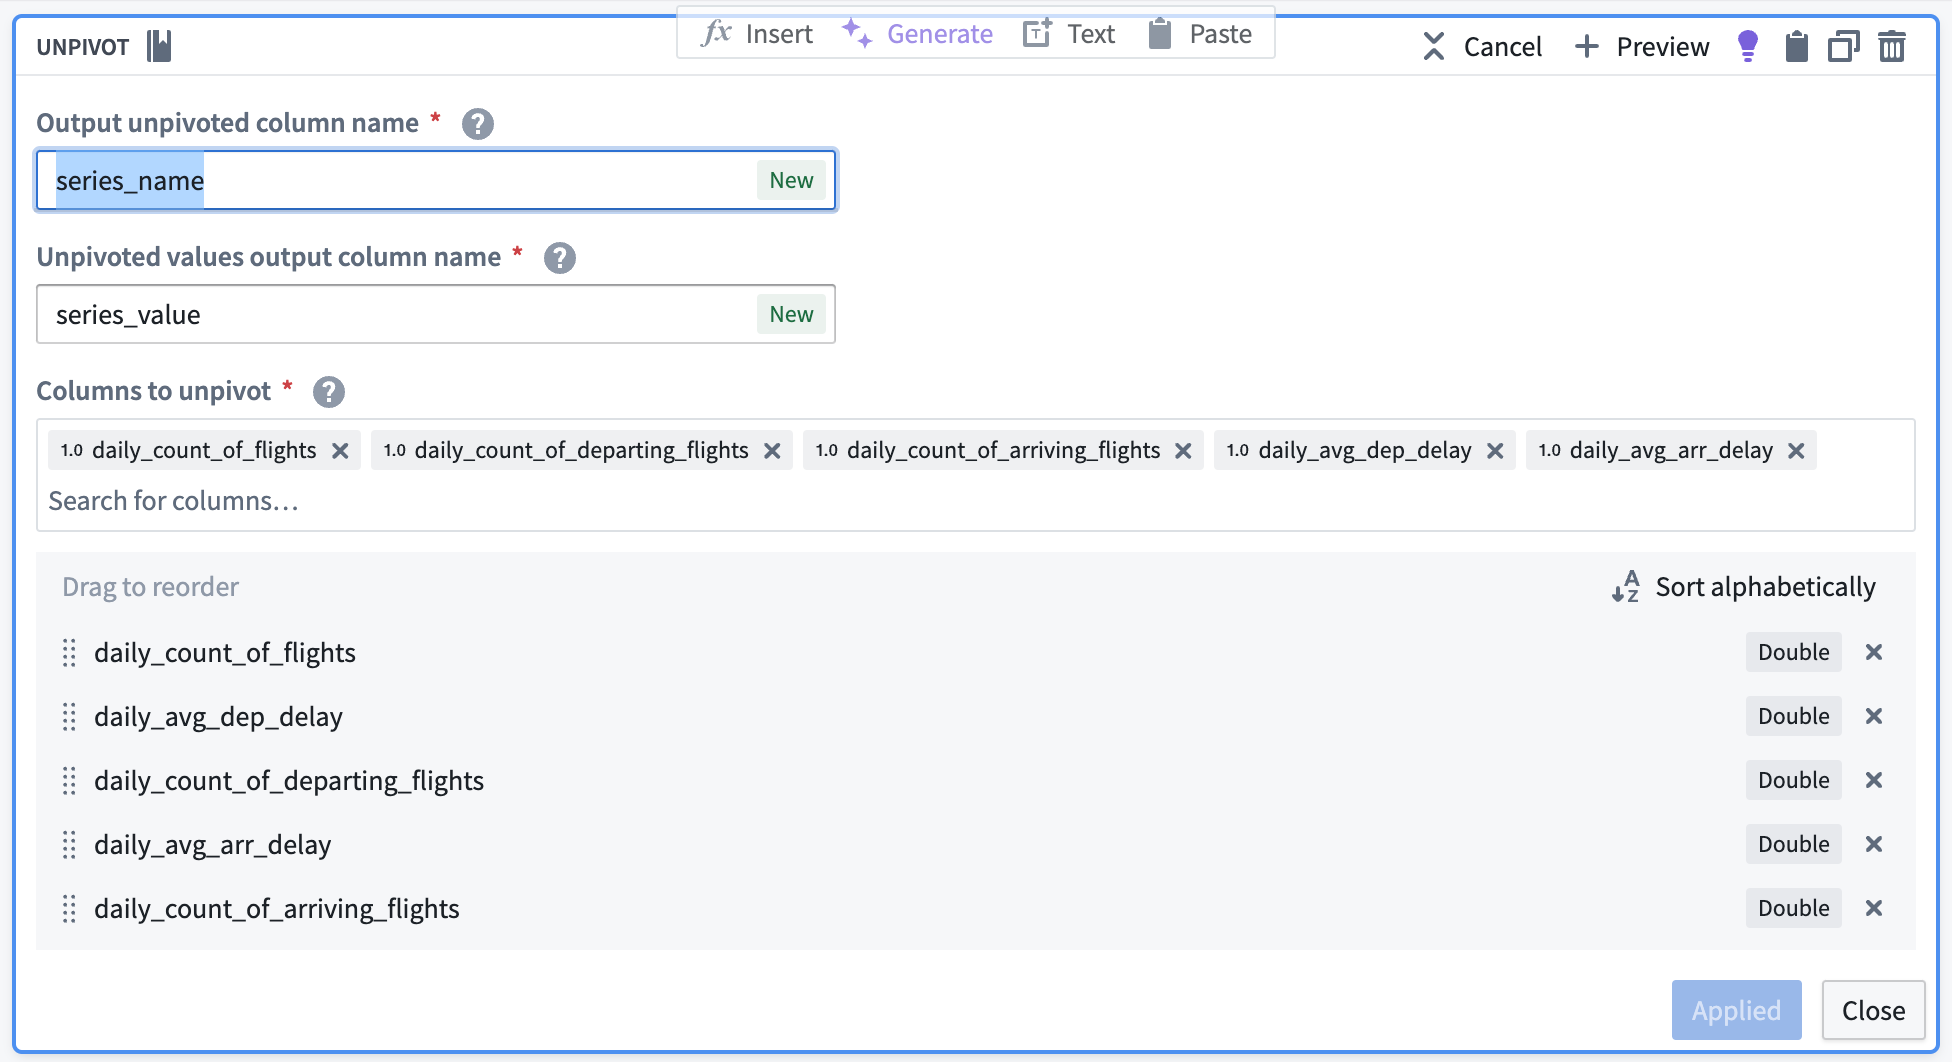
Unpivot to merge series values
Since this dataset contains time series data in different columns, we must use an unpivot transform to merge it into one value column so the data can match the required schema for a time series sync, as shown below:
- series ID:
string| The series ID for the set of timestamp and value pairs referred to by a TSP, which must match the TSP's series ID. - timestamp:
timestamporlong| The time at which the quantity is measured. - value:
integer,float,double,string| The value of the quantity at the point that it is measured. A string type indicates a categorical time series; each categorical time series can have, at most, 10,000 unique variants.
The unpivot transform shown below places values for daily_avg_dep_delay, daily_avg_arr_delay, and daily_count_of_flights into the same series_value column. Those original column names are outputs to the new series_name column that will be used in the series ID.
The data should preview with the following schema:
| series_name | series_value | date | airport_id |
|---|---|---|---|
| daily_count_of_flights | 77 | 2023-07-02T00:00:00.000Z | 10299 |
| daily_avg_dep_delay | 9.34375000000000000 | 2023-07-02T00:00:00.000Z | 10299 |
| daily_avg_arr_delay | 18.5294117647058840 | 2023-07-02T00:00:00.000Z | 10299 |
Concatenate string values to create the series ID
Now, we can use the concatenate strings transform to create the series ID (the identifier for the associated time series values). Use the transform to combine the series_name (what each sensor represents) with the primary key of the Airport object (airport_id).

| series_id | series_name | series_value | date | airport_id |
|---|---|---|---|---|
| 12099_daily_count_of_flights | daily_count_of_flights | 77 | 2023-07-02T00:00:00.000Z | 10299 |
| 12099_daily_avg_dep_delay | daily_avg_dep_delay | 9.34375000000000000 | 2023-07-02T00:00:00.000Z | 10299 |
| 12099_daily_avg_arr_delay | daily_avg_arr_delay | 18.5294117647058840 | 2023-07-02T00:00:00.000Z | 10299 |
Select necessary columns
Using the select columns transform, we will only keep the columns that are required for the time series sync: series_id, series_value, and date. The flights backing dataset will hold time series values for all series, regardless of what they are measuring.
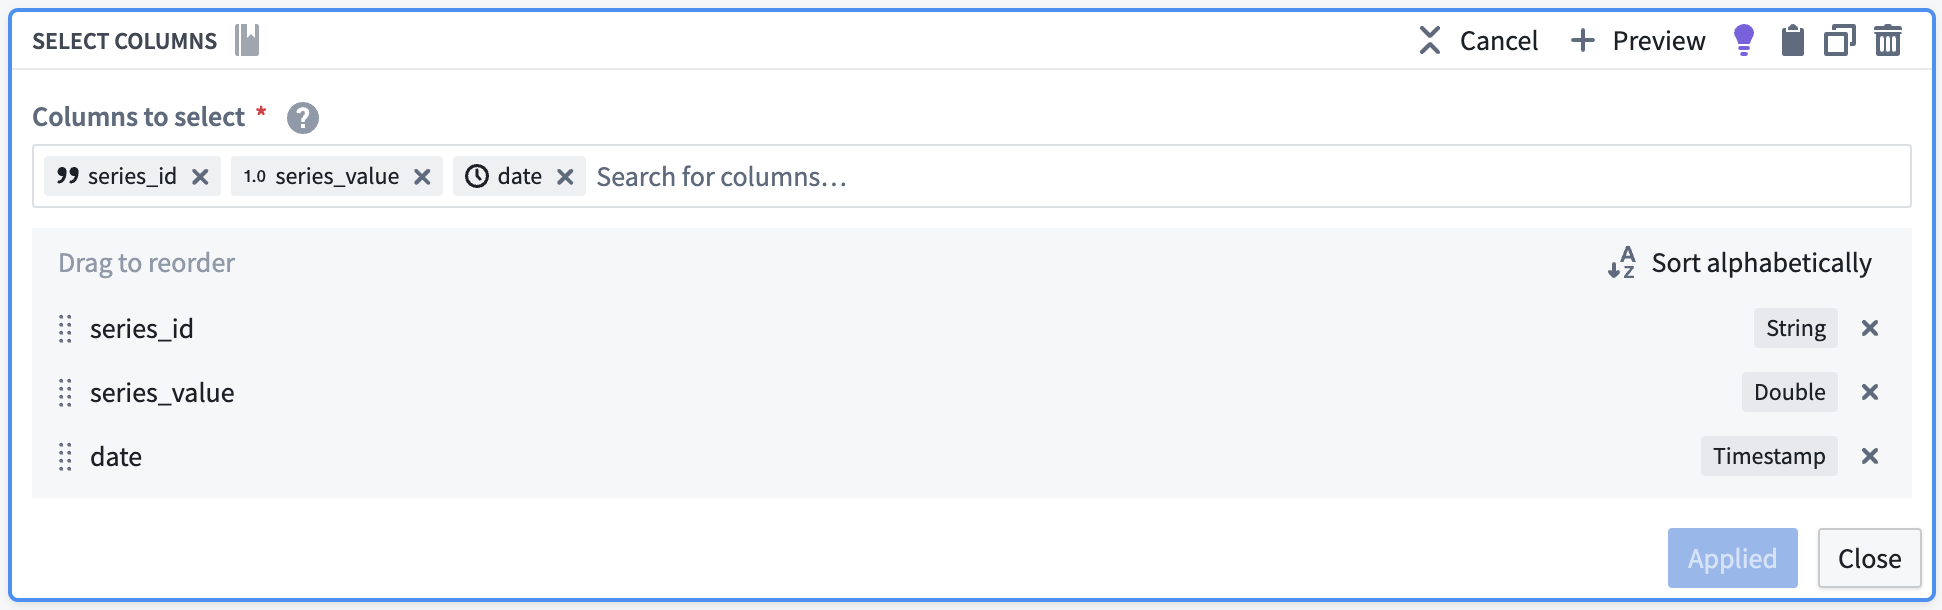
The resulting dataset should look as follows:
| series_id | series_value | date |
|---|---|---|
| 12099_daily_count_of_flights | 77 | 2023-07-02T00:00:00.000Z |
| 12099_daily_avg_dep_delay | 9.34375000000000000 | 2023-07-02T00:00:00.000Z |
| 12099_daily_avg_arr_delay | 18.5294117647058840 | 2023-07-02T00:00:00.000Z |
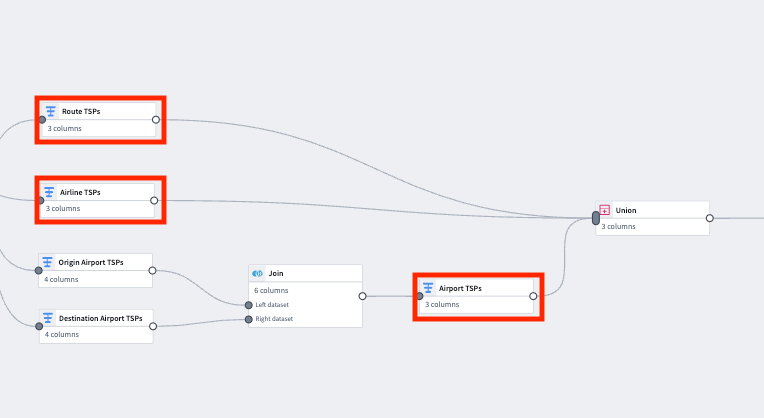
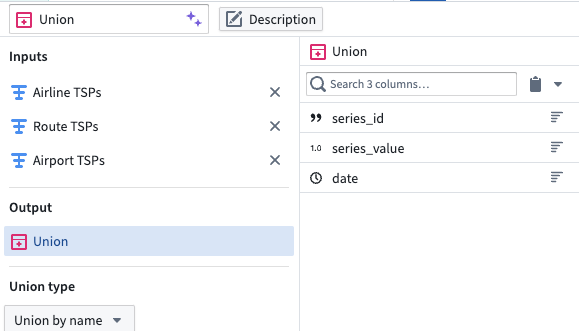
5. Union the time series properties into a backing dataset
Create a union with the type Union by name, using the transforms representing the Carrier, Route, and Airport time series properties.
| series_id | series_value | date |
|---|---|---|
| 12099_daily_count_of_flights | 77 | 2023-07-02T00:00:00.000Z |
| 12099_daily_avg_dep_delay | 9.34375000000000000 | 2023-07-02T00:00:00.000Z |
| 12099_daily_avg_arr_delay | 18.5294117647058840 | 2023-07-02T00:00:00.000Z |
| CMH -> IAH_daily_avg_dep_delay | -8.0000000000000000 | 2023-03-21T00:00:00.000Z |
| 20304_daily_avg_arr_delay | 9.12500000000000000 | 2023-08-13T00:00:00.000Z |
Part II: Create the time series sync
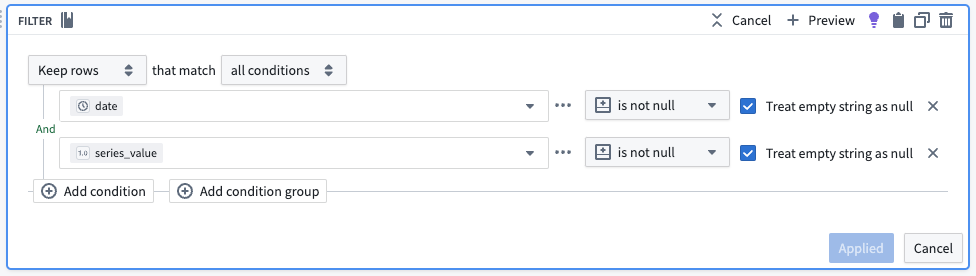
1. Remove null values
Apply a filter transform on the resulting dataset to remove any null values.
2. Configure the time series sync
Now, create a time series sync by selecting Add from the pipeline output section to the right of the screen. Then, select Time series sync. Fill out the necessary data for the new time series sync, with the following considerations:
- The title “[Example] Time series sync | Events” will correspond to the resulting resource in your Palantir filesystem folder.
- Select the
series_idcolumn for the Series ID field. - Add the created
datetimestamp column in the Time field. - Add
series_valueto the Value field.
Now, save and build the pipeline. The output will be created in the same folder as the pipeline.
3. Use a time series sync to add properties to object types
Now that you created a pipeline with a time series sync, you are ready to use the sync to add time series properties to the Route, Carrier and Airport object types. Move on to our documentation for adding time series properties to object types for more guidance.
中文翻译
使用 Pipeline Builder 创建时间序列数据
按照本指南创建的管道将生成时间序列数据,该数据用于支持时间序列同步,并与 Carrier、Route 和 Airport 对象类型上的时间序列属性关联,以创建新的时间序列对象。与从时间序列数据集到时间序列属性的标准映射相比,此管道涉及更复杂的设置,因为我们将对非时间序列数据进行计算以生成时间序列数据。有关通用管道指导,请查阅我们的 Pipeline Builder 文档。
我们使用的航班数据集包含以下列,我们将利用这些列创建时间序列属性:
- flight_id:
string| 用于标识航班及数据集中每一行的唯一字符串。 - date:
date| 航班起飞日期。 - destination_airport_id:
string| 用于标识目的地机场的字符串。 - airline_id:
string| 航空承运商的 ID。 - origin_airport_id:
string| 出发地机场的 ID。 - dep_delay:
integer| 起飞延误的分钟数。 - arr_delay:
integer| 到达延误的分钟数。 - route_id:
string| 用于标识航线的唯一字符串。
本指南末尾的管道将如下所示:
第一部分:生成时间序列数据
使用与支持 Flights 对象类型相同的航班数据集,我们可以执行一些聚合转换,并根据航班指标生成时间序列数据。请注意,如果您已有来自历史记录系统或边缘传感器的时间序列数据进入 Foundry,则无需执行此步骤。您可以继续生成时间序列同步。
1. 对 Carrier 和 Route 对象类型应用转换
根据航班数据集,使用以下步骤应用转换。您需要对 Carrier 和 Route 对象类型分别执行此操作。
聚合数据
使用聚合转换按日期和对象 ID 分组(在本例中,对 Route 对象类型使用 route_id;您需要单独对 Carrier 对象类型使用 airline_id 执行相同操作),并计算平均到达延误、平均起飞延误以及每日航班数量。
聚合后,数据集预览应具有以下模式:
| route_id | date | daily_avg_dep_delay | daily_avg_arr_delay | daily_count_of_flights |
|---|---|---|---|---|
| ATL -> SFO | 2023-06-12 | 33.4545454545450000 | 40.0000000000000000 | 11 |
| ATL -> FLL | 2023-08-24 | 29.7272727272720000 | 19.4090909090909100 | 22 |
| ATL -> TVC | 2023-07-05 | -8.0000000000000000 | -8.0000000000000000 | 1 |
转换为新数据类型
要使用此新数据作为时间序列,我们必须创建一个时间戳类型列。为此,请使用转换转换将 date 列转换为时间戳类型列。我们还将很快应用逆透视转换,将 daily_avg_dep_delay、daily_avg_arr_delay 和 daily_count_of_flights 的值合并到一列中。由于此函数要求所有值具有相同的数据类型,我们还必须将每日航班计数指标转换为双精度类型(与平均延误指标相同的数据类型)。
逆透视以合并时间序列值
由于此数据集在不同列中包含时间序列数据,我们必须使用逆透视转换将其合并到一个值列中,以便数据能够匹配时间序列同步所需的模式,如下所示:
- 系列 ID (series ID):
string| 由 TSP 引用的一组时间戳和值对的系列 ID,必须与 TSP 的系列 ID 匹配。 - 时间戳 (timestamp):
timestamp或long| 测量数量的时间点。 - 值 (value):
integer、float、double、string| 在测量点测量的数量值。字符串类型表示分类时间序列;每个分类时间序列最多可以有 10,000 个唯一变体。
下面显示的逆透视转换将 daily_avg_dep_delay、daily_avg_arr_delay 和 daily_count_of_flights 的值放入同一个 series_value 列中。这些原始列名将输出到新的 series_name 列,该列将用于 series_id。
数据集模式现在应如下所示:
| series_name | series_value | route_id | date |
|---|---|---|---|
| daily_avg_dep_delay | 33.4545454545450000 | ATL -> SFO | 2023-06-12T00:00:00.000Z |
| daily_avg_arr_delay | 40.0000000000000000 | ATL -> SFO | 2023-06-12T00:00:00.000Z |
| daily_count_of_flights | 11.0000000000000000 | ATL -> SFO | 2023-06-12T00:00:00.000Z |
连接字符串值以创建系列 ID
现在,我们可以使用连接字符串转换来创建系列 ID(关联时间序列值的标识符)。使用该转换将 series_name(每个传感器代表的内容)与每个对象的主键组合起来。
| series_id | series_name | series_value | route_id | date |
|---|---|---|---|---|
| CMH -> IAH_daily_avg_dep_delay | daily_avg_dep_delay | 33.4545454545450000 | ATL -> SFO | 2023-06-12T00:00:00.000Z |
| CMH -> IAH_daily_avg_arr_delay | daily_avg_arr_delay | 40.0000000000000000 | ATL -> SFO | 2023-06-12T00:00:00.000Z |
| CMH -> IAH_daily_count_of_flights | daily_count_of_flights | 11.0000000000000000 | ATL -> SFO | 2023-06-12T00:00:00.000Z |
选择必要的列
使用选择列转换,我们将只保留时间序列同步所需的列:series_id、series_value 和 date。航班支持数据集将保存所有系列的时间序列值,无论它们测量的是什么。对 airline_carrier_id 列(来自航班数据集)重复此操作。
| series_id | series_value | date |
|---|---|---|
| CMH -> IAH_daily_avg_dep_delay | 33.4545454545450000 | 2023-06-12T00:00:00.000Z |
| CMH -> IAH_daily_avg_arr_delay | 40.0000000000000000 | 2023-06-12T00:00:00.000Z |
| CMH -> IAH_daily_count_of_flights | 11.0000000000000000 | 2023-06-12T00:00:00.000Z |
2. 添加转换以聚合和生成出发地和目的地机场的数据
现在,您必须对出发地机场和目的地机场重复聚合和转换转换步骤。
聚合每日每条航线的航班数量
使用聚合转换按 date 和 origin_airport_id 分组,然后计算平均到达和起飞时间。每组中的总行数等于每日每条航线的航班数量。
| date | origin_airport_id | daily_avg_dep_delay | daily_count_of_departing_flights |
|---|---|---|---|
| 2023-07-02 | 10299 | 9.34375000000000000 | 33 |
| 2023-09-06 | 10431 | -2.3333333333333333 | 6 |
| 2023-01-12 | 10620 | -7.0000000000000000 | 2 |
转换为时间戳
要使用此新数据作为时间序列,我们必须创建一个时间戳列。为此,请使用转换转换将 date 列转换为时间戳类型列。
3. 创建连接以合并目的地和出发地机场
使用连接面板,创建一个左连接,合并来自目的地机场和出发地机场的数据,从而为机场数据生成完整的时间序列属性。确保为连接设置以下配置:
- 将日期和
origin_airport_id与dest_airport_id匹配。 - 自动选择左侧数据集中的列。
- 作为右侧列,选择代表每日平均延误和每日航班数量的两列。
| date | origin_airport_id | daily_avg_dep_delay | daily_count_of_departing_flights | daily_avg_arr_delay | daily_count_of_arriving_flights |
|---|---|---|---|---|---|
| 2023-07-02 | 10299 | 9.34375000000000000 | 33 | 18.5294117647058840 | 34 |
| 2023-09-06 | 10431 | -2.3333333333333333 | 6 | -8.0000000000000000 | 6 |
| 2023-01-12 | 10620 | -7.0000000000000000 | 2 | 56.5000000000000000 | 2 |
4. 应用转换以格式化时间序列同步的数据
重命名列
现在我们已经将出发地机场数据与目的地机场数据连接起来,我们拥有了所有机场的到达和起飞指标。我们不再需要区分出发地和目的地,因此我们可以使用重命名列转换将 origin_airport_id 更改为简单的 airport_id。
重命名列后,数据预览应如下所示:
| date | airport_id | daily_avg_dep_delay | daily_count_of_departing_flights | daily_avg_arr_delay | daily_count_of_arriving_flights |
|---|---|---|---|---|---|
| 2023-07-02 | 10299 | 9.34375000000000000 | 33 | 18.5294117647058840 | 34 |
| 2023-09-06 | 10431 | -2.3333333333333333 | 6 | -8.0000000000000000 | 6 |
| 2023-01-12 | 10620 | -7.0000000000000000 | 2 | 56.5000000000000000 | 2 |
转换为双精度
我们很快将应用逆透视转换。此函数要求所有值具有相同的数据类型,因此我们必须再次使用转换转换面板,将每日航班计数指标转换为双精度数据类型,使其与平均延误指标的类型相同。
添加航班数量
为了计算完整的每日航班数量,我们将使用添加数字转换,将每日到达航班数量和每日起飞航班数量相加,如下所示。
| daily_count_of_flights | date | airport_id | daily_avg_dep_delay | daily_count_of_departing_flights | daily_avg_arr_delay | daily_count_of_arriving_flights |
|---|---|---|---|---|---|---|
| 77 | 2023-07-02 | 10299 | 9.34375000000000000 | 33 | 18.5294117647058840 | 34 |
| 12 | 2023-09-06 | 10431 | -2.3333333333333333 | 6 | -8.0000000000000000 | 6 |
| 4 | 2023-01-12 | 10620 | -7.0000000000000000 | 2 | 56.5000000000000000 | 2 |
逆透视以合并系列值
由于此数据集在不同列中包含时间序列数据,我们必须使用逆透视转换将其合并到一个值列中,以便数据能够匹配时间序列同步所需的模式,如下所示:
- 系列 ID (series ID):
string| 由 TSP 引用的一组时间戳和值对的系列 ID,必须与 TSP 的系列 ID 匹配。 - 时间戳 (timestamp):
timestamp或long| 测量数量的时间点。 - 值 (value):
integer、float、double、string| 在测量点测量的数量值。字符串类型表示分类时间序列;每个分类时间序列最多可以有 10,000 个唯一变体。
下面显示的逆透视转换将 daily_avg_dep_delay、daily_avg_arr_delay 和 daily_count_of_flights 的值放入同一个 series_value 列中。这些原始列名将输出到新的 series_name 列,该列将用于系列 ID。
数据预览应具有以下模式:
| series_name | series_value | date | airport_id |
|---|---|---|---|
| daily_count_of_flights | 77 | 2023-07-02T00:00:00.000Z | 10299 |
| daily_avg_dep_delay | 9.34375000000000000 | 2023-07-02T00:00:00.000Z | 10299 |
| daily_avg_arr_delay | 18.5294117647058840 | 2023-07-02T00:00:00.000Z | 10299 |
连接字符串值以创建系列 ID
现在,我们可以使用连接字符串转换来创建系列 ID(关联时间序列值的标识符)。使用该转换将 series_name(每个传感器代表的内容)与 Airport 对象的主键(airport_id)组合起来。
| series_id | series_name | series_value | date | airport_id |
|---|---|---|---|---|
| 12099_daily_count_of_flights | daily_count_of_flights | 77 | 2023-07-02T00:00:00.000Z | 10299 |
| 12099_daily_avg_dep_delay | daily_avg_dep_delay | 9.34375000000000000 | 2023-07-02T00:00:00.000Z | 10299 |
| 12099_daily_avg_arr_delay | daily_avg_arr_delay | 18.5294117647058840 | 2023-07-02T00:00:00.000Z | 10299 |
选择必要的列
使用选择列转换,我们将只保留时间序列同步所需的列:series_id、series_value 和 date。航班支持数据集将保存所有系列的时间序列值,无论它们测量的是什么。
生成的数据集应如下所示:
| series_id | series_value | date |
|---|---|---|
| 12099_daily_count_of_flights | 77 | 2023-07-02T00:00:00.000Z |
| 12099_daily_avg_dep_delay | 9.34375000000000000 | 2023-07-02T00:00:00.000Z |
| 12099_daily_avg_arr_delay | 18.5294117647058840 | 2023-07-02T00:00:00.000Z |
5. 将时间序列属性合并到支持数据集中
使用类型为 按名称合并 (Union by name) 的合并,使用代表 Carrier、Route 和 Airport 时间序列属性的转换。
| series_id | series_value | date |
|---|---|---|
| 12099_daily_count_of_flights | 77 | 2023-07-02T00:00:00.000Z |
| 12099_daily_avg_dep_delay | 9.34375000000000000 | 2023-07-02T00:00:00.000Z |
| 12099_daily_avg_arr_delay | 18.5294117647058840 | 2023-07-02T00:00:00.000Z |
| CMH -> IAH_daily_avg_dep_delay | -8.0000000000000000 | 2023-03-21T00:00:00.000Z |
| 20304_daily_avg_arr_delay | 9.12500000000000000 | 2023-08-13T00:00:00.000Z |
第二部分:创建时间序列同步
1. 移除空值
对生成的数据集应用过滤转换,以移除任何 null 值。
2. 配置时间序列同步
现在,通过从屏幕右侧的管道输出部分选择 添加 (Add),然后选择 时间序列同步 (Time series sync),创建一个时间序列同步。为新的时间序列同步填写必要的数据,并注意以下事项:
- 标题 "[示例] 时间序列同步 | 事件" 将对应于 Palantir 文件系统文件夹中的结果资源。
- 为 系列 ID (Series ID) 字段选择
series_id列。 - 在 时间 (Time) 字段中添加创建的
date时间戳列。 - 将
series_value添加到 值 (Value) 字段。
现在,保存并构建管道。输出将在与管道相同的文件夹中创建。
3. 使用时间序列同步向对象类型添加属性
现在您已经创建了包含时间序列同步的管道,可以准备使用该同步向 Route、Carrier 和 Airport 对象类型添加时间序列属性了。请继续查阅我们关于向对象类型添加时间序列属性的文档以获取更多指导。