Use time series in Foundry(在 Foundry 中使用时间序列)
Once your time series setup is complete, use time series object types to create visualizations and analyses in the Foundry applications listed below.
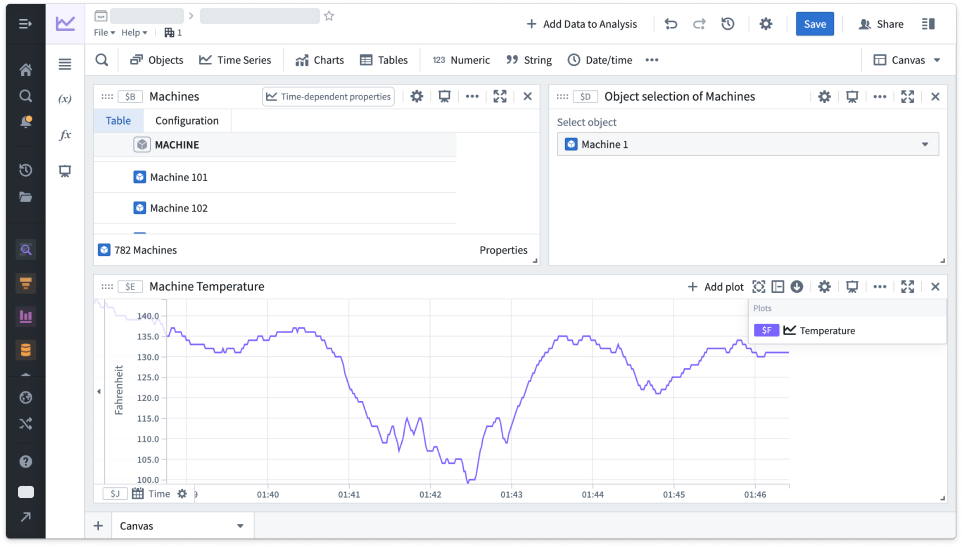
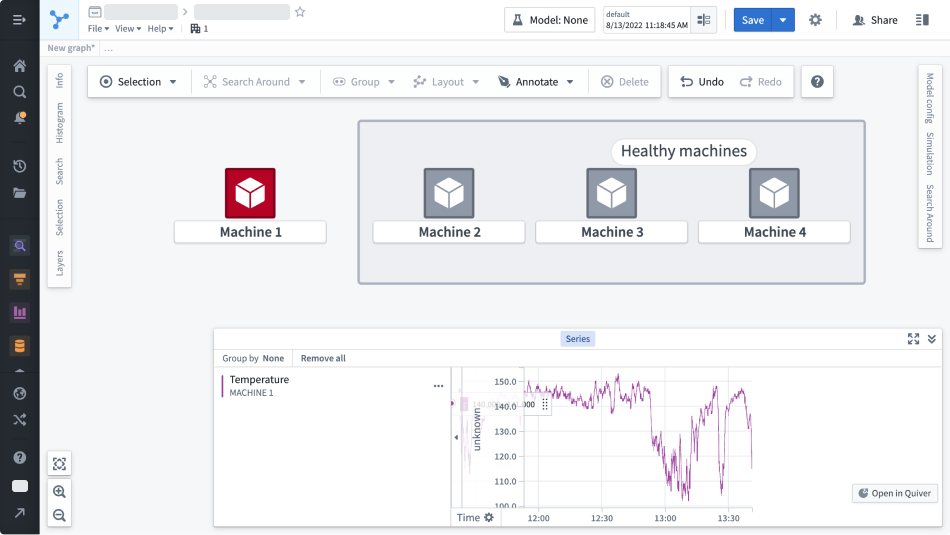
Quiver: Create interactive time series dashboards and analyses. The example below shows an analysis of machine temperature readings over time.
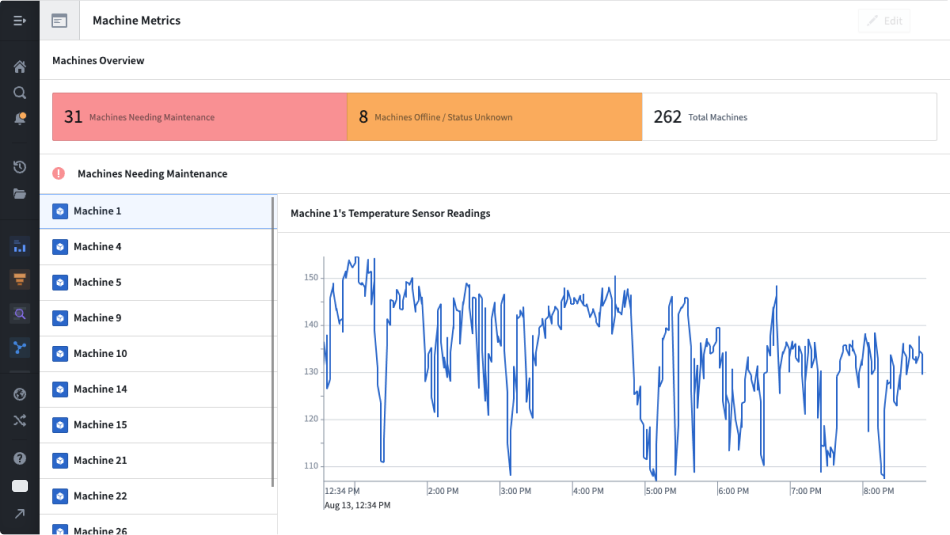
Workshop: Build high-quality, interactive applications with time series maps, charts, and metric cards.
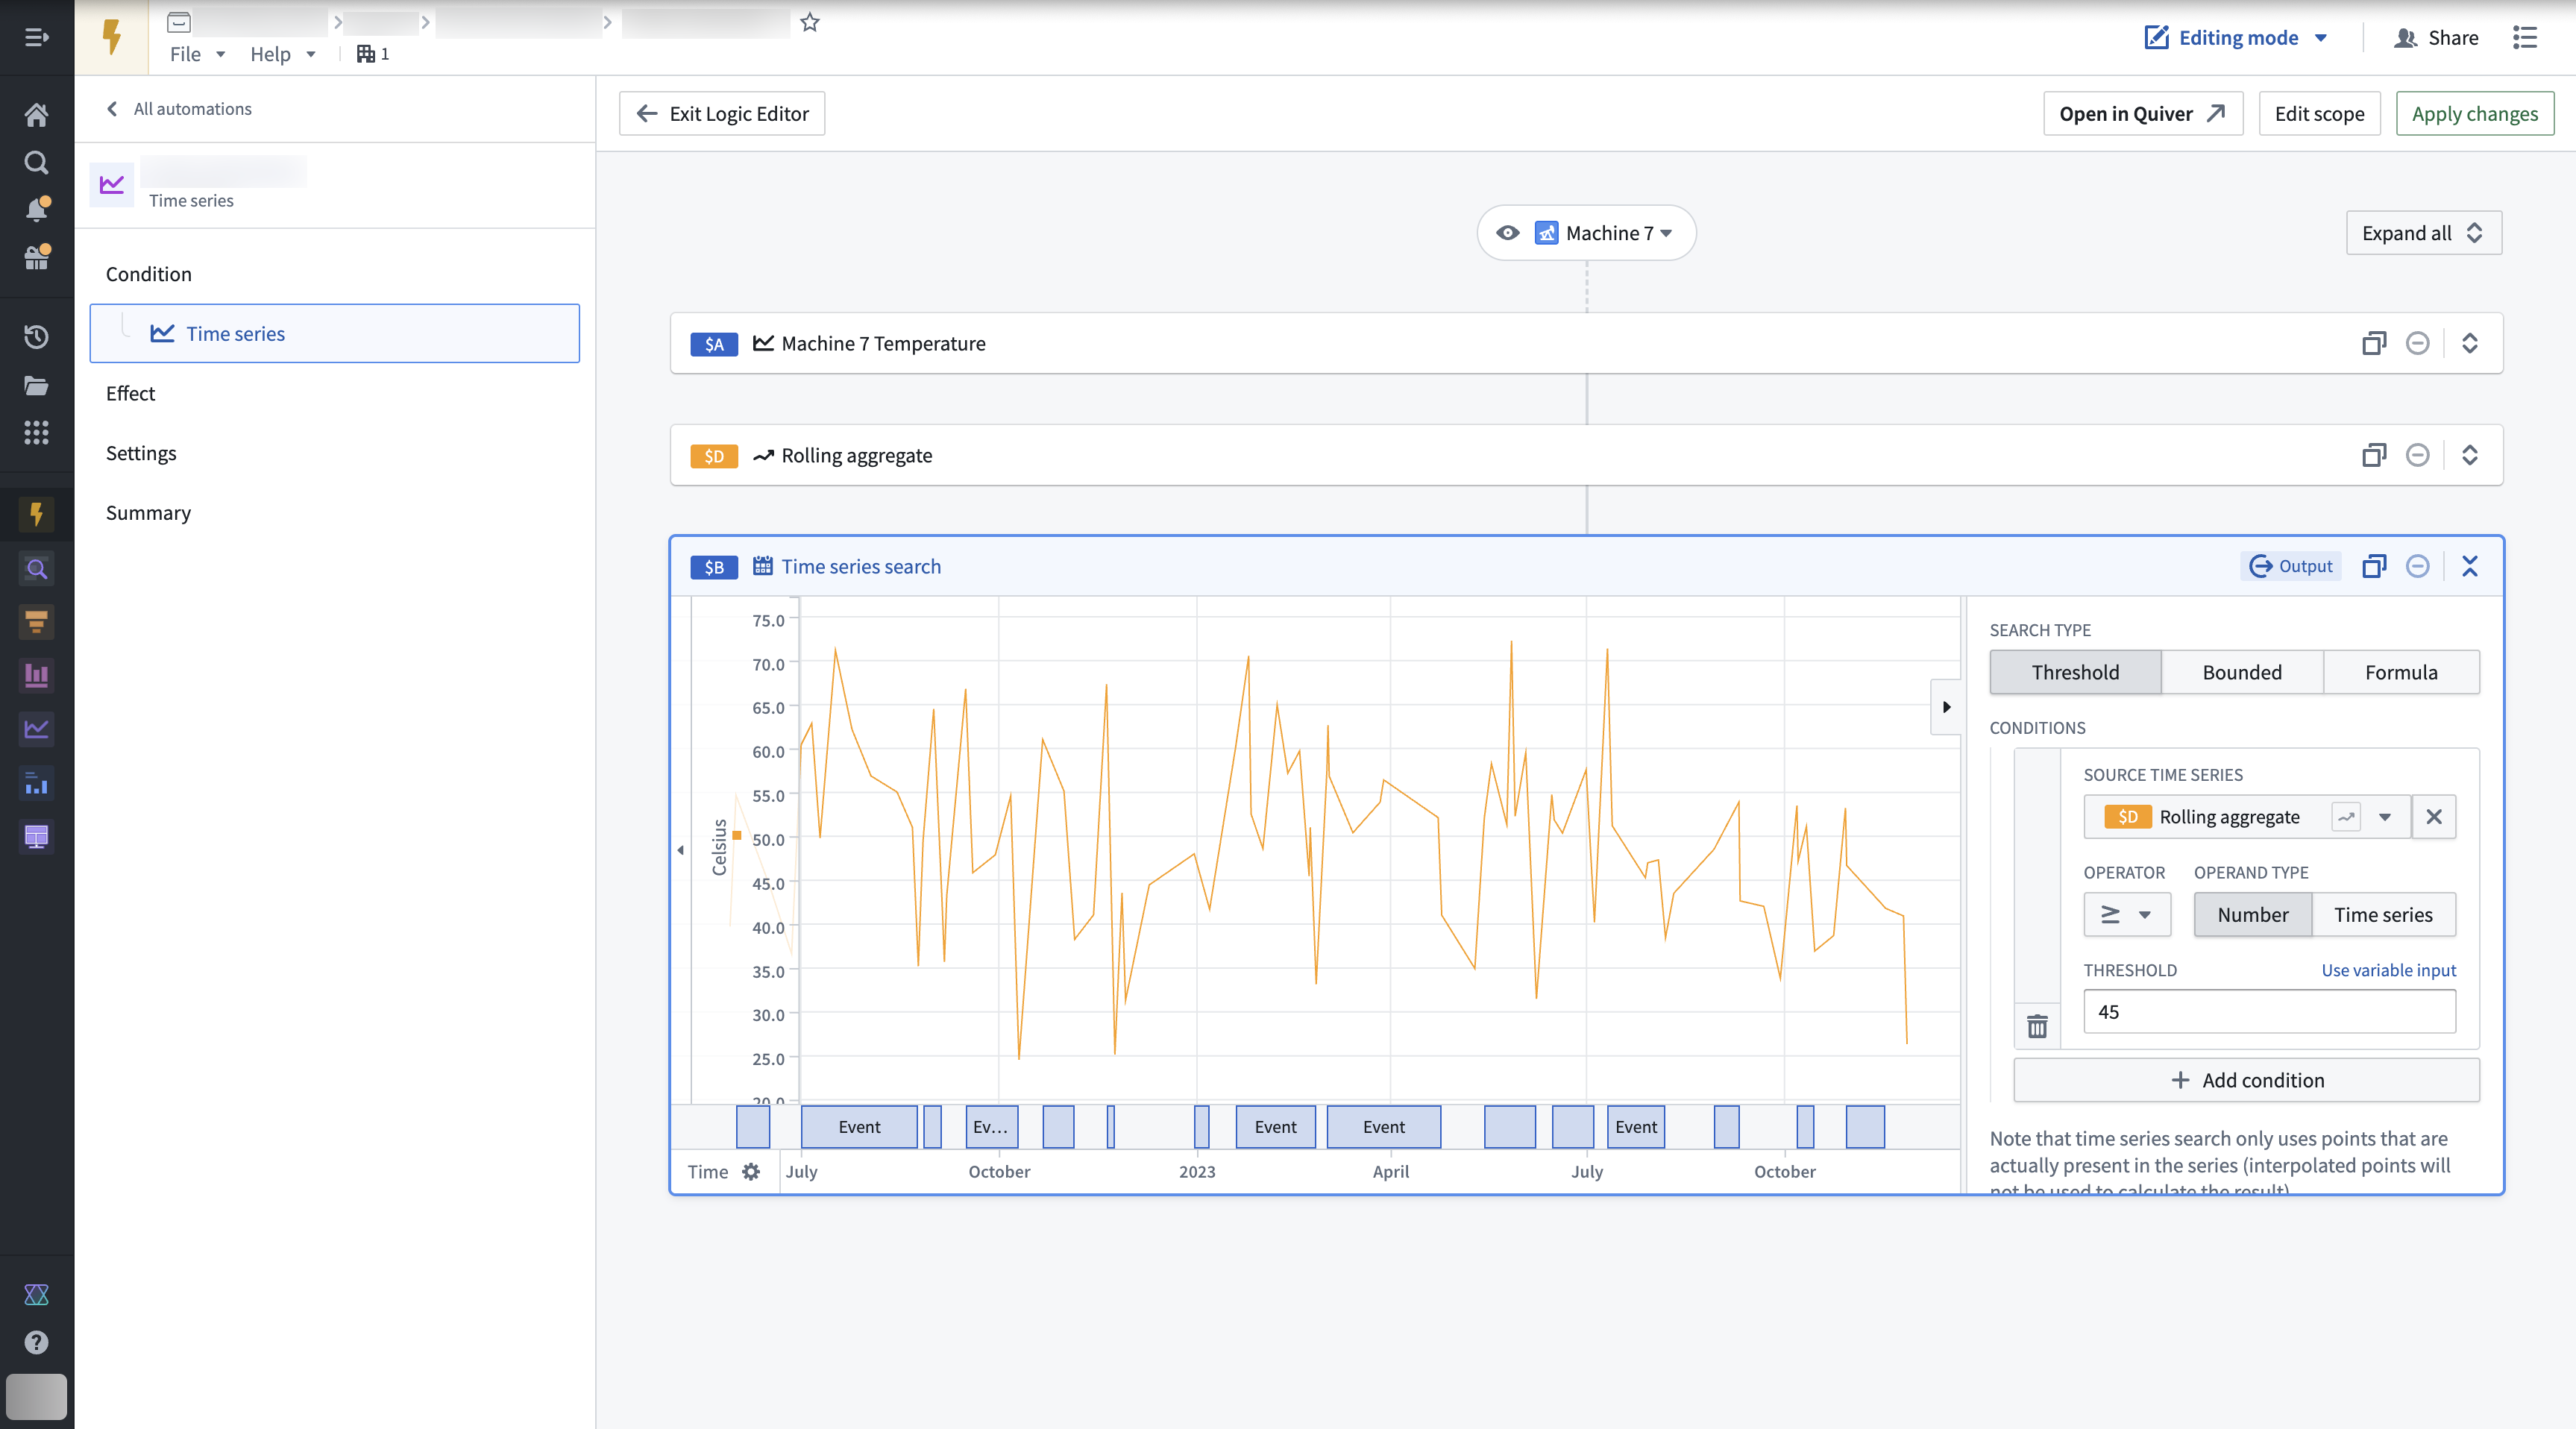
Automate: Create automations that generate alerts when time series data meets user-specified criteria.
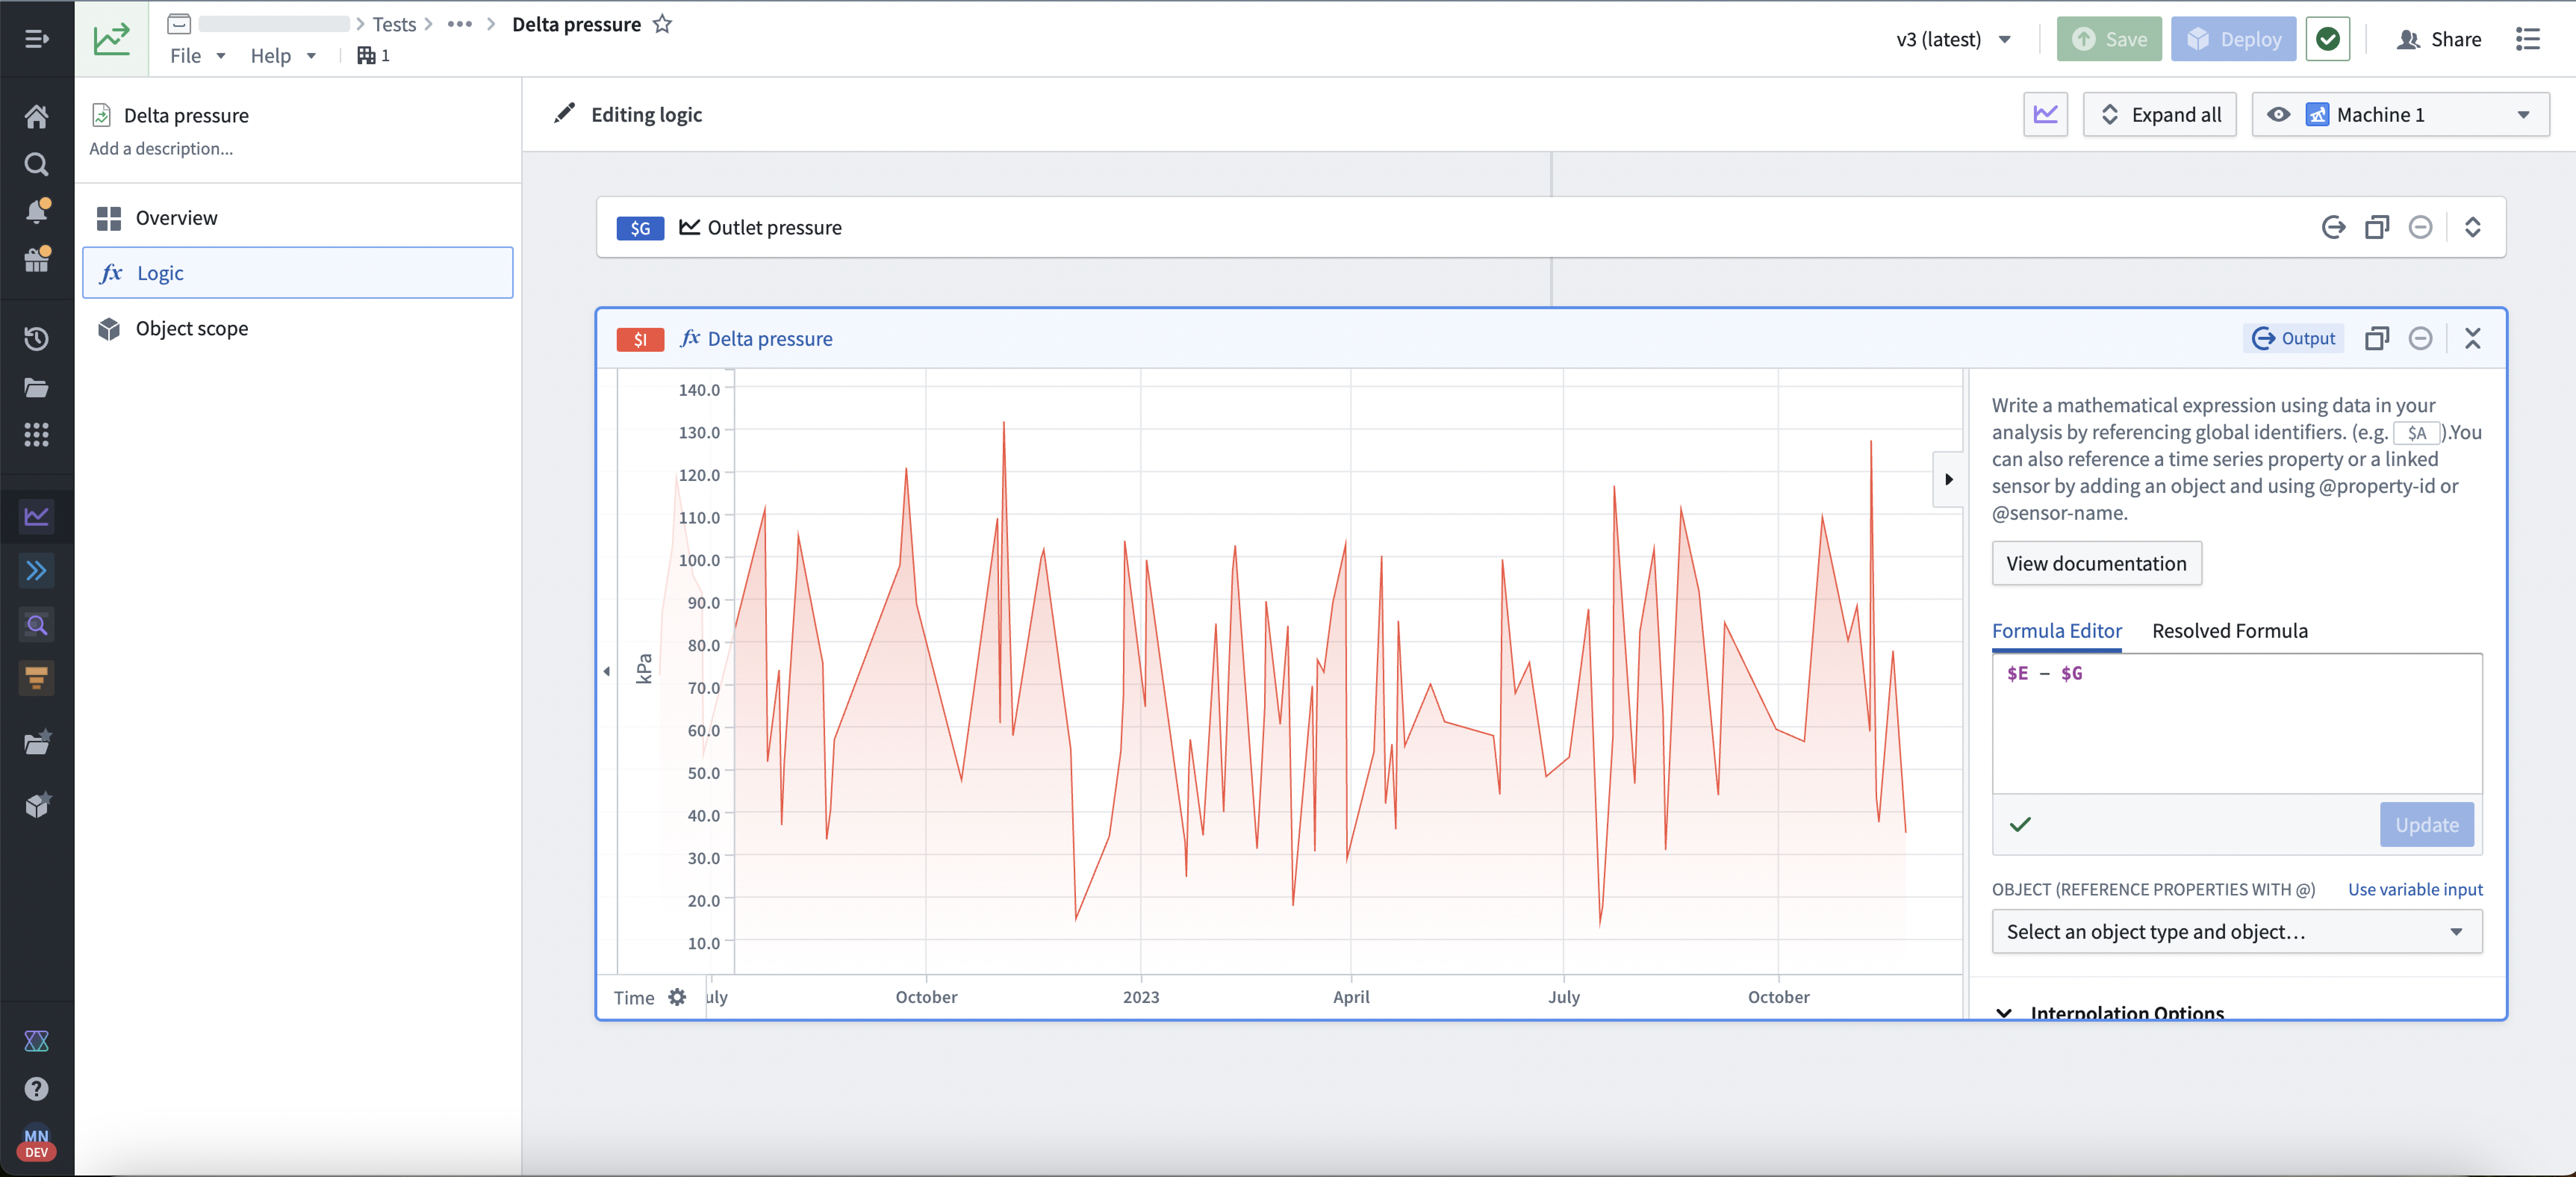
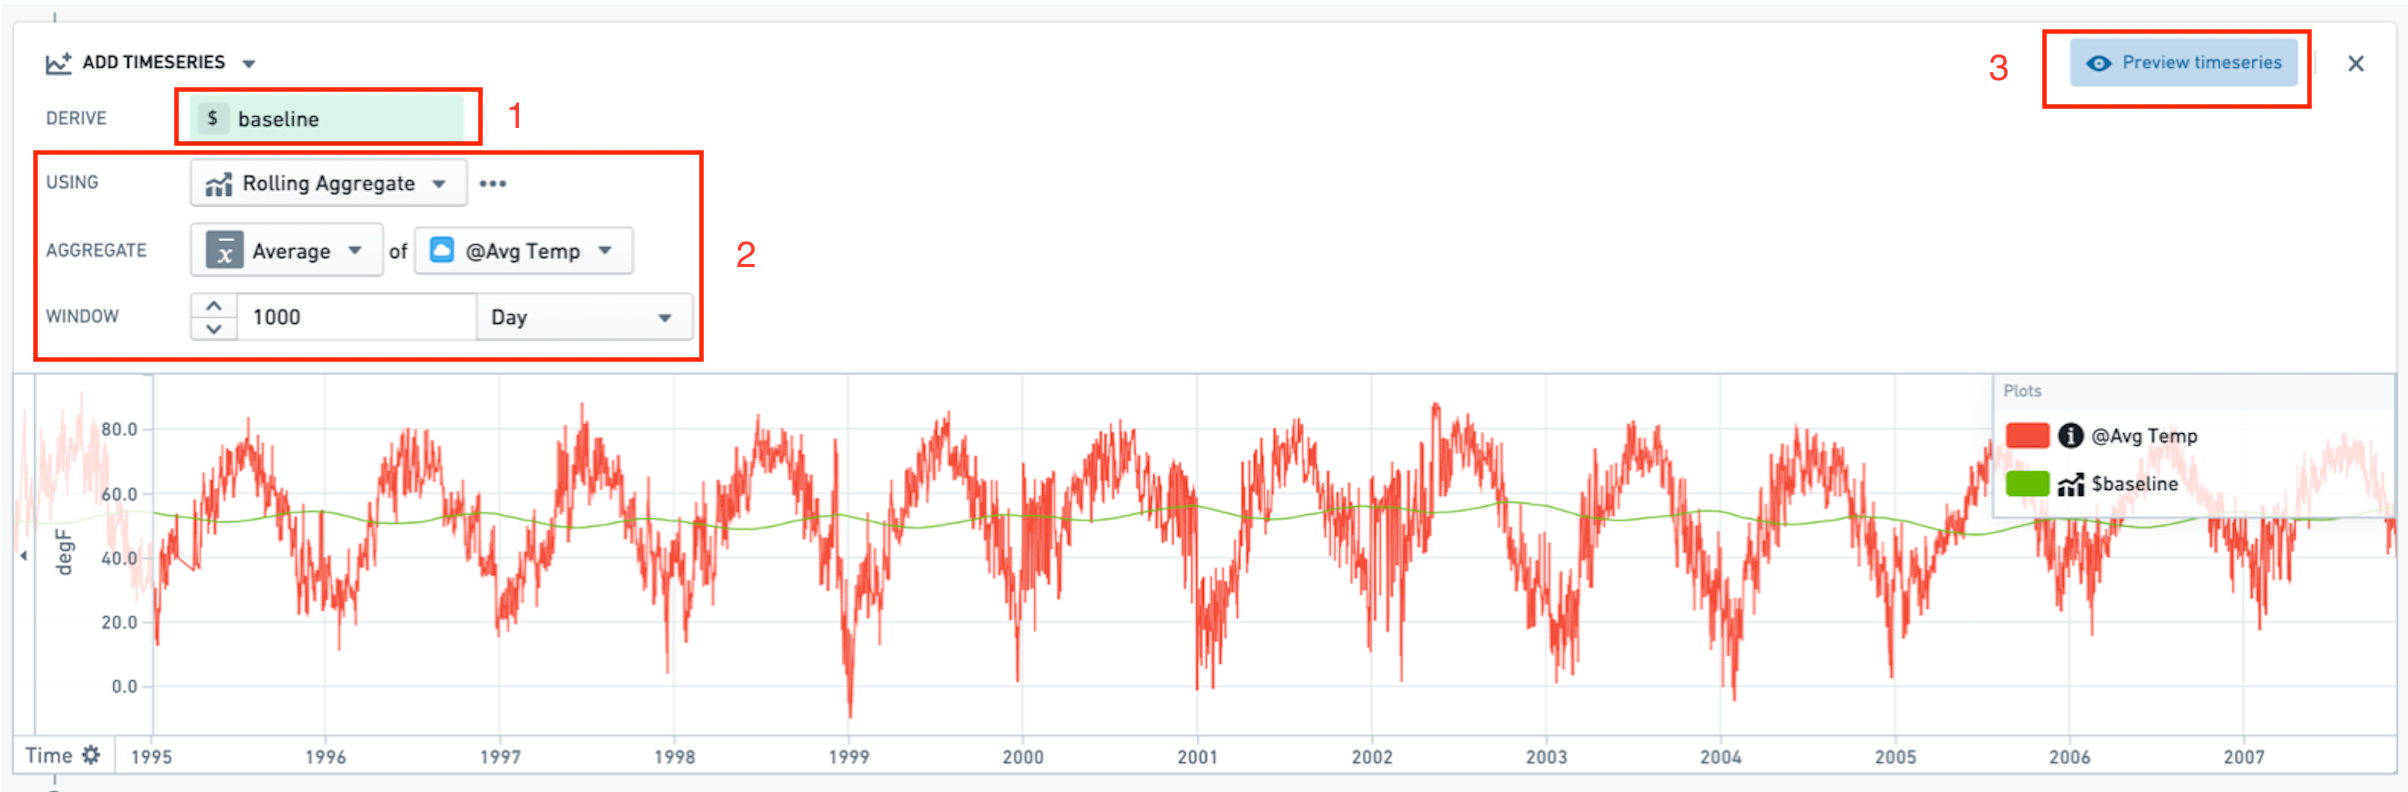
Derived series: Create new time series by applying calculations and transformations to existing time series within the Ontology. These derived series can be referenced and consumed in the same way as any standard time series in the Ontology.
Vertex: Interact with time series to visualize changes across your system, and perform deep analyses to view the impact of past decisions, explore the current state, and recognize future potential.
Foundry Rules: Write rules that identify time periods of interest within your data.
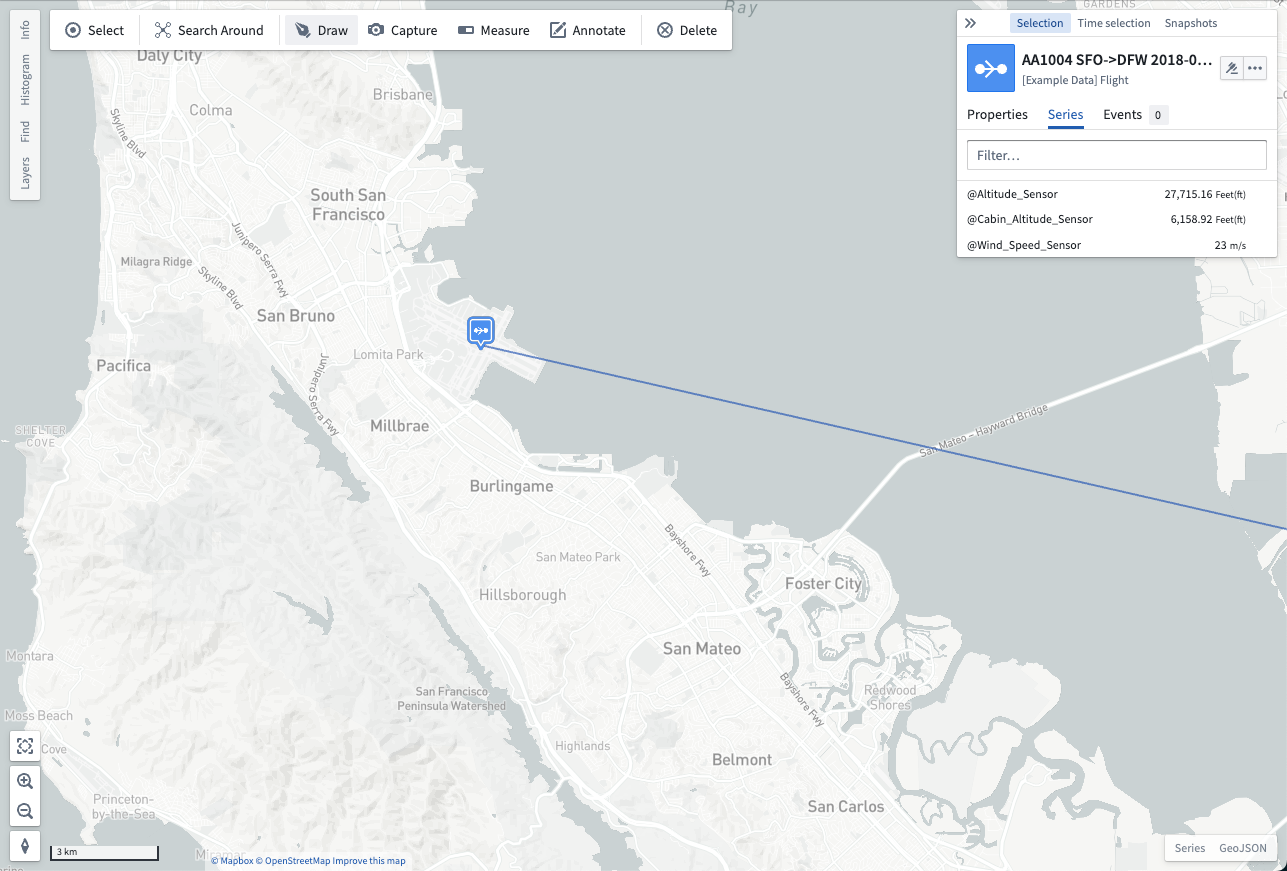
Map: View and analyze time series data associated with geospatial objects. In the example below, aircraft sensor readings are reported alongside a map showing where the reading occurred.
中文翻译
在 Foundry 中使用时间序列
完成时间序列设置后,您可以使用时间序列对象类型(time series object types)在以下 Foundry 应用中创建可视化和分析。
Quiver:创建交互式时间序列仪表盘和分析。以下示例展示了对机器温度读数随时间变化的分析。
Workshop:使用时间序列地图、图表和指标卡片构建高质量、交互式应用。
Automate:创建自动化流程,当时间序列数据满足用户指定条件时生成警报。
派生序列:通过对本体论(Ontology)中现有时间序列应用计算和转换,创建新的时间序列。这些派生序列(derived series)可以像本体论中的任何标准时间序列一样被引用和使用。
Vertex:与时间序列交互,可视化系统中的变化,并进行深入分析以查看过去决策的影响、探索当前状态以及识别未来潜力。
Foundry Rules:编写规则以识别数据中感兴趣的时间段。
Map:查看和分析与地理空间对象关联的时间序列数据。在以下示例中,飞机传感器读数与显示读数发生位置的地图一同呈现。