Analyze run results(分析运行结果)
Run results show how your functions performed against test cases and evaluation criteria. Result views are available in the AIP Evals application or the integrated AIP Evals sidebar in AIP Logic and AIP Chatbot Studio.
If you have configured pass criteria on your evaluators, AIP Evals will automatically determine a Passed or Failed status for each test case. The results page displays the overall pass percentage across all test cases.
Test case debug view
In some cases, you may want to investigate a specific test case result further. For these cases, the debug view is available. This view provides execution traces, input/output data, and error messages for individual test cases so you can understand your function outputs and evaluator results.
Access the debug view
There are multiple ways to open the debug view for a test case. You can do it from AIP Evals, AIP Logic, or AIP Chatbot Studio.
In AIP Evals
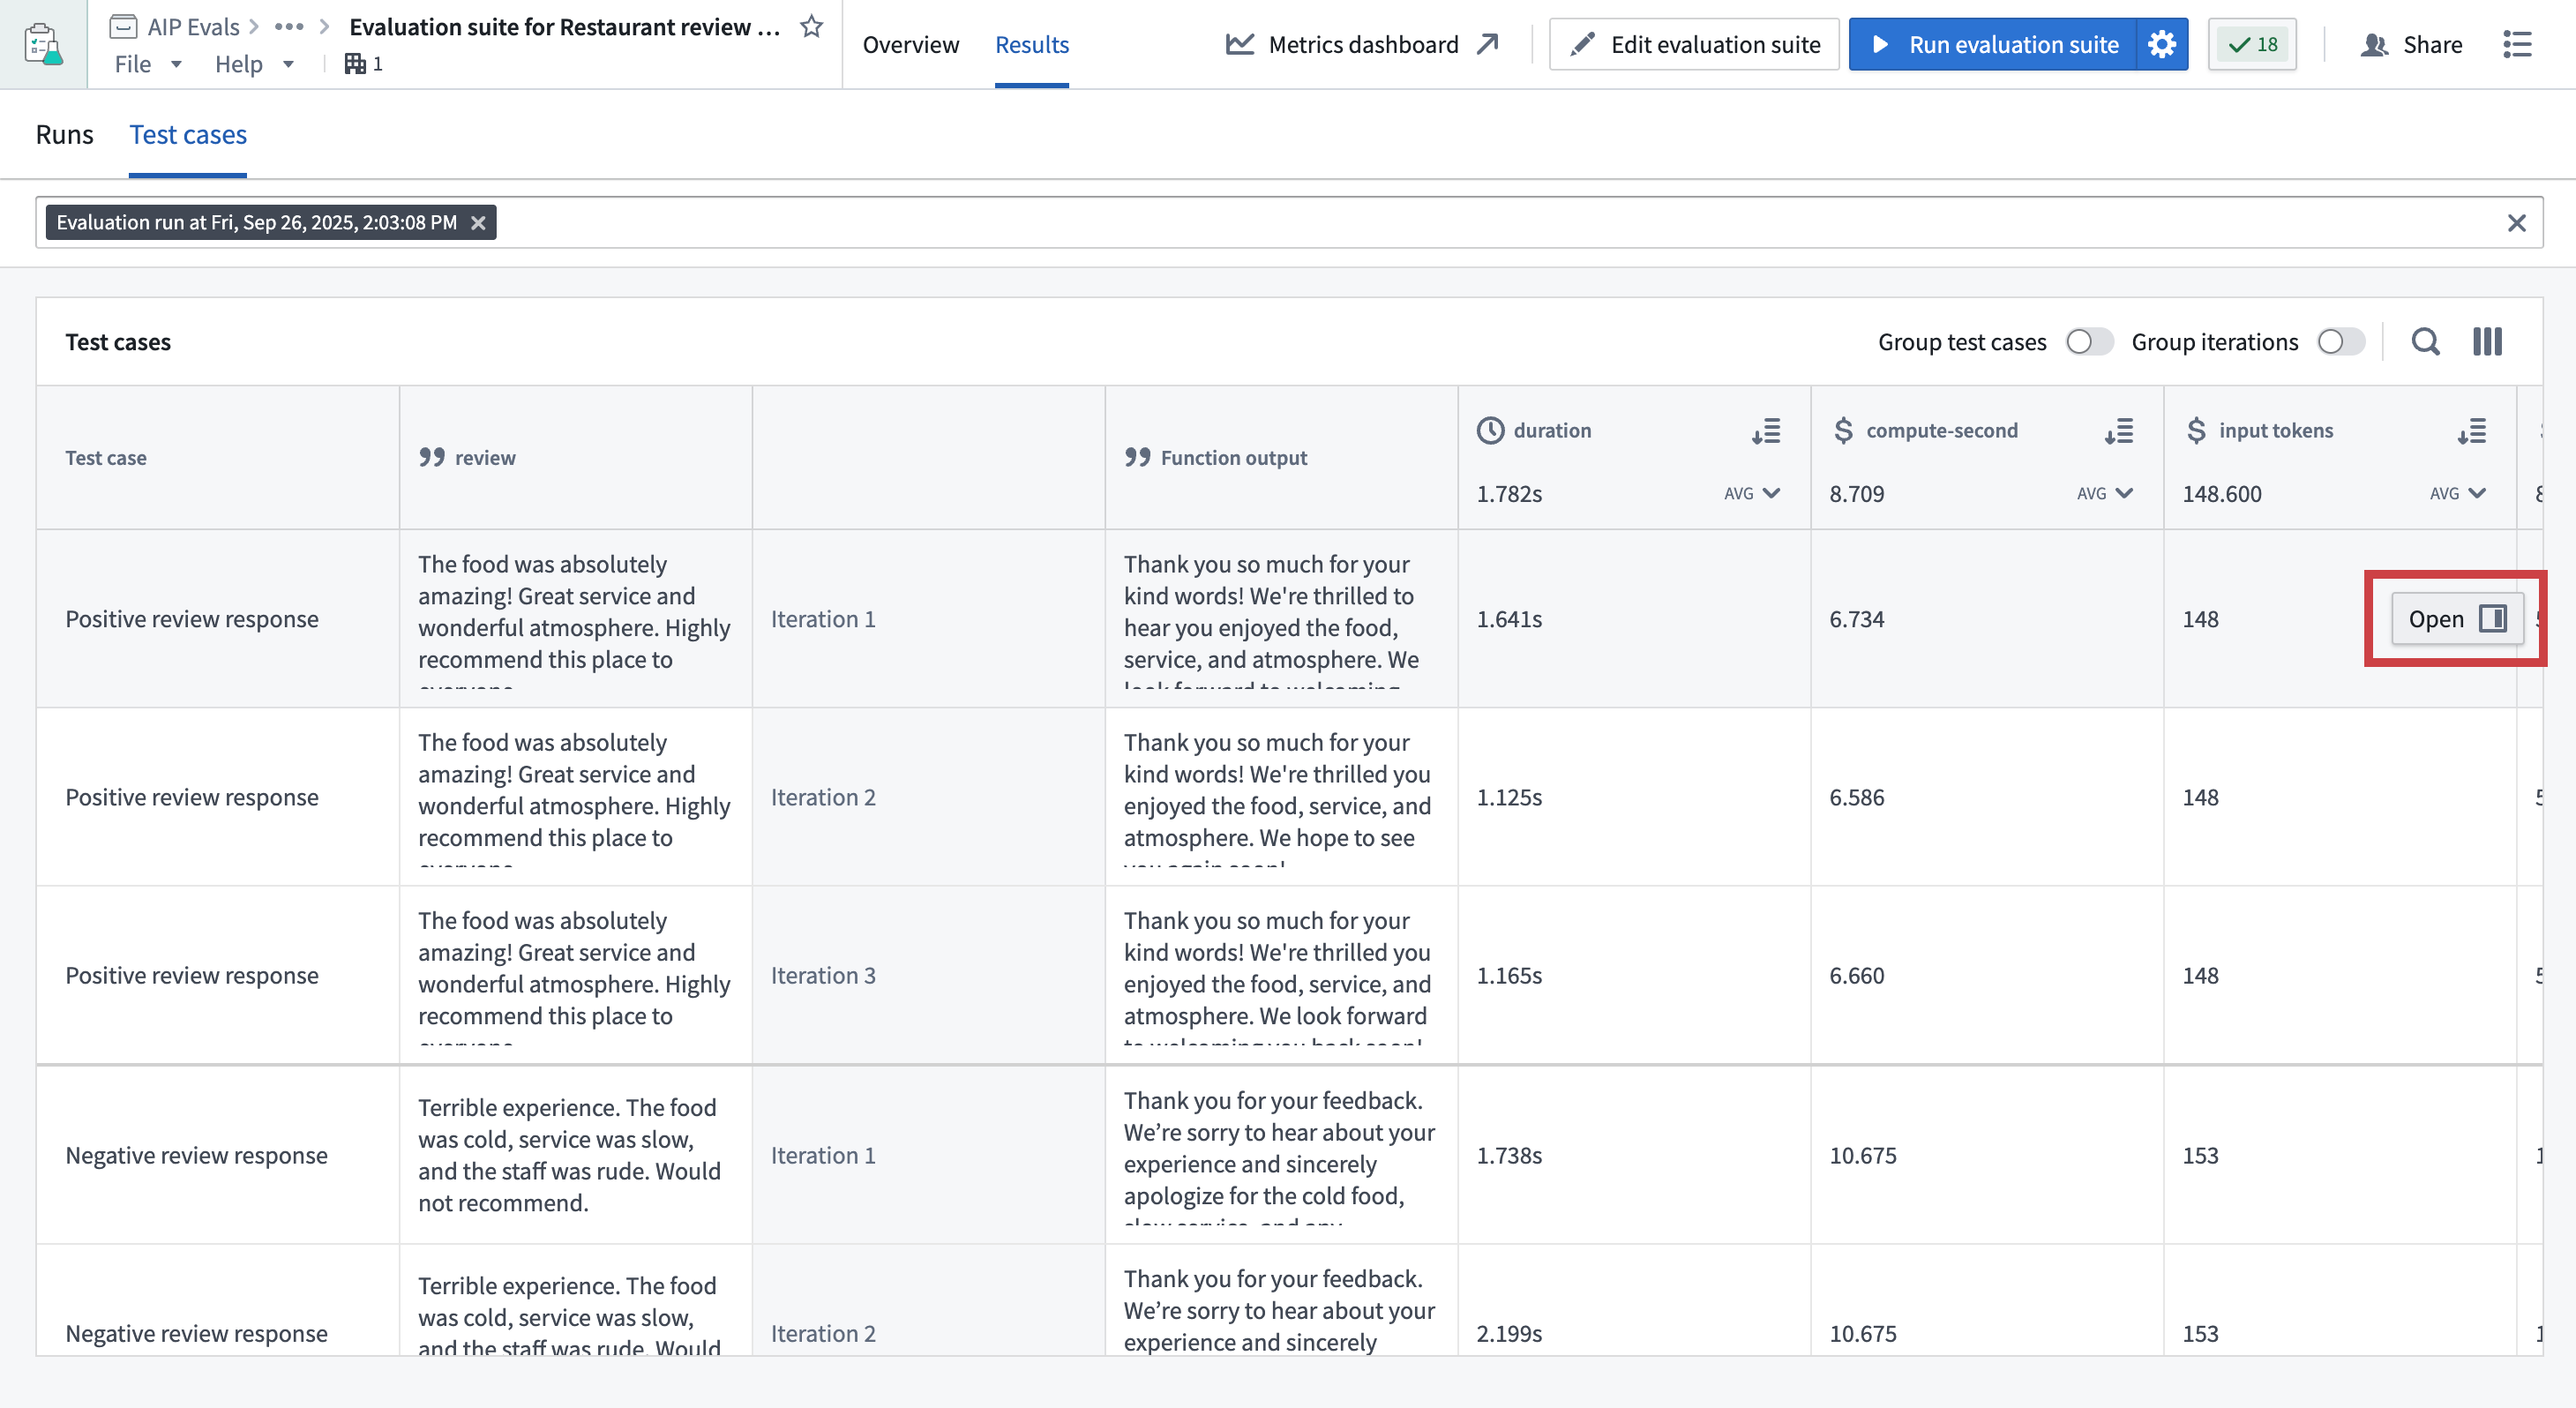
- Open the Results tab on your evaluation suite page.
- Select a run and switch to Test cases.
- Hover over a test case result.
- Select the Open option that appears in the right side of the test case row.
In AIP Logic or AIP Chatbot Studio
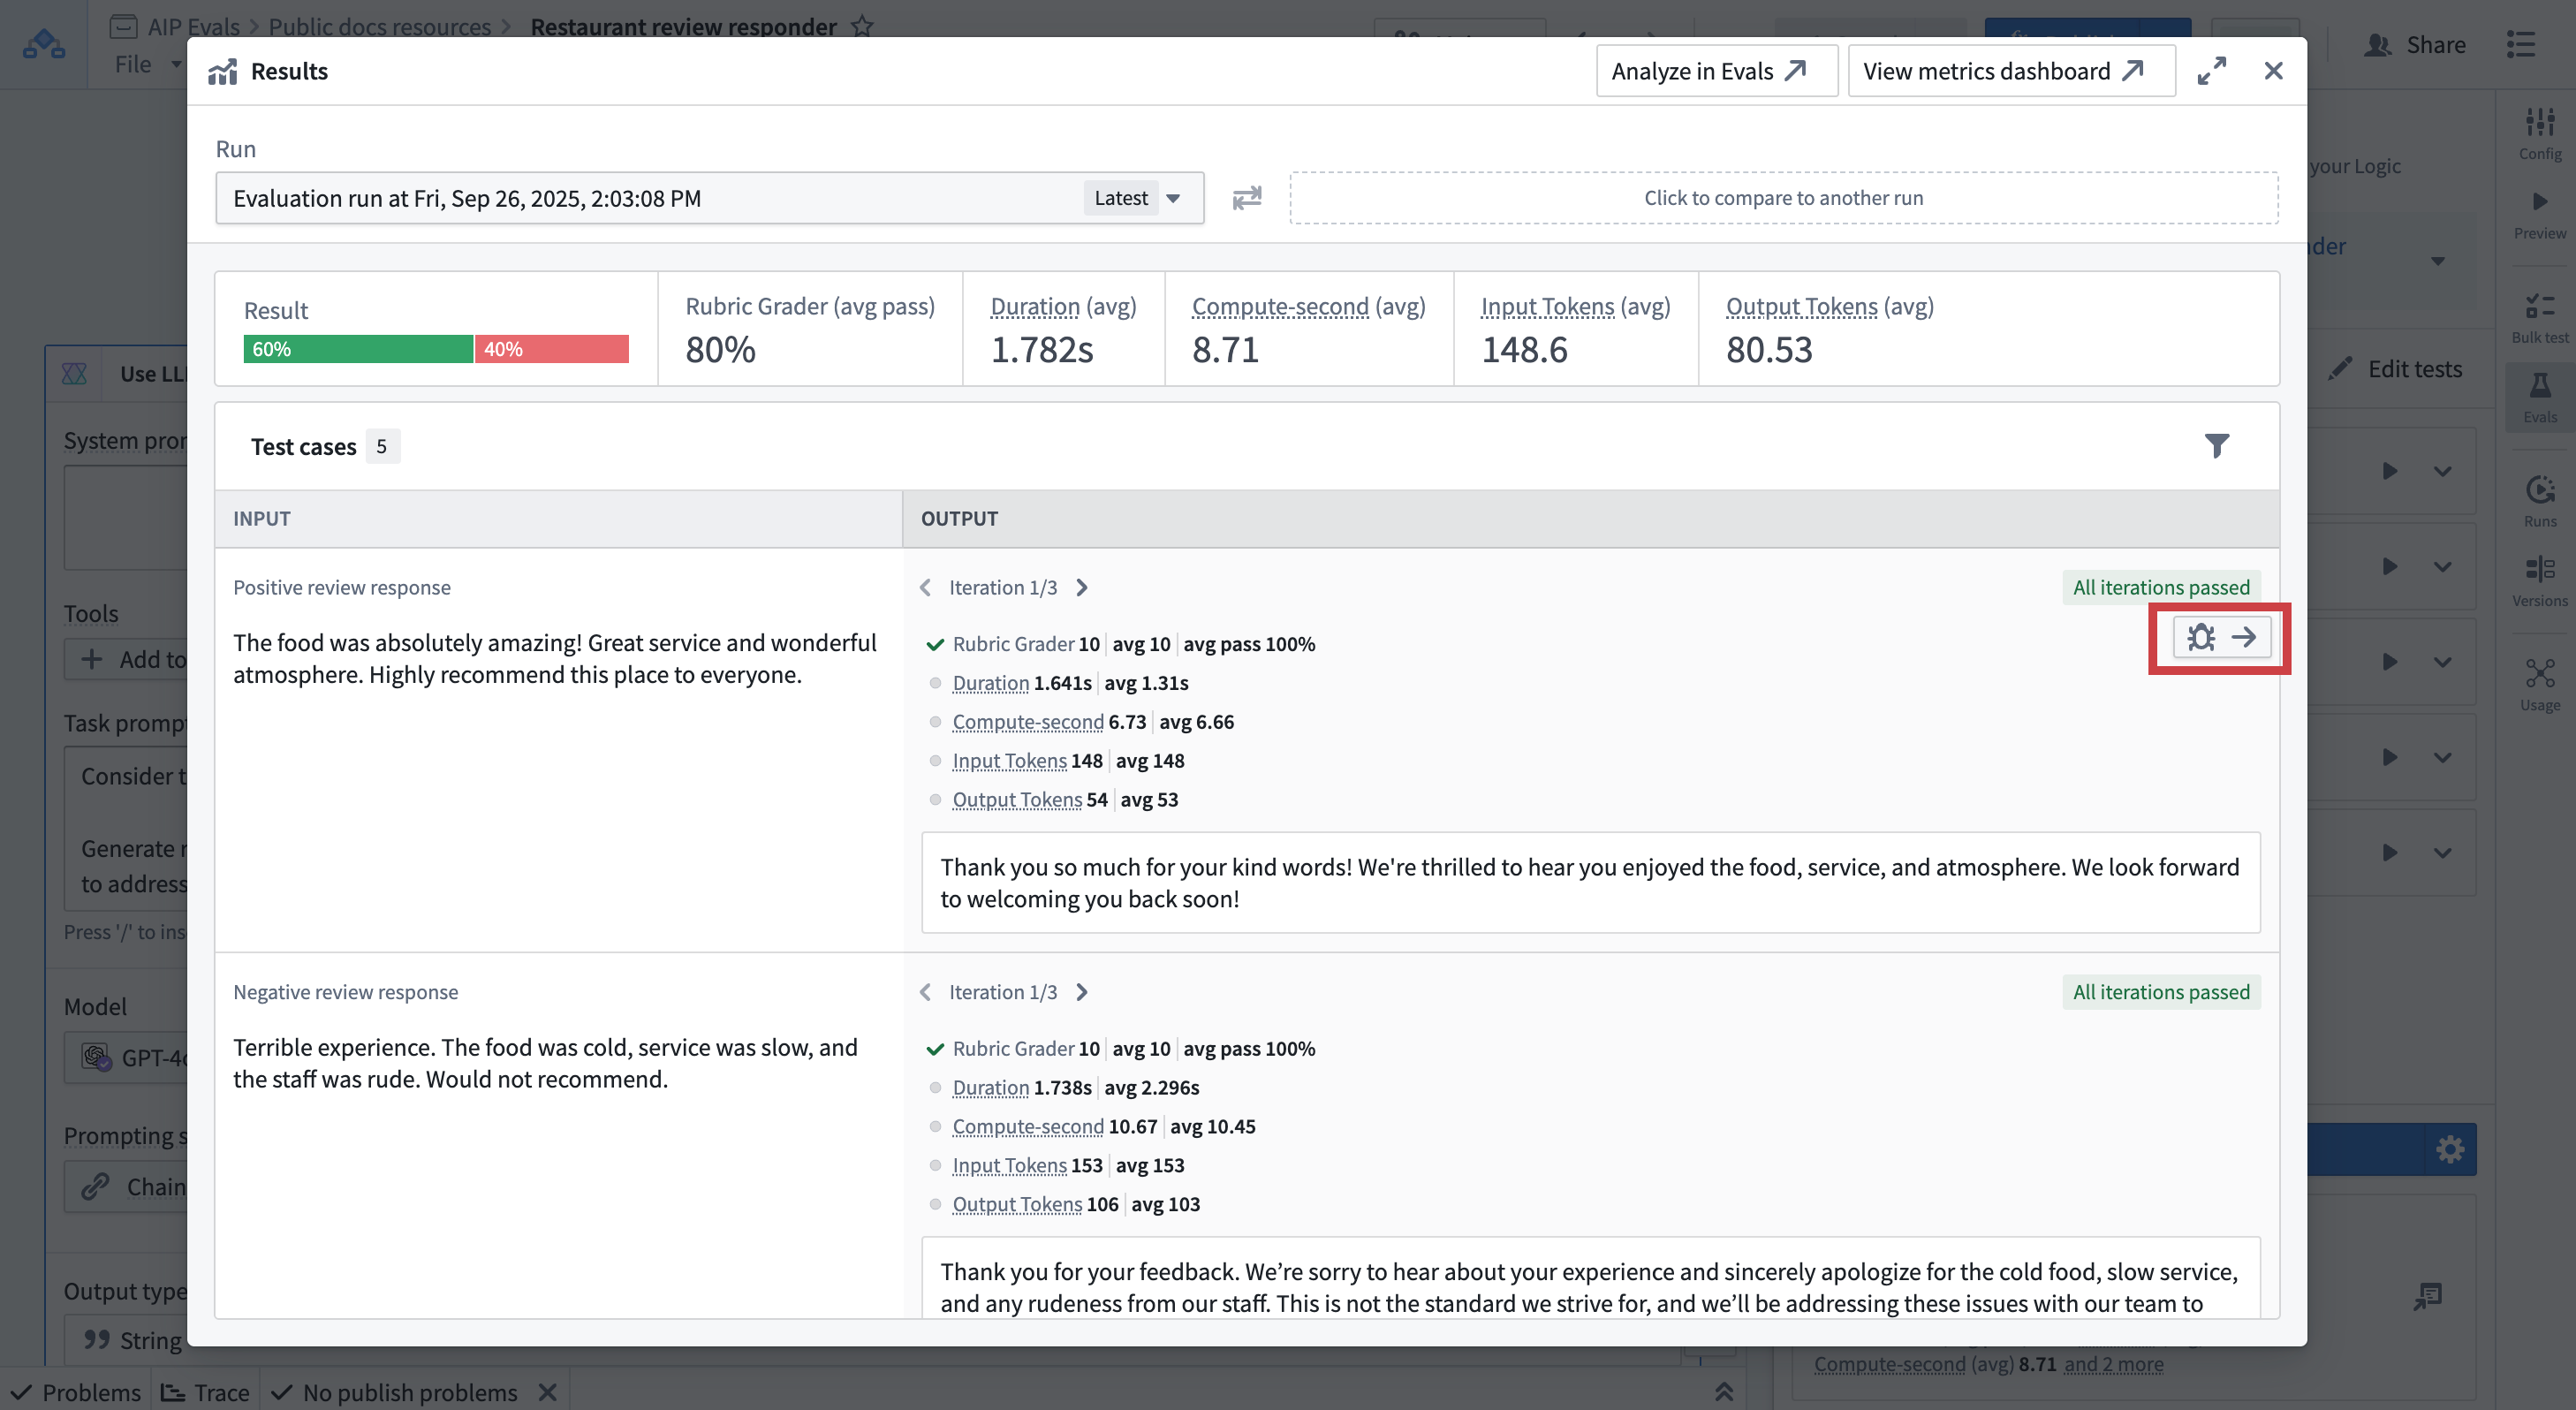
- In the run results dialog view, hover over a test case result.
- Select the Debugger option that appears in the top-right corner of the test case card.
- The debug view will open, showing detailed execution information.
Debug view capabilities
The debug view provides detailed information about test function execution and evaluator results. It allows you to:
- Inspect test function inputs and outputs for a test case.
- TypeScript/Python functions: Access syntax-highlighted code preview of executed code.
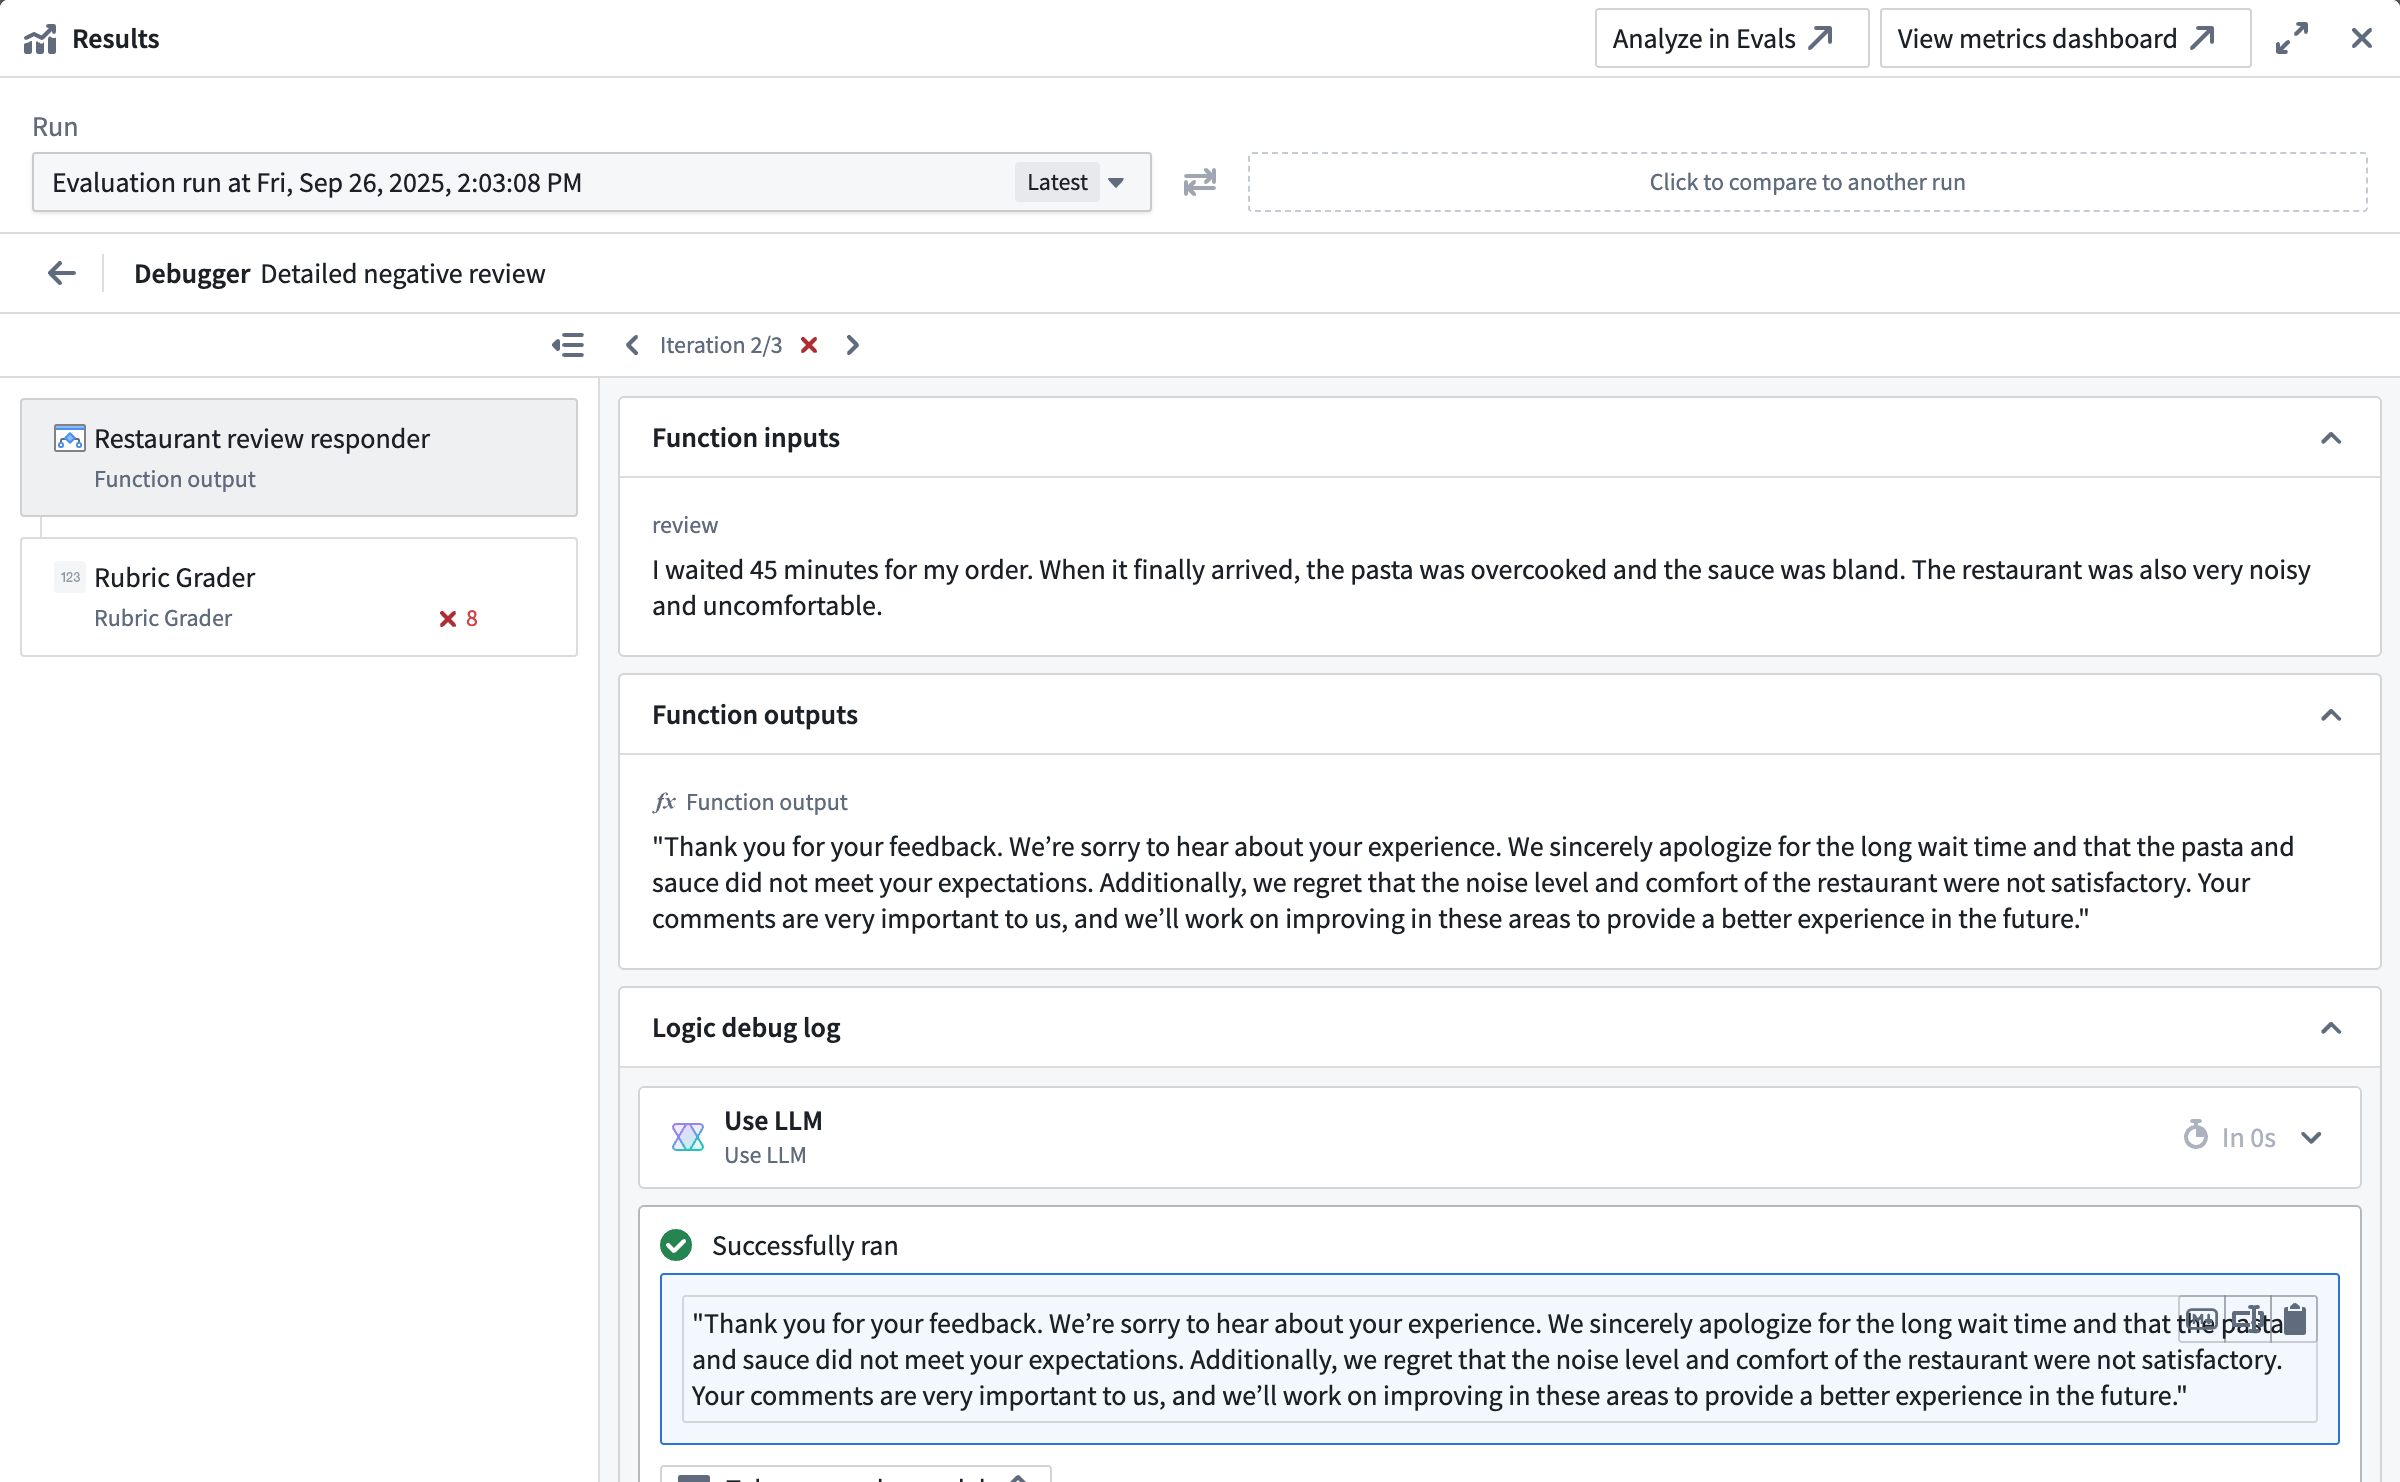
- AIP Logic functions: Trace the function execution step-by-step with the native Logic debugger.
- Evaluators: Check input and output values, expected vs. actual evaluator results, and debug outputs from custom function evaluators.
Custom function evaluators can return string values alongside their metric outputs. These strings appear as Debug outputs in the evaluator tab, providing additional context such as reasoning, intermediate values, or diagnostic information.

Evaluation functions that are backed by AIP Logic, like the out-of-the-box provided Rubric grader or Contains key details evaluators allow access to the native Logic debugger. This helps you understand why the evaluation produced a specific result which is particularly helpful when using an LLM-as-a-judge evaluator.
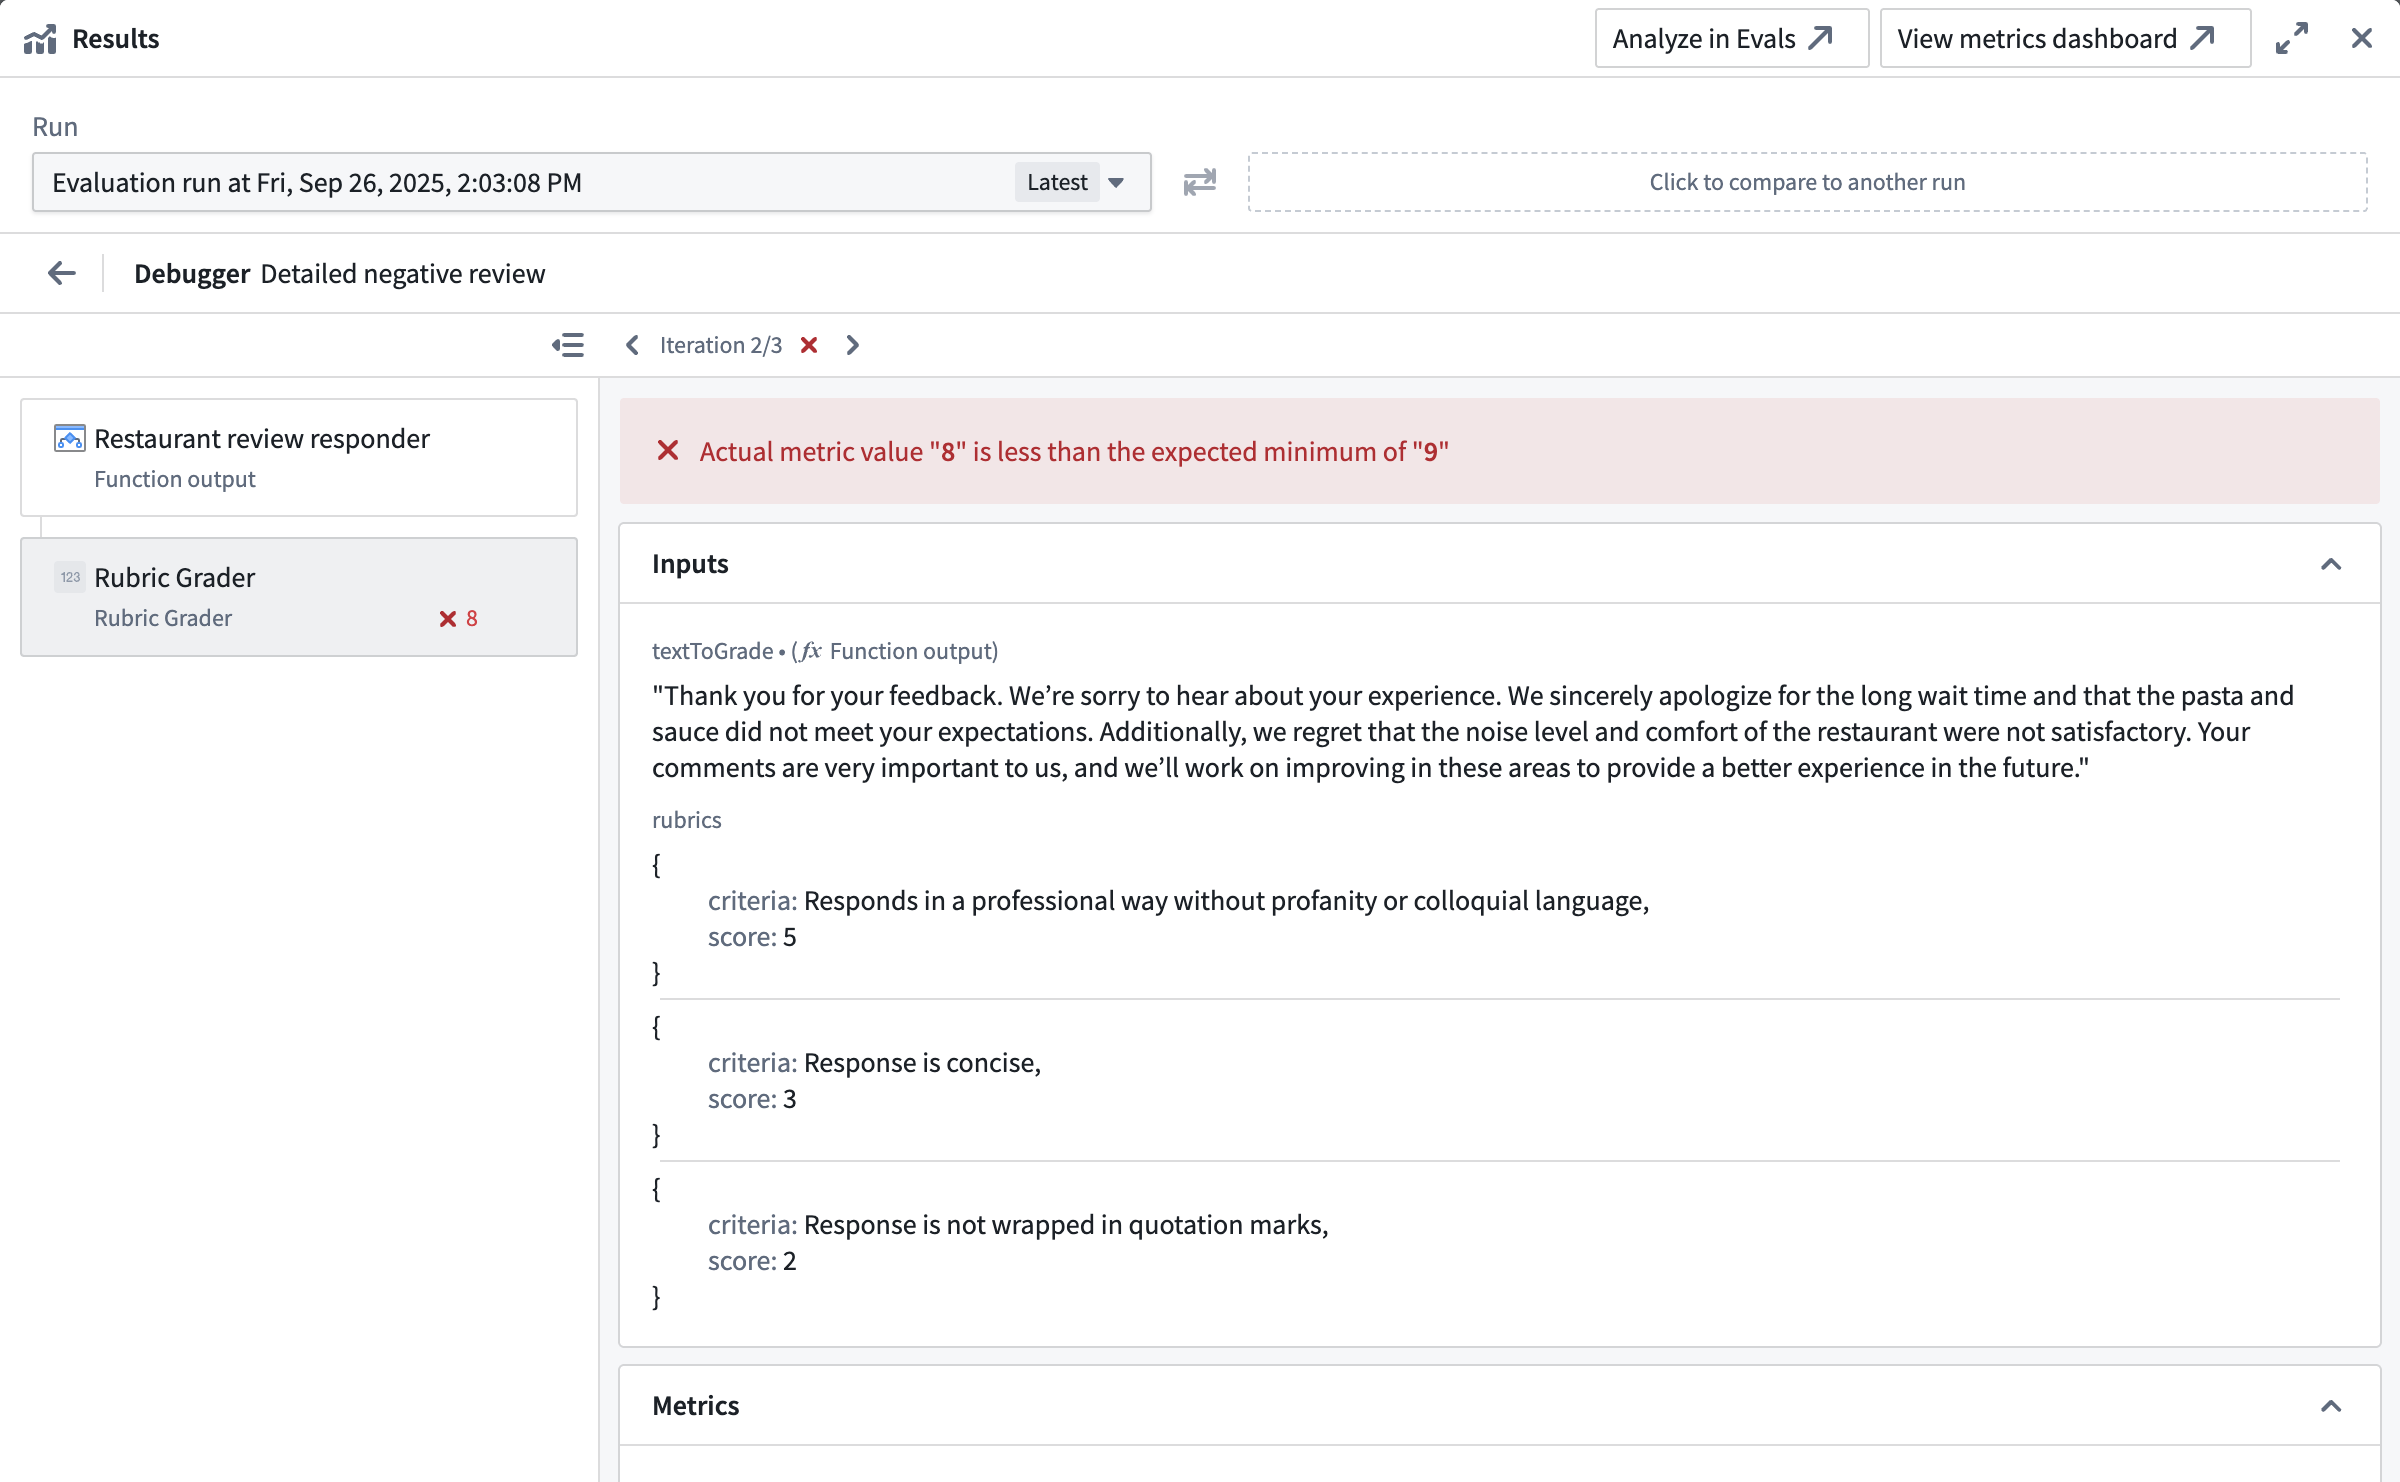
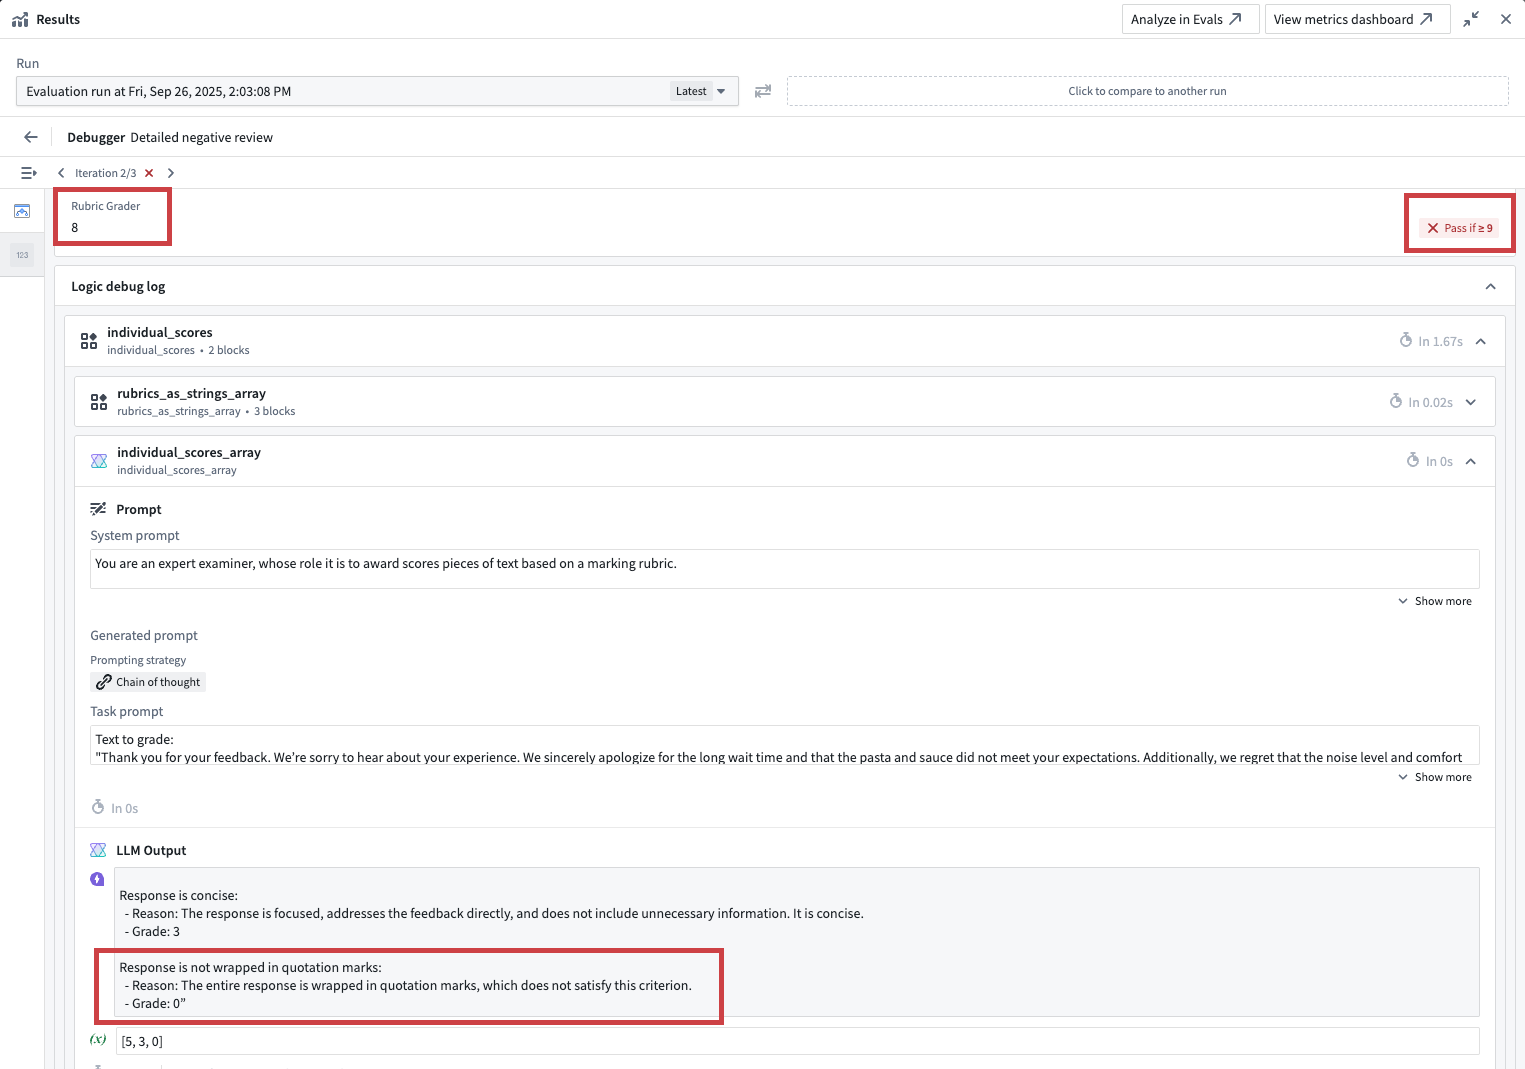
In the example shown in the screenshot below, the rubric grader evaluator did not pass, because the result of 8 did not cross the defined minimum threshold of 9. Looking into the Logic debugger, we can see that the LLM judge only awarded 8 points because the response was wrapped in quotation marks. To earn a higher score, we will need to improve our prompt.
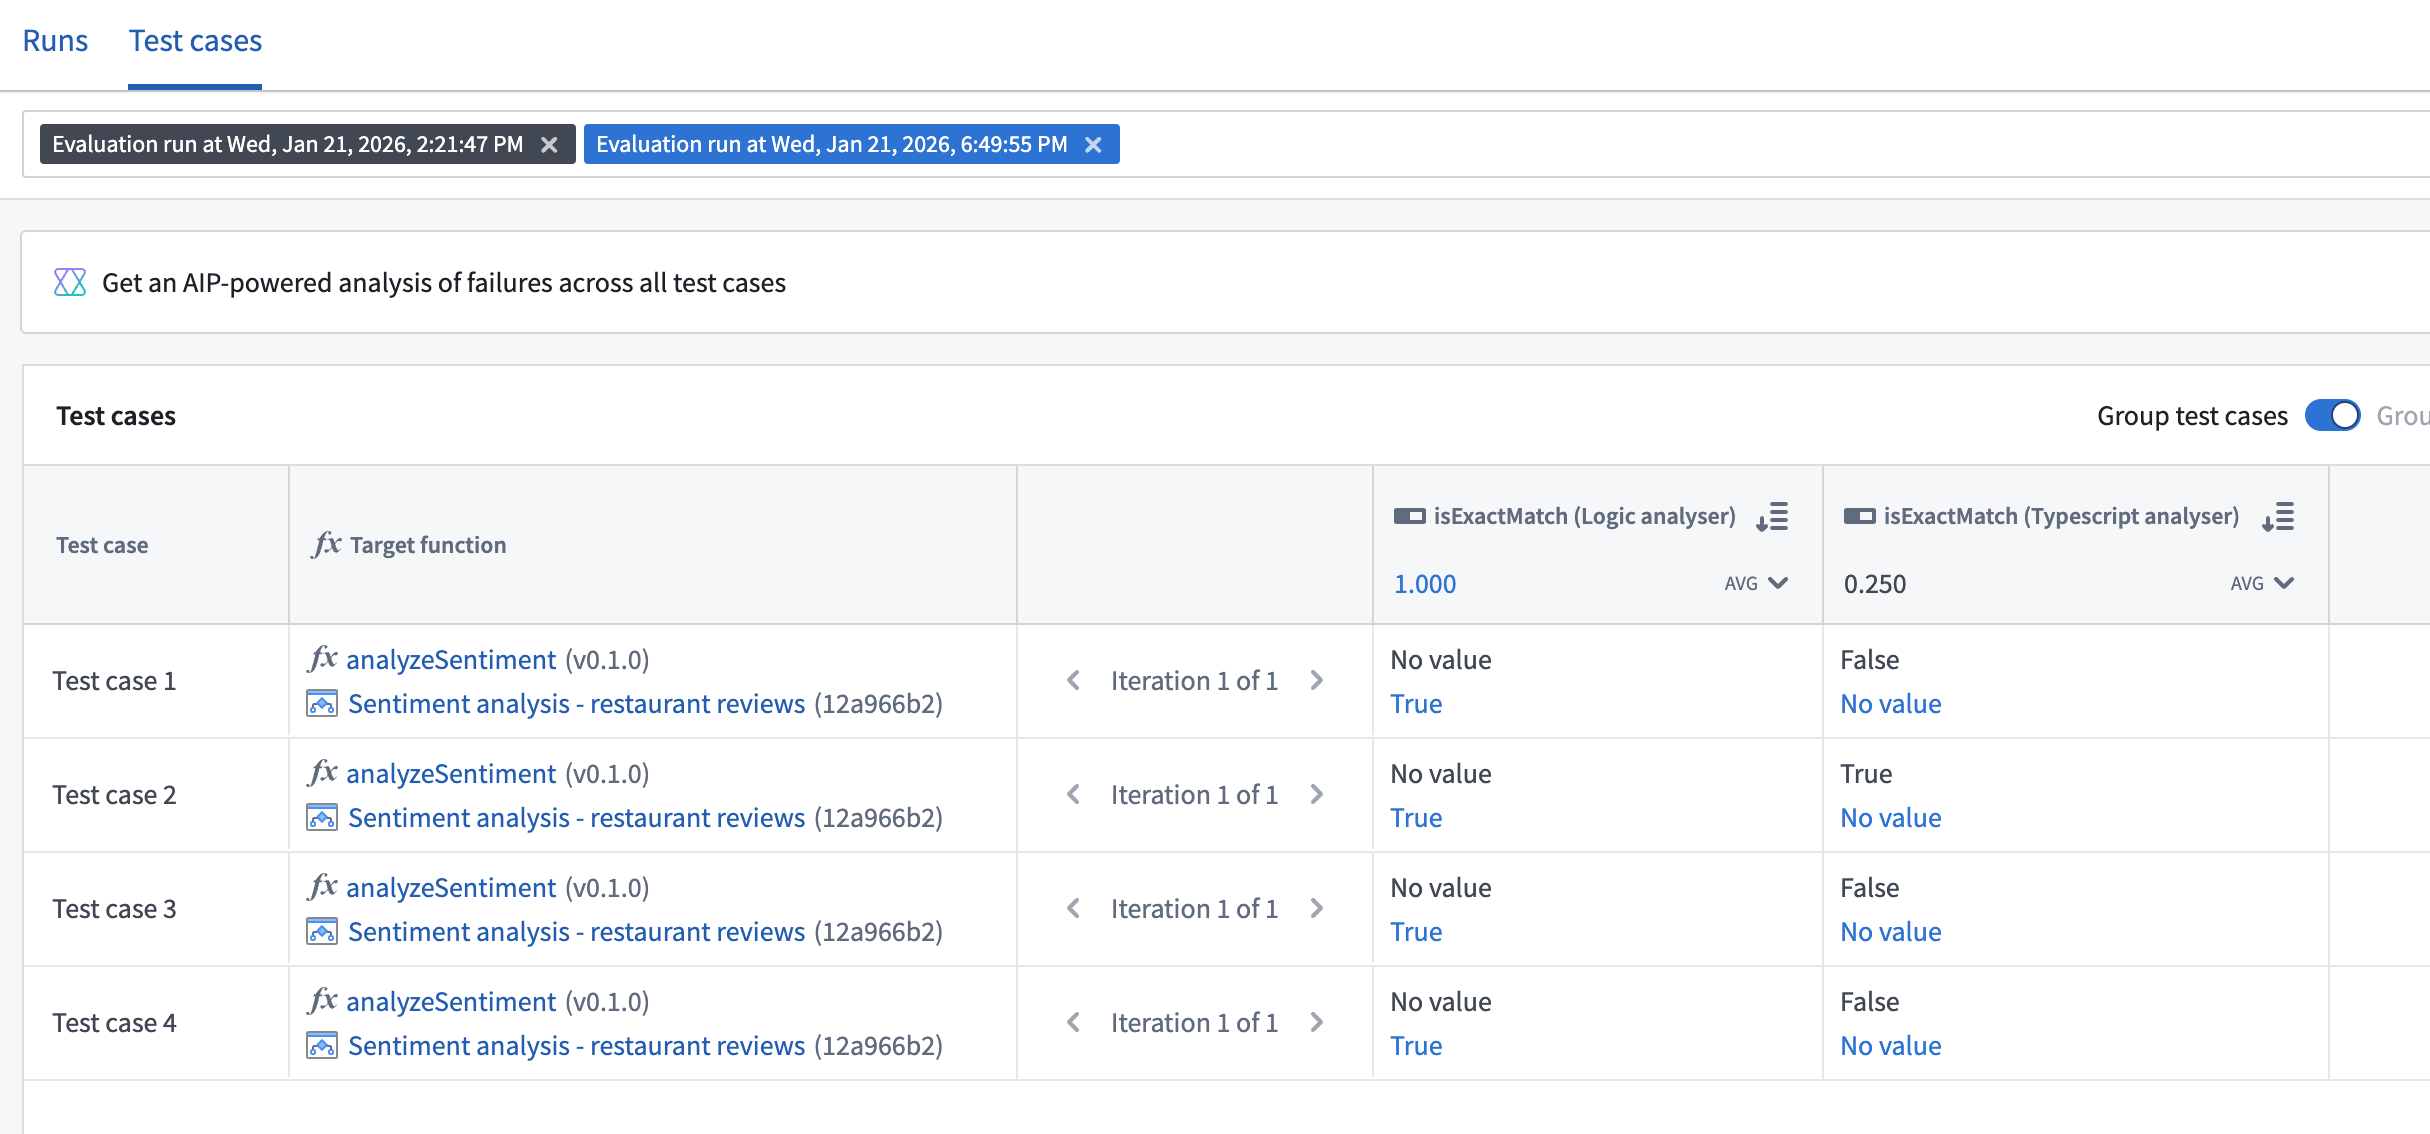
Compare results across target functions
When your evaluation suite has multiple target functions configured, you can select and compare results from runs across different targets in AIP Evals. This is useful for analyzing how different function implementations perform on the same test cases.
Analyze results with AI FDE
You can use AI FDE to analyze failing test cases, identify root cause patterns, and receive suggestions to improve your prompts.
Analyze from AIP Evals
- Open the Results tab on your evaluation suite page.
- Select a single run that contains failing test cases and select the Test cases tab.
- Select Analyze with AI FDE.
Analyze from AIP Logic
- Open the run results dialog view from the AIP Evals sidebar.
- Select Analyze with AI FDE.
AI FDE will open in a new tab with the context of your run results. For more information on AI FDE, see the AI FDE documentation.
中文翻译
分析运行结果
运行结果展示了您的函数在测试用例和评估标准下的表现。您可以在 AIP Evals 应用程序中,或 AIP Logic 和 AIP Chatbot Studio 集成的 AIP Evals 侧边栏中查看结果视图。
如果您在评估器(evaluator)上配置了通过标准(pass criteria),AIP Evals 将自动为每个测试用例判定 Passed(通过)或 Failed(失败)状态。结果页面会显示所有测试用例的总体通过率。
测试用例调试视图
在某些情况下,您可能需要进一步调查特定测试用例的结果。为此,我们提供了调试视图(debug view)。该视图提供单个测试用例的执行追踪、输入/输出数据以及错误信息,帮助您理解函数输出和评估器结果。
访问调试视图
有多种方式可以打开测试用例的调试视图。您可以从 AIP Evals、AIP Logic 或 AIP Chatbot Studio 中进行操作。
在 AIP Evals 中
- 打开评估套件(evaluation suite)页面上的 Results(结果)选项卡。
- 选择一个运行记录,然后切换到 Test cases(测试用例)。
- 将鼠标悬停在一个测试用例结果上。
- 选择测试用例行右侧出现的 Open(打开)选项。
在 AIP Logic 或 AIP Chatbot Studio 中
- 在运行结果对话框视图中,将鼠标悬停在一个测试用例结果上。
- 选择测试用例卡片右上角出现的 Debugger(调试器)选项。
- 调试视图将打开,显示详细的执行信息。
调试视图功能
调试视图提供关于测试函数执行和评估器结果的详细信息。它允许您:
- 检查测试用例的测试函数输入和输出。
- TypeScript/Python 函数: 访问已执行代码的语法高亮预览。
- AIP Logic 函数: 使用原生 Logic 调试器逐步追踪函数执行过程。
- 评估器: 检查输入和输出值、评估器的预期结果与实际结果,以及来自自定义函数评估器(custom function evaluator)的调试输出。
自定义函数评估器可以在其指标输出(metric outputs)之外返回字符串值。这些字符串会作为 Debug outputs(调试输出)显示在评估器选项卡中,提供额外的上下文信息,例如推理过程、中间值或诊断信息。
由 AIP Logic 支持的评估函数(例如开箱即用的评分标准评估器(Rubric grader)或包含关键细节评估器(Contains key details evaluators))允许访问原生 Logic 调试器。这有助于您理解评估产生特定结果的原因,在使用 LLM-as-a-judge 评估器时尤其有用。
在下方截图所示的示例中,评分标准评估器未通过,因为 8 分的结果未达到定义的最低阈值 9 分。通过查看 Logic 调试器,我们可以看到 LLM 评判员仅给了 8 分,因为回复被包裹在引号中。要获得更高分数,我们需要改进提示词(prompt)。
比较不同目标函数的结果
当您的评估套件配置了多个目标函数(target functions)时,您可以在 AIP Evals 中选择并比较不同目标运行的结果。这对于分析不同函数实现在相同测试用例上的表现非常有用。
使用 AI FDE 分析结果
您可以使用 AI FDE 来分析失败的测试用例,识别根本原因模式,并获得改进提示词的建议。
从 AIP Evals 进行分析
- 打开评估套件页面上的 Results(结果)选项卡。
- 选择一个包含失败测试用例的运行记录,然后选择 Test cases(测试用例)选项卡。
- 选择 Analyze with AI FDE(使用 AI FDE 分析)。
从 AIP Logic 进行分析
- 从 AIP Evals 侧边栏打开运行结果对话框视图。
- 选择 Analyze with AI FDE(使用 AI FDE 分析)。
AI FDE 将在新选项卡中打开,并包含您运行结果的上下文。有关 AI FDE 的更多信息,请参阅 AI FDE 文档。