Log search(日志搜索)
The Search logs tab in Workflow Lineage allows you to search across all service logs produced by a selected source executor over the past 30 days. Unlike the per-execution service logs view, log search aggregates logs from every execution originating from a given source executor, making it useful for investigating recurring errors or finding specific log messages across multiple runs.
A source executor is the first executable resource in the call chain and can be a function, action, automation, AIP logic, or AIP agent. When a function is backed by another resource, such as AIP logic, a language model, or an AIP agent, the log search panel displays the backing resource as the source executor rather than the underlying function.
Accessing log search
To access log search:
- Open Workflow Lineage and navigate to the workflow containing your resource.
- Select an executable resource node.
- Select the Search logs tab in the bottom panel.
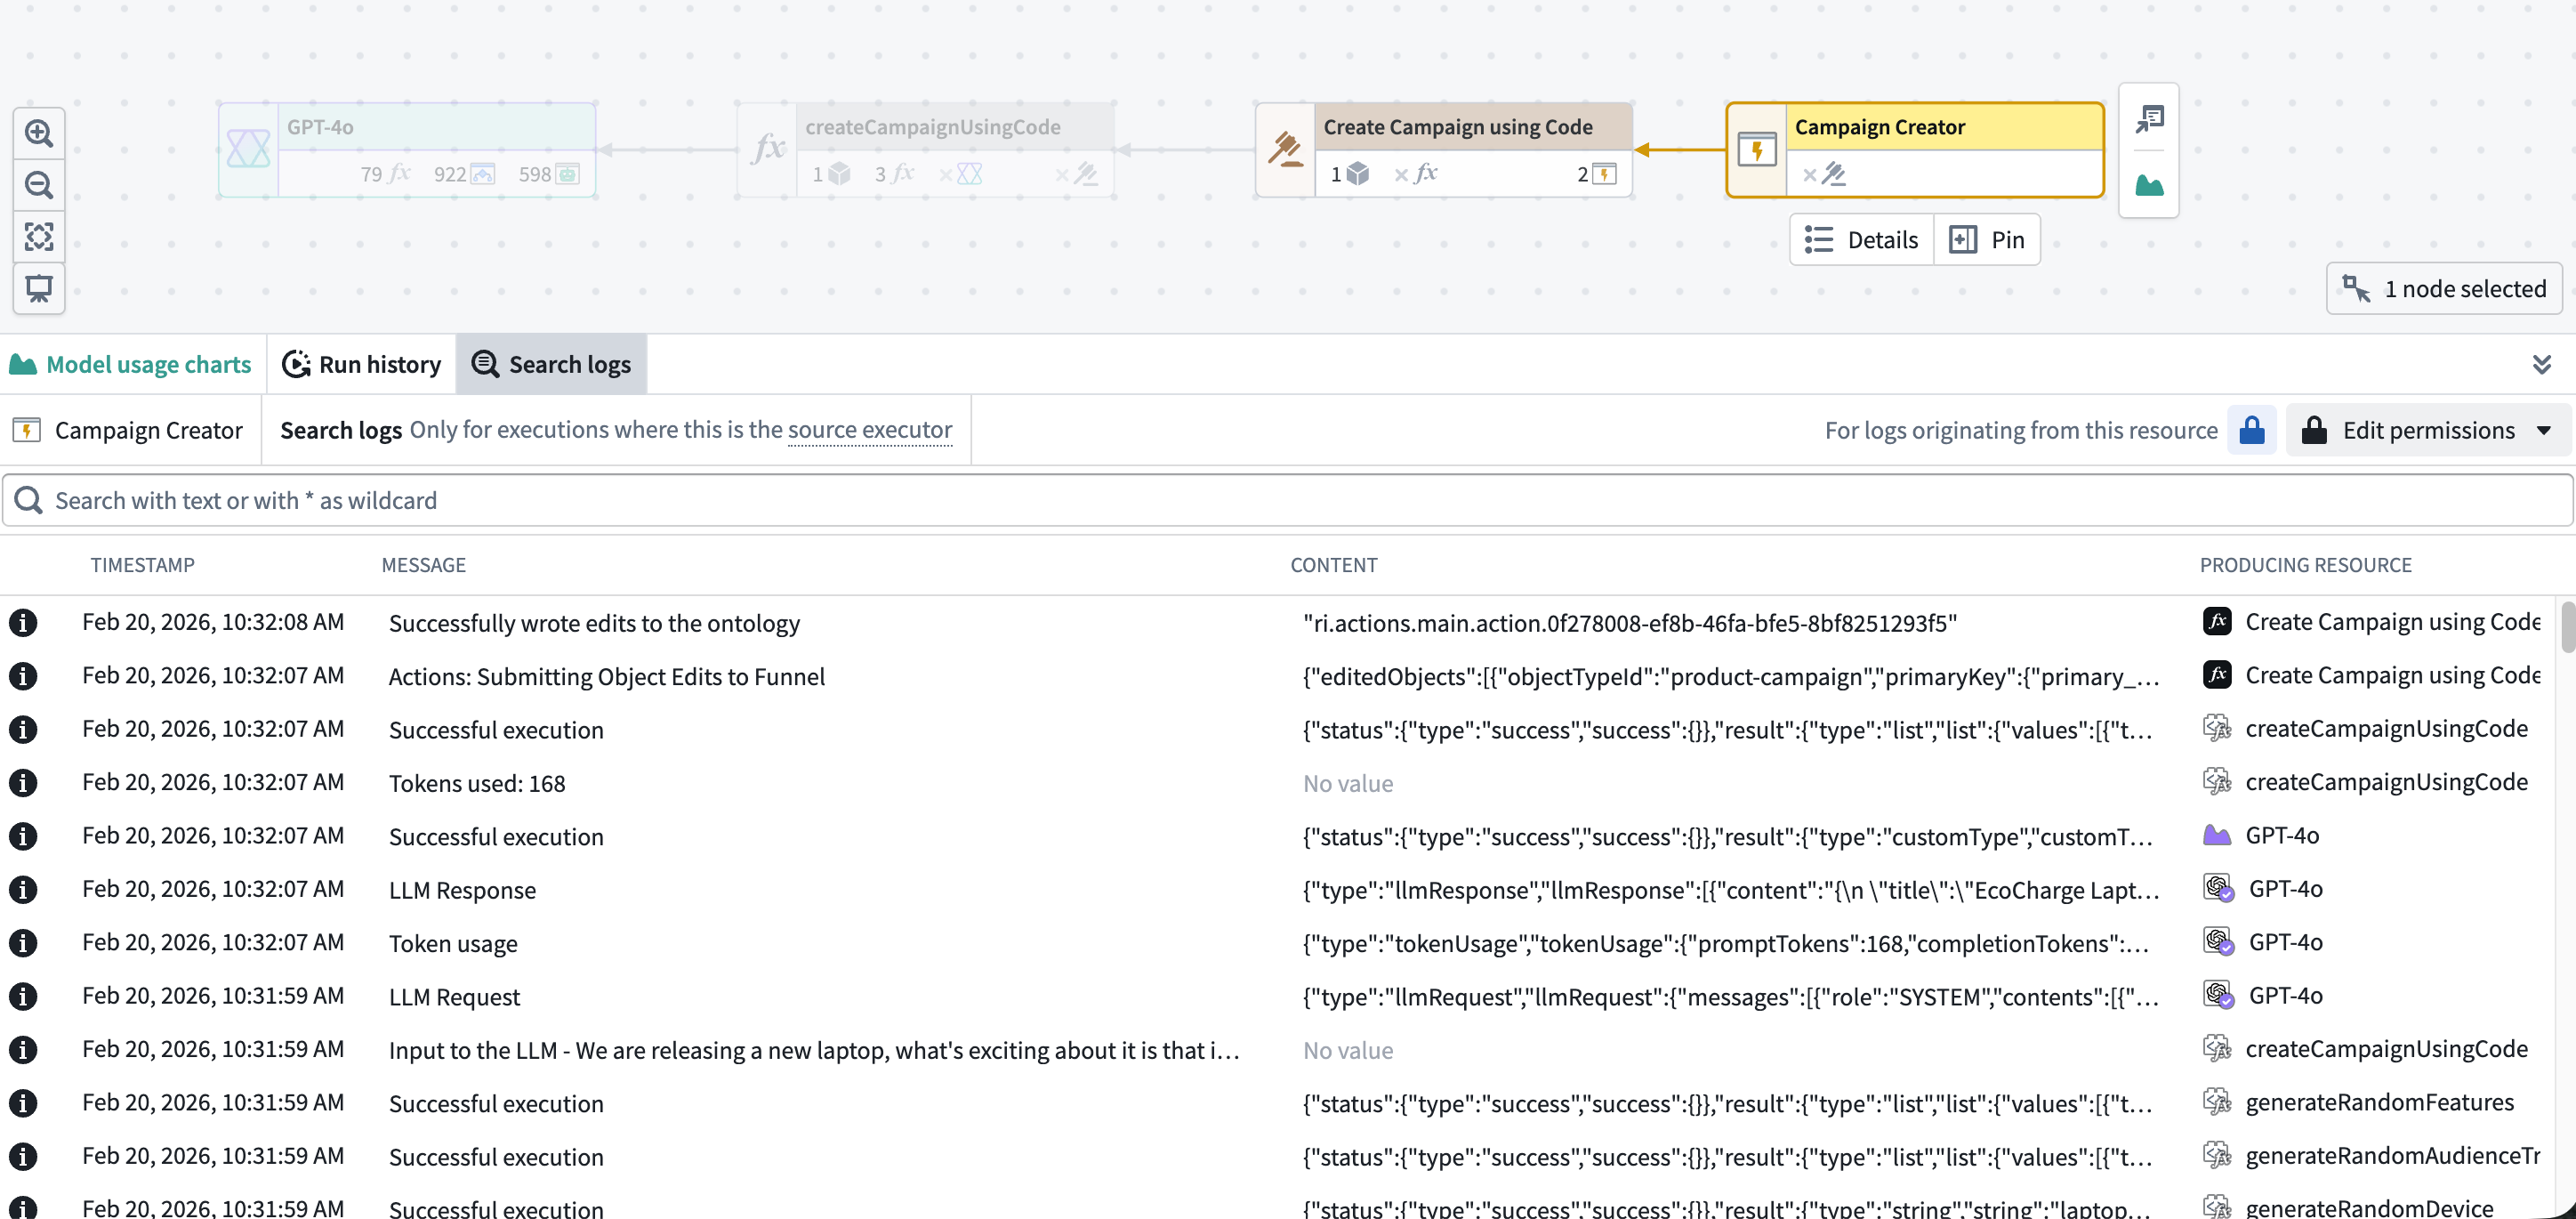
Searching logs
The search bar at the top of the Search logs panel accepts text queries. Type a search term and the results will populate the results table. The search is case-sensitive and matches against the full log line, including both the Message and Content fields.
You can use * as a wildcard character to match any sequence of characters. For example:
connection failedmatches log lines containing the exact phrase "connection failed"timeout*retrymatches log lines containing "timeout" followed by "retry" with any characters in betweenErrormatches "Error" but not "error" or "ERROR"
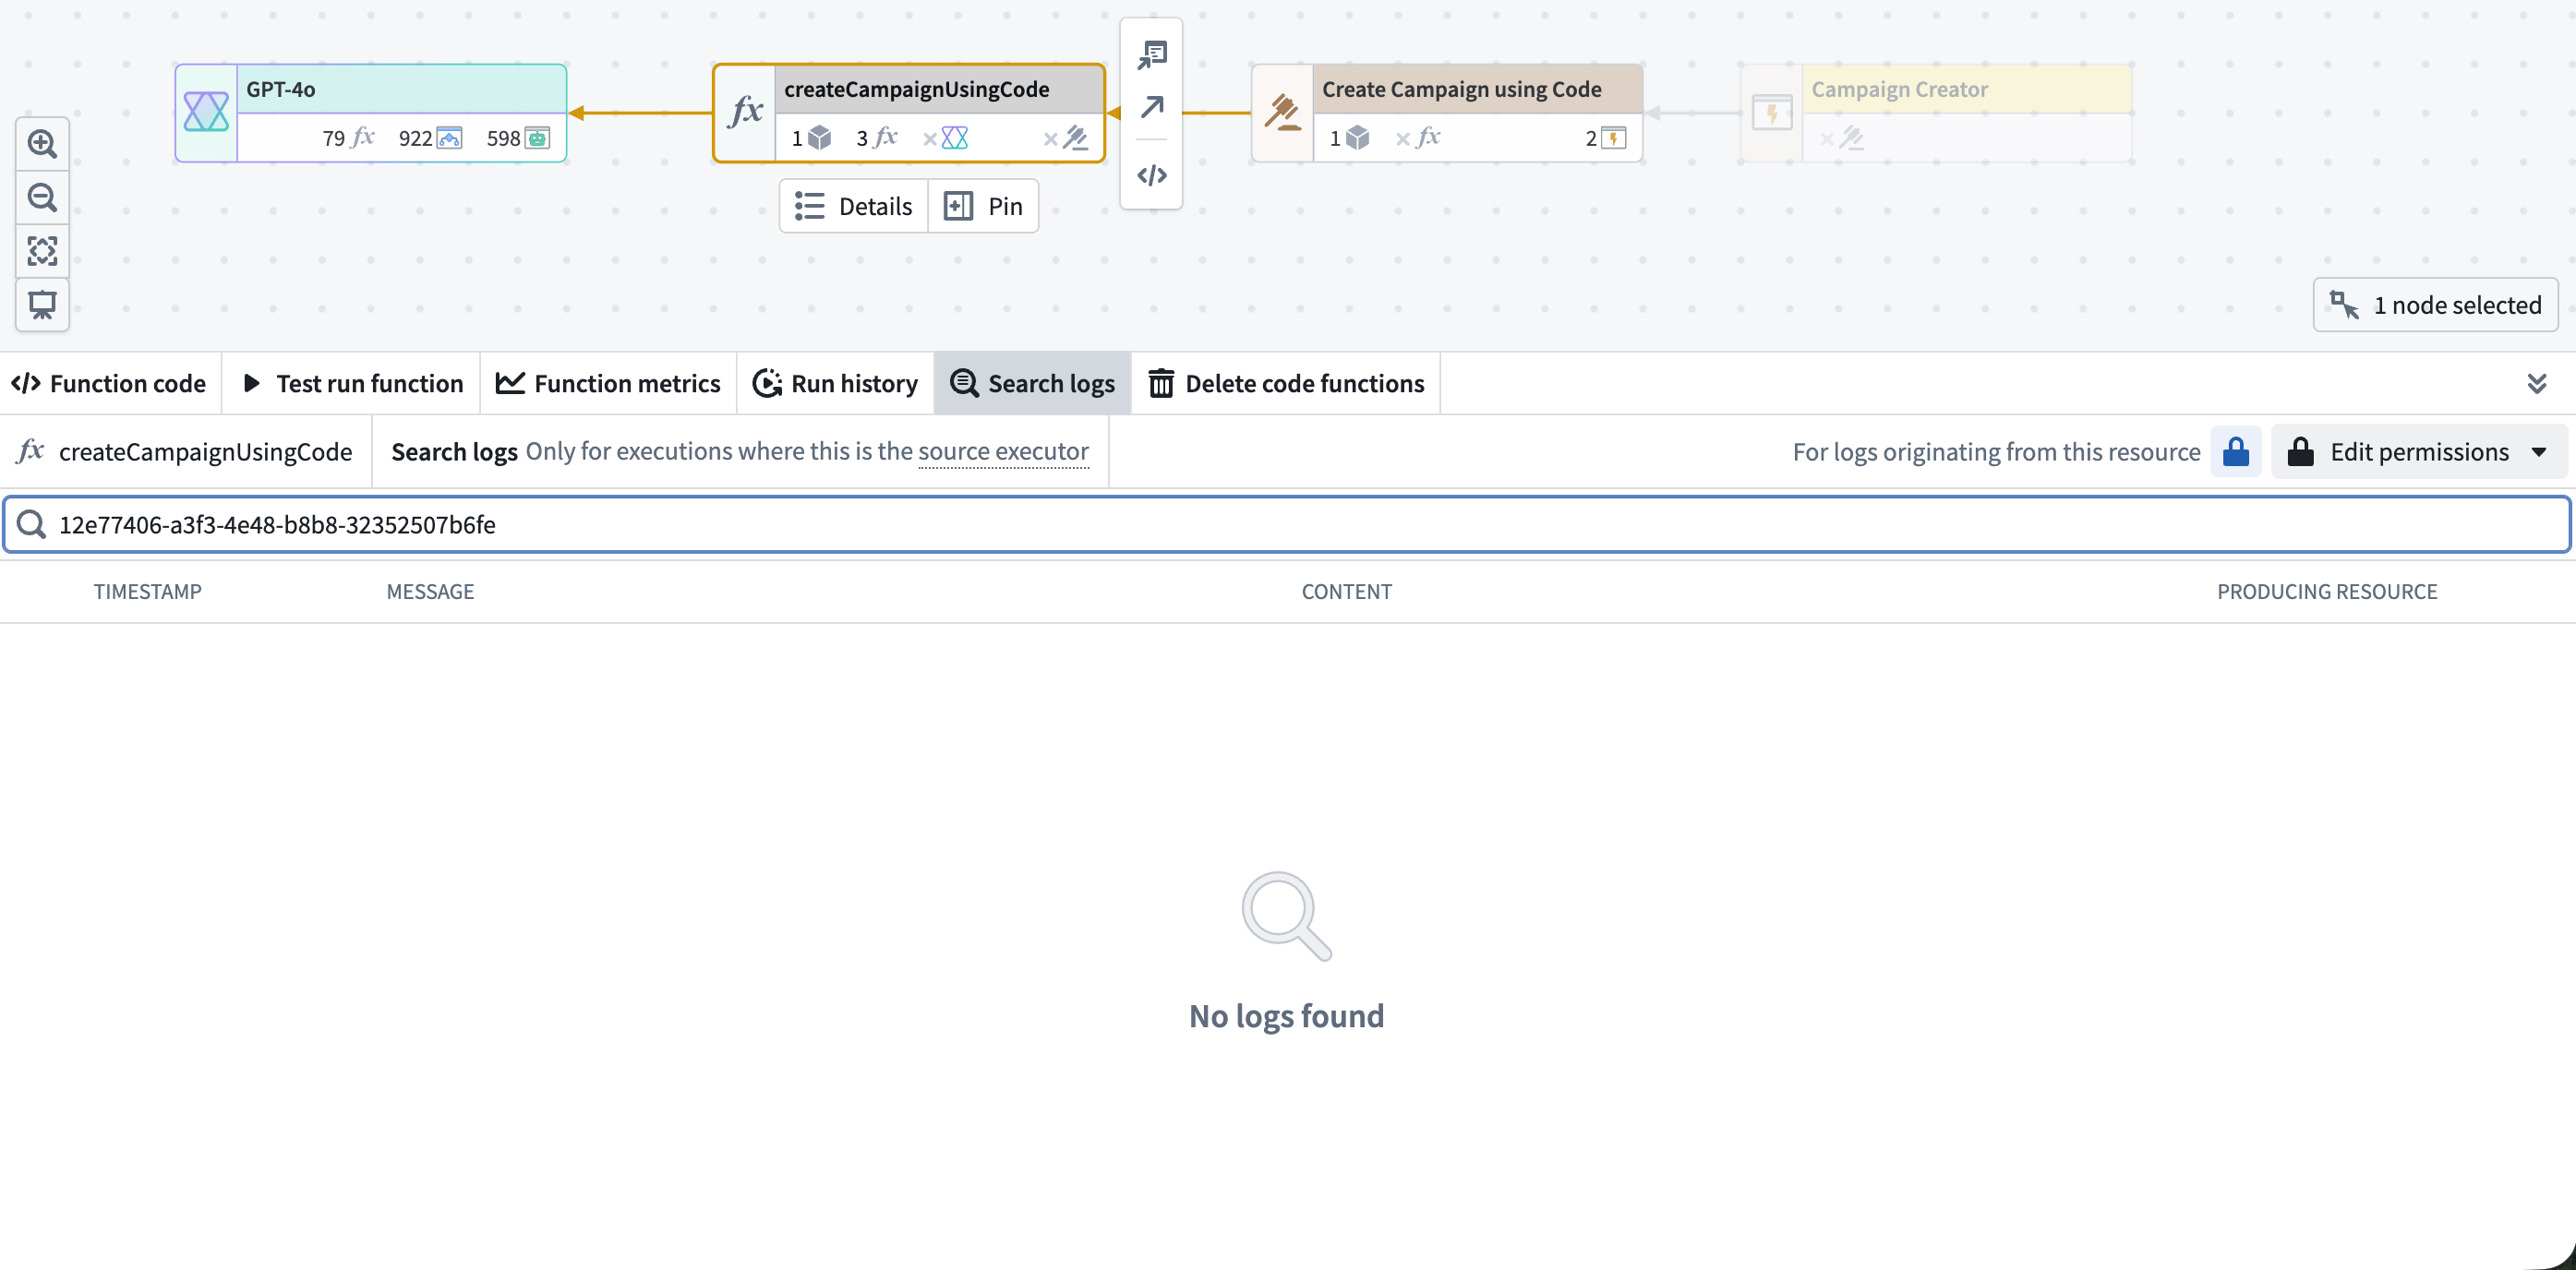
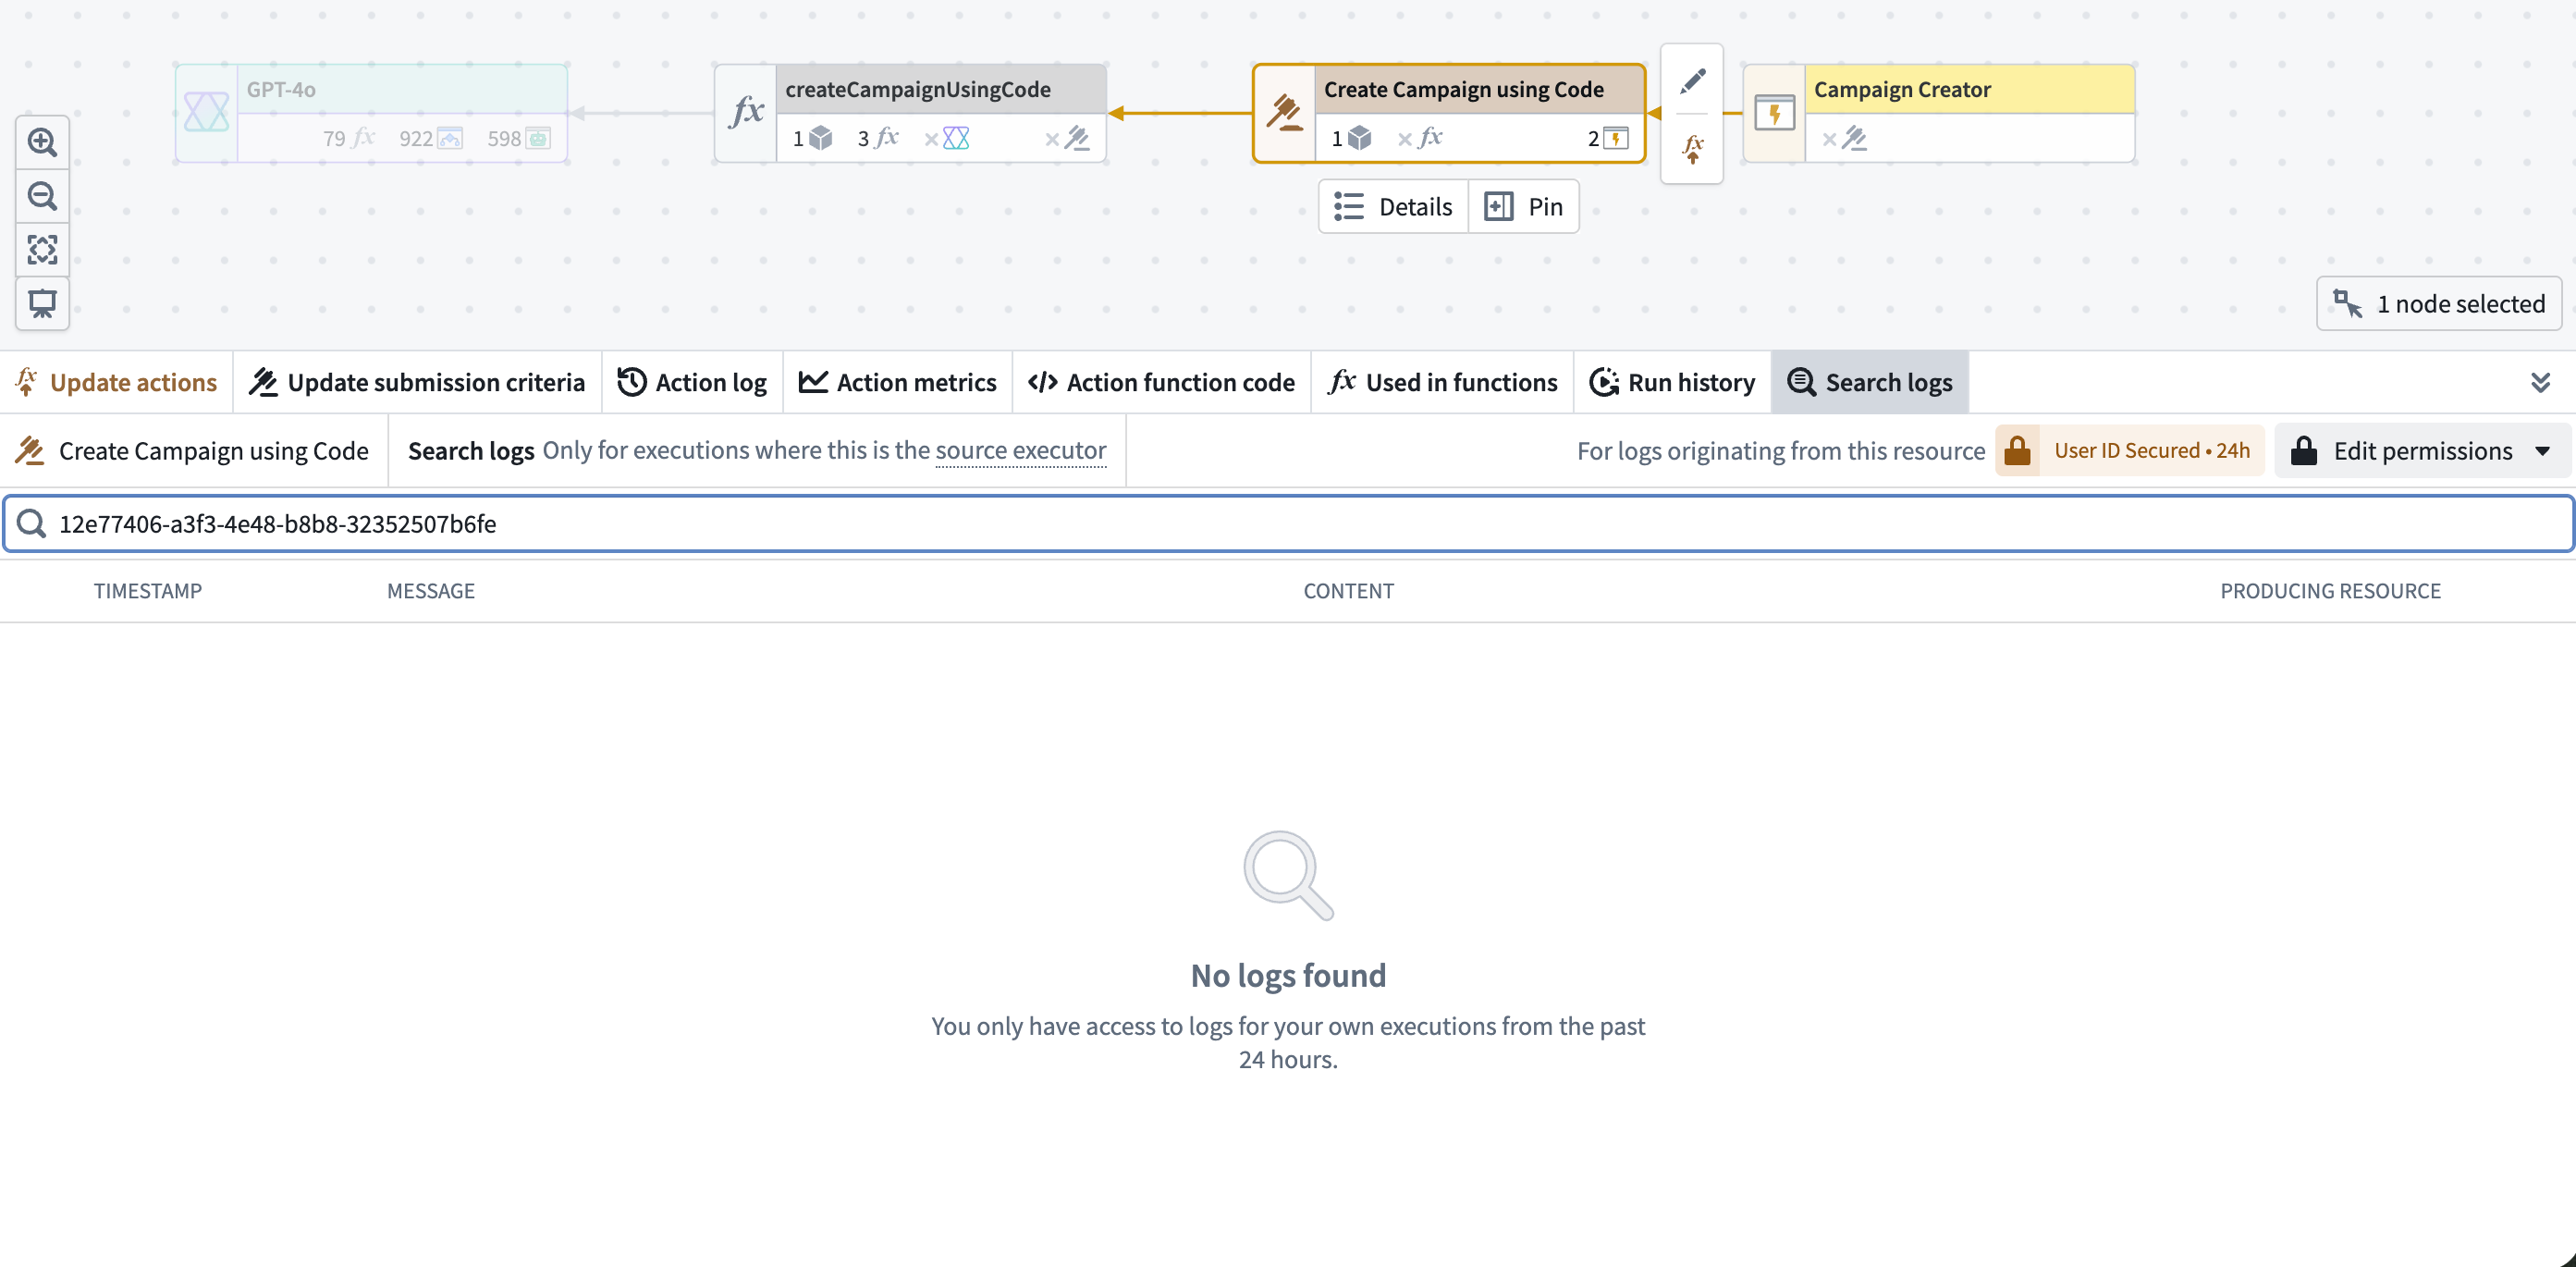
The Search logs tab displays logs for executions where the selected resource is the source executor. Logs from executions where the resource was called by another resource are not included. In the example below, the function produced logs during execution but is not the source executor — it was called by an automation. Searching from the function returns no results; to find these logs, search from the automation node instead.
Source executor suggestions
If no logs are found for the selected resource, the Search logs panel checks whether it was recently called by other source executors and displays them as suggestions. Select a suggested source executor to navigate to that node in the graph and search its logs instead. The panel header also displays an Also recently executed by indicator. You can select this indicator to see and navigate to source executors.
Filter results
The filter sidebar on the left side of the Search logs panel allows you to narrow down log results. Select the filter icon to expand or collapse the sidebar. The following filters are available:
- Log level: Filter logs by severity level. Select a log level from the dropdown to show only logs matching that level. The available levels are
ERROR,FATAL,WARN,INFO,DEBUG, andTRACE. By default, all log levels are shown. - Timestamp range: Restrict results to a specific time window. You can choose from predefined relative ranges such as
Past 1 dayorPast 1 hour, or specify a custom date and time range. The default rangePast one day. The maximum selectable range is 30 days, matching the log retention period. - Producing resource: Filter logs by the resource that produced them. Use this filter when a source executor's call chain includes multiple downstream resources and you want to isolate logs from a specific function, action, automation, AIP logic, or AIP agent. Select the clear button next to the filter to remove the selection.
When multiple filters are active, they are combined with AND logic; only log entries matching all selected filters are returned. Select Reset in the sidebar header to clear all filters and return to the default view.
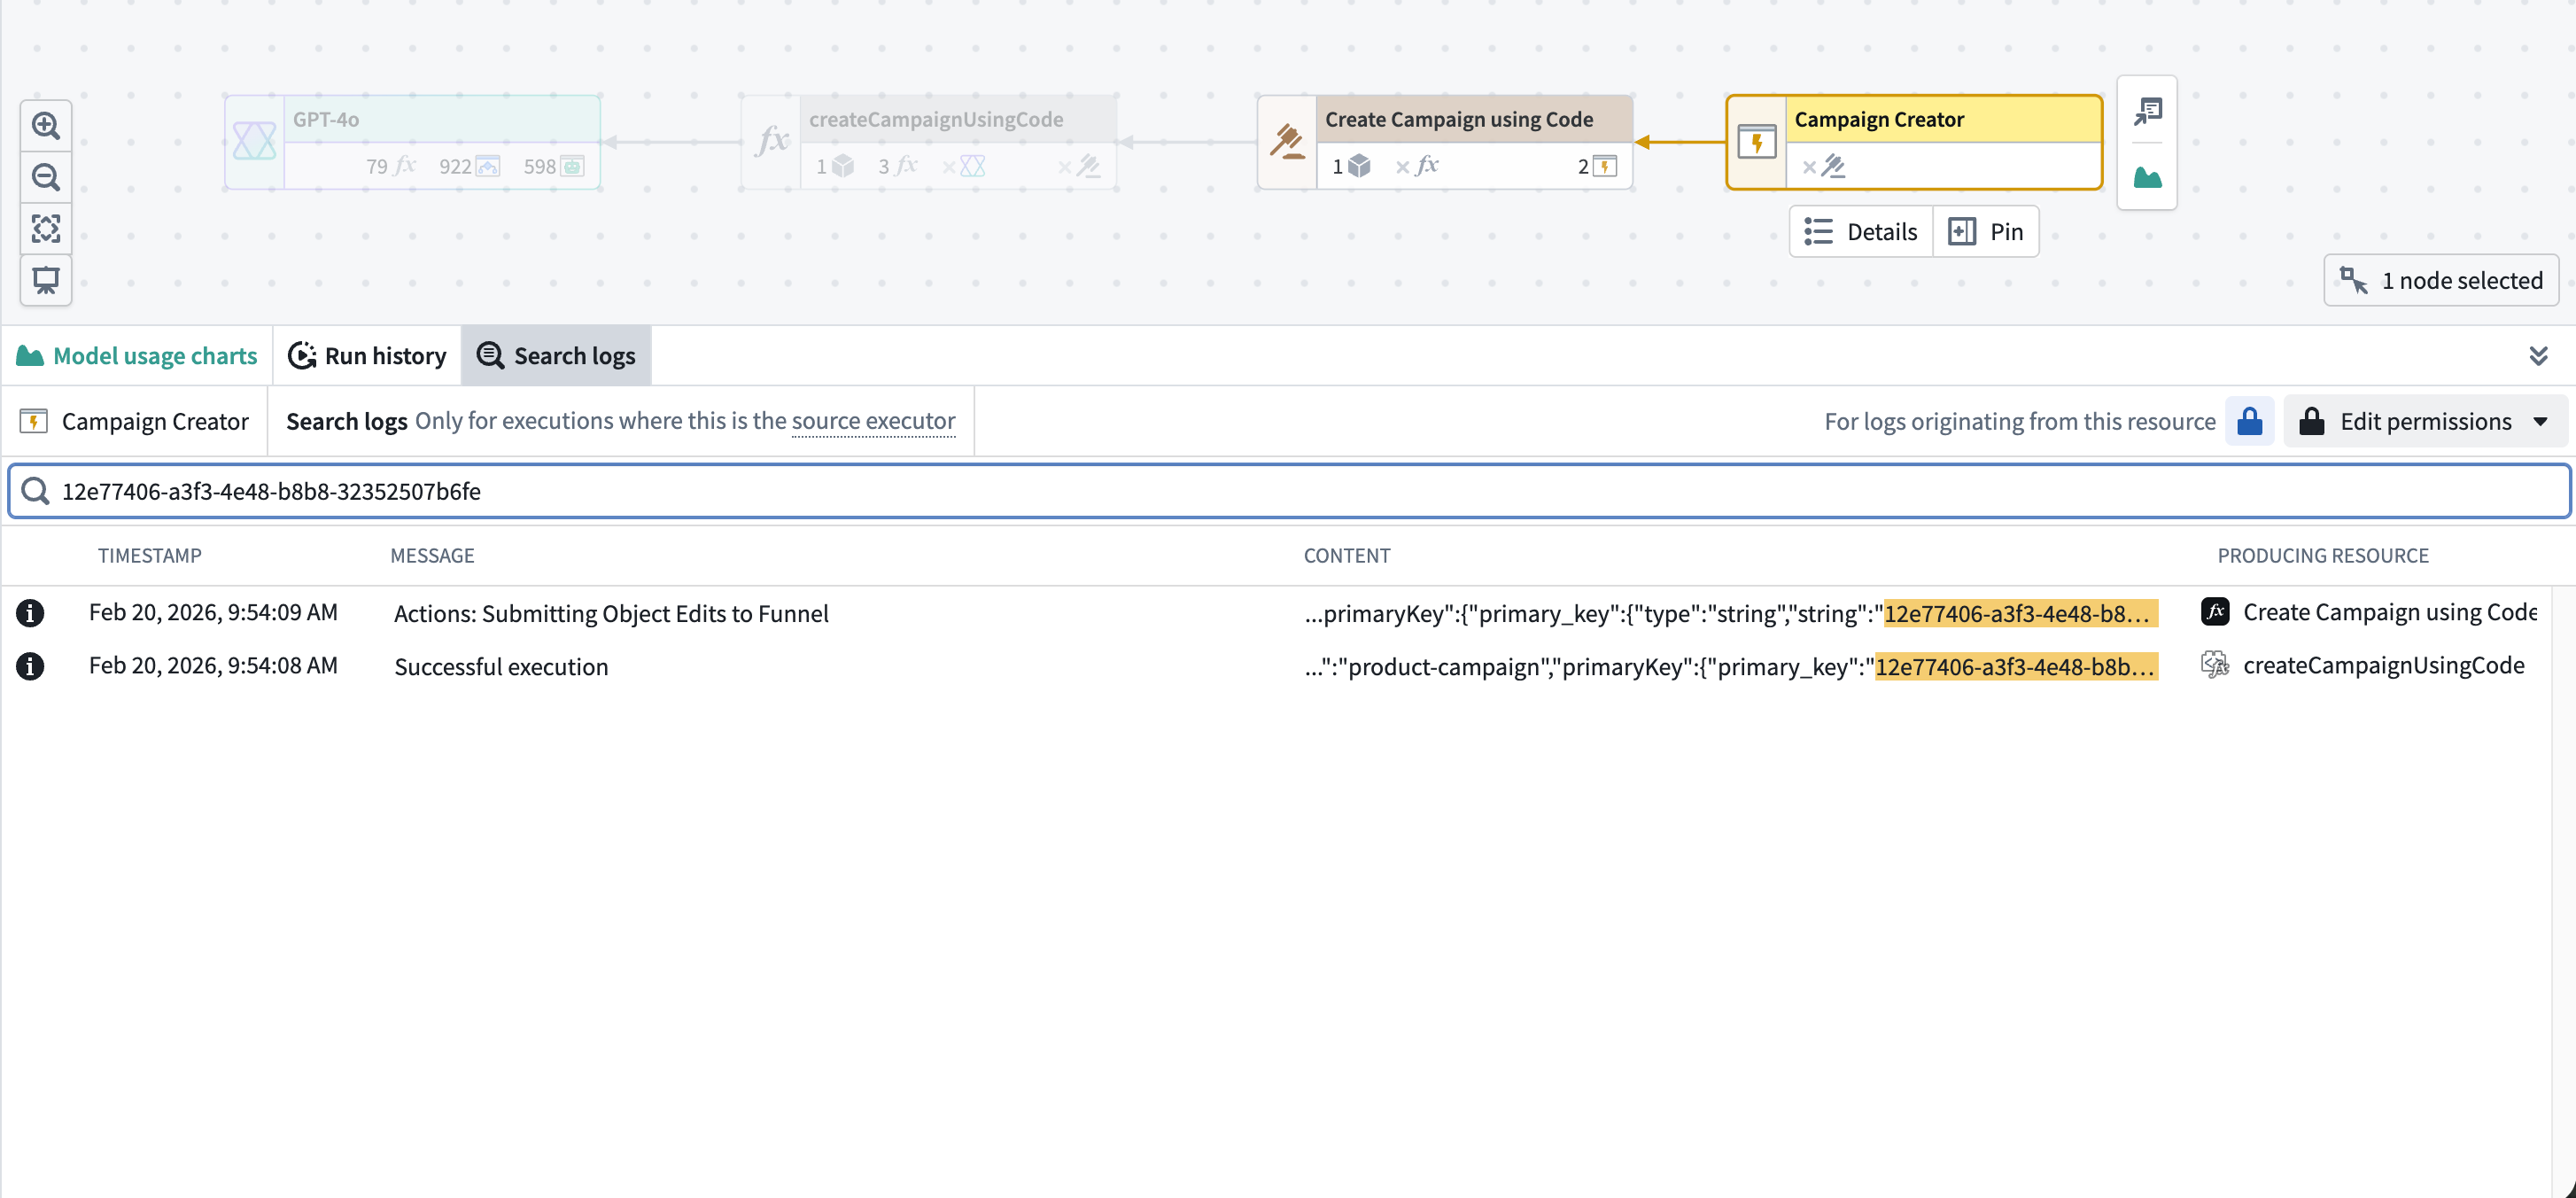
Understanding the results table
Search results are displayed in a table sorted by timestamp, with the most recent logs appearing first. The table includes the following columns:
| Column | Description |
|---|---|
| Log level | A color-coded icon indicating the severity: red for ERROR and FATAL, orange for WARN, and neutral for INFO, DEBUG, and TRACE |
| Timestamp | The date and time the log entry was recorded |
| Message | The primary log message. Select the field to open a detail dialog |
| Content | Additional structured content, often in JSON format. Select the field to open a detail dialog |
| Producing resource | The resource that emitted the log entry |
Matching text from your search query is highlighted in the Message and Content columns.
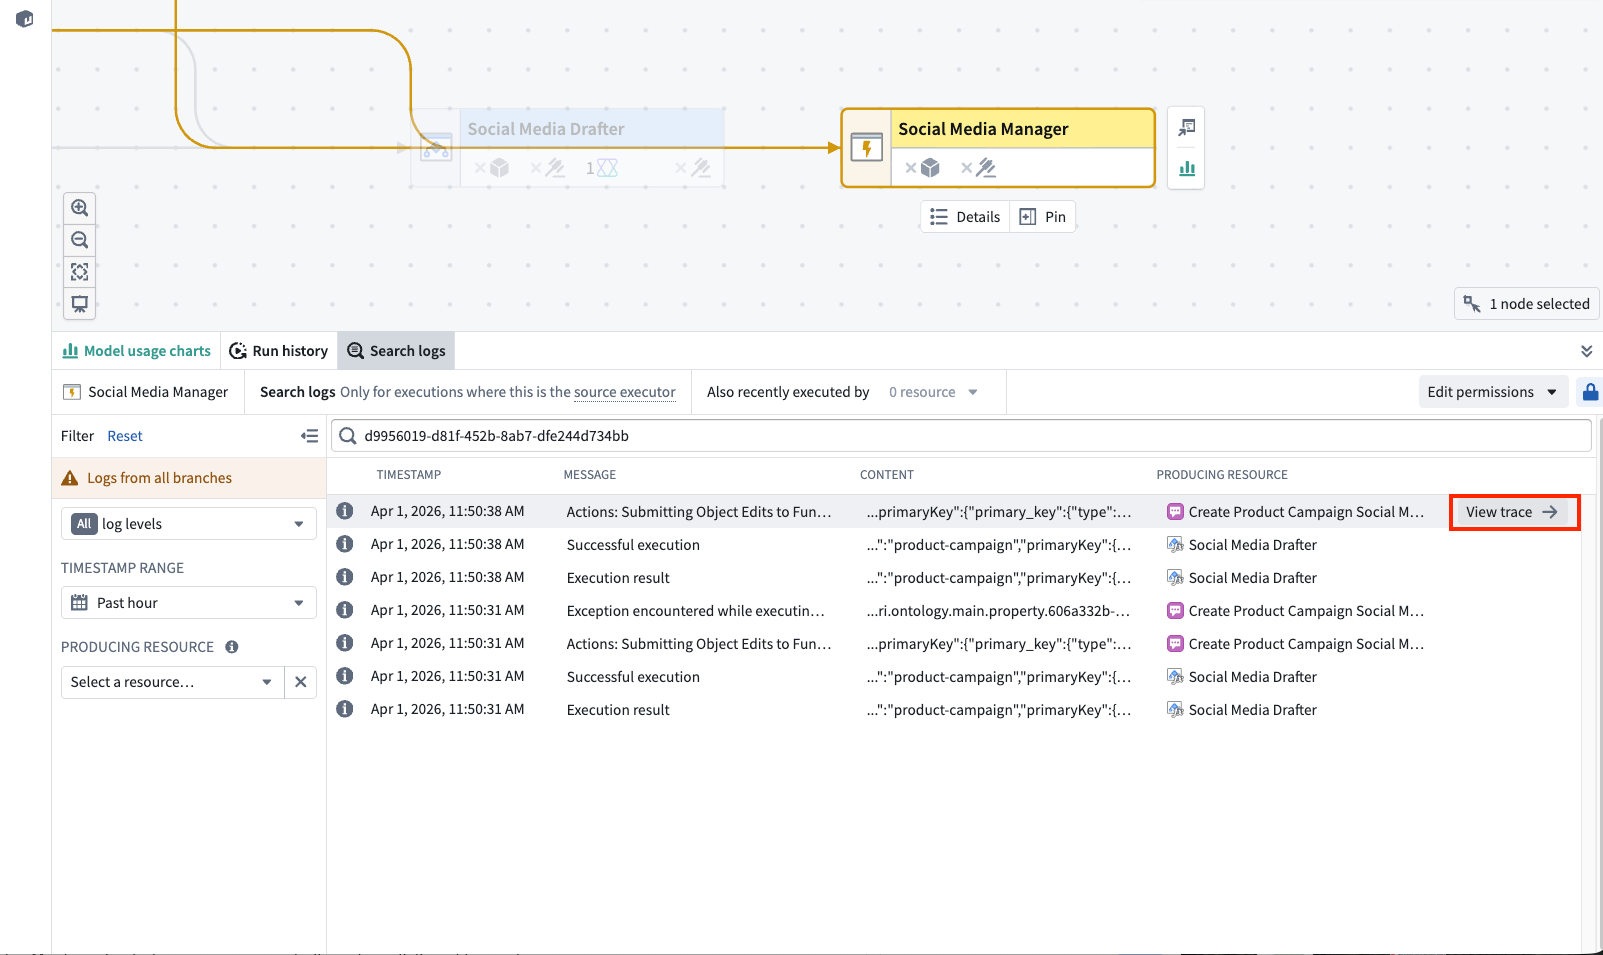
When you hover over a log row, a View trace button appears on the right side of the row. Select this button to open the trace view for the execution that produced that log entry. This allows you to see the full execution timeline and identify where in the call chain the log was emitted.
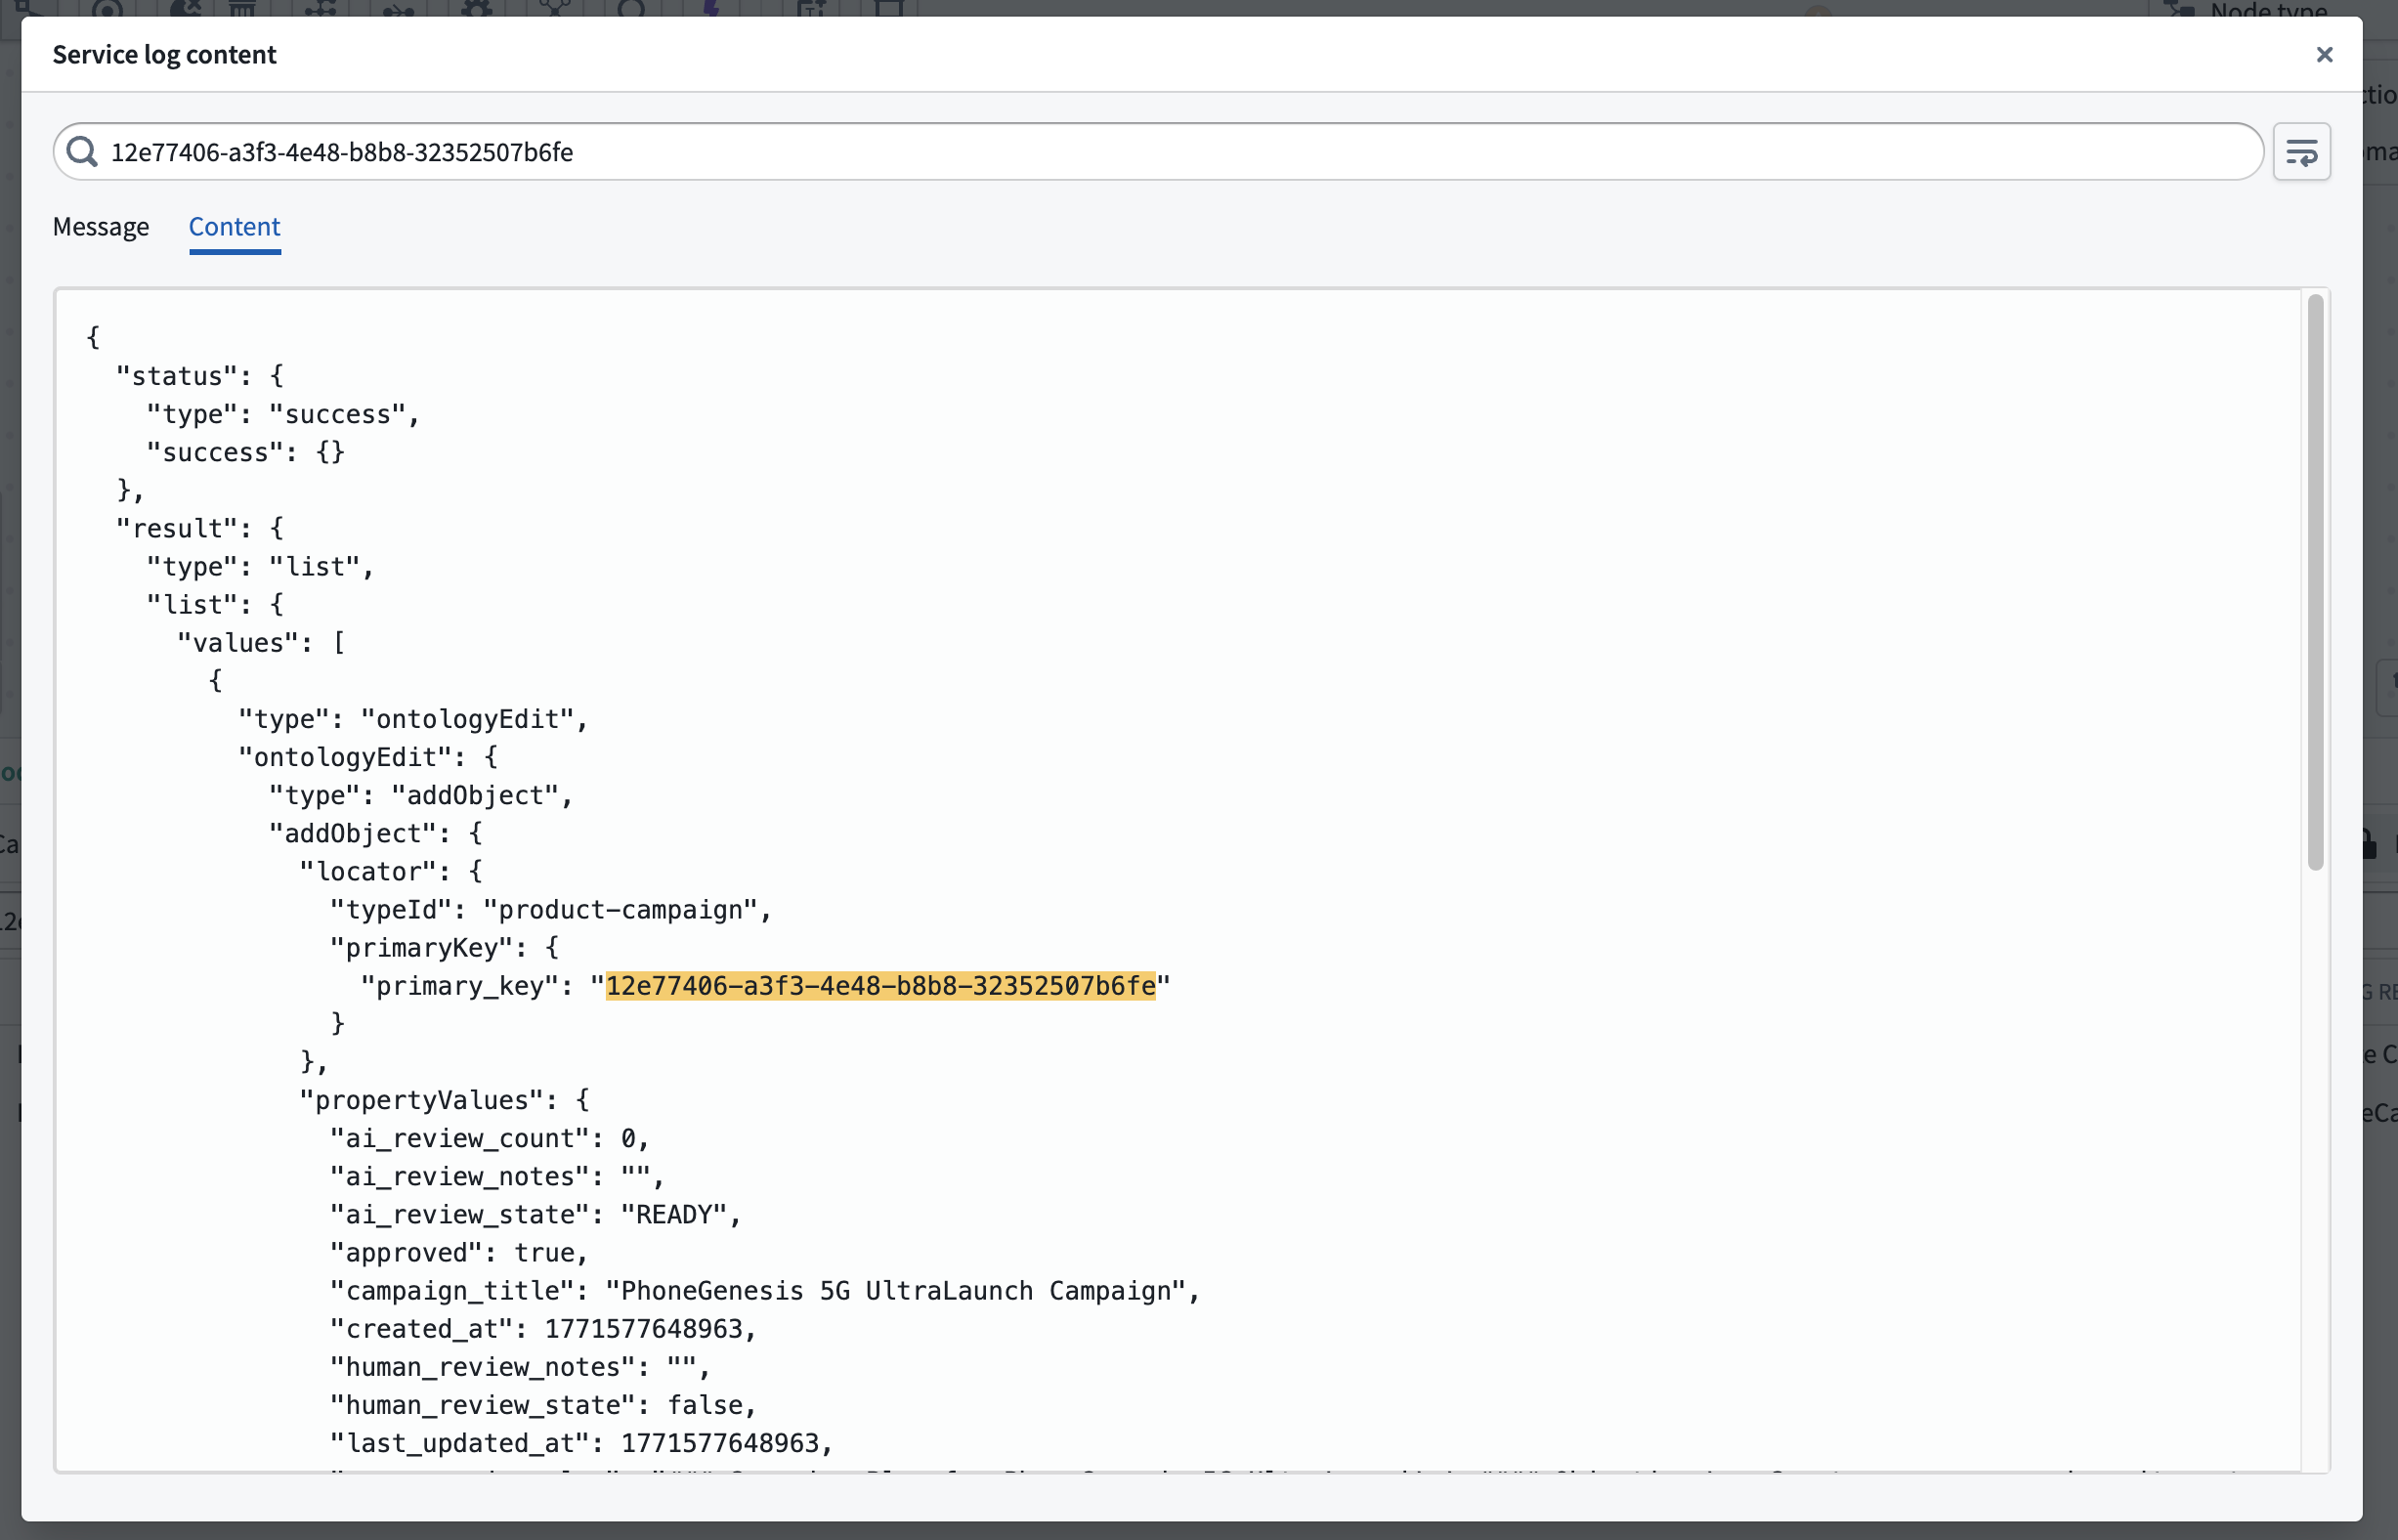
Viewing log details
Select any Message or Content cell to open a detail dialog with the full log entry. The dialog provides:
- Message and Content tabs to switch between the two fields
- A text search bar to find specific content within the log entry
- A Wrap lines toggle for easier reading of long log lines
- Automatic JSON formatting for structured content
Log retention and pagination
Log search covers the most recent 30 days of logs. Logs older than 30 days are automatically deleted and cannot be recovered. Results are loaded in pages of 100 entries. Scroll to the bottom of the table to load additional results. Logs are not streamed live; to view additional logs produced after the initial search, refresh the page.
Permissions
Log search uses the same permission model as execution history. To search logs for a resource, you must have edit permission on the resource. If log access has been enabled for the source executor's project, and you have access to all the necessary markings, you can search logs across all executions. If log access has not been enabled, you can only search logs for your own executions from the past 24 hours, but edit permission on the resource is still required. On CBAC stacks, this self-execution exception does not apply; log access must be enabled to search logs.
For full details on log access configuration, see log permissions.
Related features
- Service logs: View logs for a specific execution
- Execution history: Browse all recent executions for a resource
- Trace views: Visualize the execution timeline and correlate with log data
- Log permissions: Configure who can access logs
中文翻译
日志搜索
工作流血缘中的搜索日志选项卡允许您搜索所选源执行器(source executor)在过去30天内生成的所有服务日志。与按执行查看的服务日志视图不同,日志搜索会聚合来自同一源执行器的所有执行日志,这对于调查重复出现的错误或在多次运行中查找特定日志消息非常有用。
源执行器是调用链中的第一个可执行资源,可以是函数(function)、操作(action)、自动化(automation)、AIP逻辑(AIP logic)或AIP代理(AIP agent)。当函数由其他资源(如AIP逻辑、语言模型或AIP代理)支持时,日志搜索面板会将支持资源显示为源执行器,而非底层函数。
访问日志搜索
要访问日志搜索:
- 打开工作流血缘,导航到包含您资源的工作流。
- 选择一个可执行资源节点。
- 在底部面板中选择搜索日志选项卡。
搜索日志
搜索日志面板顶部的搜索栏接受文本查询。输入搜索词后,结果将填充到结果表中。搜索区分大小写,并匹配完整的日志行,包括消息和内容字段。
您可以使用*作为通配符来匹配任意字符序列。例如:
connection failed匹配包含确切短语"connection failed"的日志行timeout*retry匹配包含"timeout"后跟"retry"且中间有任意字符的日志行Error匹配"Error",但不匹配"error"或"ERROR"
搜索日志选项卡显示所选资源作为源执行器的执行日志。不包括该资源被其他资源调用时的执行日志。在下面的示例中,该函数在执行期间生成了日志,但它不是源执行器——它是由自动化调用的。从该函数搜索不会返回结果;要找到这些日志,请改为从自动化节点搜索。
源执行器建议
如果所选资源未找到日志,搜索日志面板会检查该资源最近是否被其他源执行器调用,并将其显示为建议。选择建议的源执行器可导航到图中的该节点并搜索其日志。面板标题还会显示最近也被执行于指示器。您可以选择此指示器来查看并导航到源执行器。
筛选结果
搜索日志面板左侧的筛选侧边栏允许您缩小日志结果范围。选择筛选图标可展开或折叠侧边栏。可用的筛选条件包括:
- 日志级别: 按严重级别筛选日志。从下拉菜单中选择一个日志级别,仅显示匹配该级别的日志。可用的级别有
ERROR、FATAL、WARN、INFO、DEBUG和TRACE。默认显示所有日志级别。 - 时间戳范围: 将结果限制在特定的时间窗口内。您可以选择预定义的相对范围,如
过去1天或过去1小时,或指定自定义日期和时间范围。默认范围为过去一天。最大可选范围为30天,与日志保留期限一致。 - 生成资源: 按生成日志的资源进行筛选。当源执行器的调用链包含多个下游资源,且您希望隔离特定函数、操作、自动化、AIP逻辑或AIP代理的日志时,可使用此筛选条件。选择筛选条件旁的清除按钮可移除选择。
当多个筛选条件同时激活时,它们使用AND逻辑组合;仅返回匹配所有选定筛选条件的日志条目。选择侧边栏标题中的重置可清除所有筛选条件并返回默认视图。
理解结果表
搜索结果按时间戳排序显示在表中,最近的日志显示在最前面。表包含以下列:
| 列 | 描述 |
|---|---|
| 日志级别 | 颜色编码图标表示严重级别:红色表示ERROR和FATAL,橙色表示WARN,中性色表示INFO、DEBUG和TRACE |
| 时间戳 | 日志条目记录的日期和时间 |
| 消息 | 主要日志消息。选择该字段可打开详情对话框 |
| 内容 | 附加的结构化内容,通常为JSON格式。选择该字段可打开详情对话框 |
| 生成资源 | 发出日志条目的资源 |
搜索查询中的匹配文本在消息和内容列中高亮显示。
当您悬停在日志行上时,该行右侧会出现一个查看追踪按钮。选择此按钮可打开生成该日志条目的执行的追踪视图。这使您能够查看完整的执行时间线,并确定日志在调用链中的发出位置。
查看日志详情
选择任意消息或内容单元格可打开包含完整日志条目的详情对话框。该对话框提供:
- 消息和内容选项卡,可在两个字段之间切换
- 文本搜索栏,可在日志条目中查找特定内容
- 自动换行开关,便于阅读长日志行
- 结构化内容的自动JSON格式化
日志保留与分页
日志搜索涵盖最近30天的日志。超过30天的日志会自动删除且无法恢复。结果按每页100条加载。滚动到表格底部可加载更多结果。日志不会实时流式传输;要查看初始搜索后产生的其他日志,请刷新页面。
权限
日志搜索使用与执行历史相同的权限模型。要搜索资源的日志,您必须对该资源拥有编辑权限。如果已为源执行器的项目启用日志访问权限,并且您拥有所有必要的标记访问权限,则可以搜索所有执行的日志。如果未启用日志访问权限,您只能搜索过去24小时内自己执行的日志,但仍需对该资源拥有编辑权限。在CBAC堆栈上,此自我执行例外不适用;必须启用日志访问权限才能搜索日志。
有关日志访问配置的完整详情,请参阅日志权限。