Metrics(指标)
Foundry provides near real-time metrics for functions, actions, and AIP Logic resources. You can access these metrics through Ontology Manager or in Workflow Lineage by selecting the resource node for a given execution. These metrics give you visibility into the health and performance of your Ontology and AIP workflows over the last 30 days.
Available metrics
The following metrics are available for each resource type:
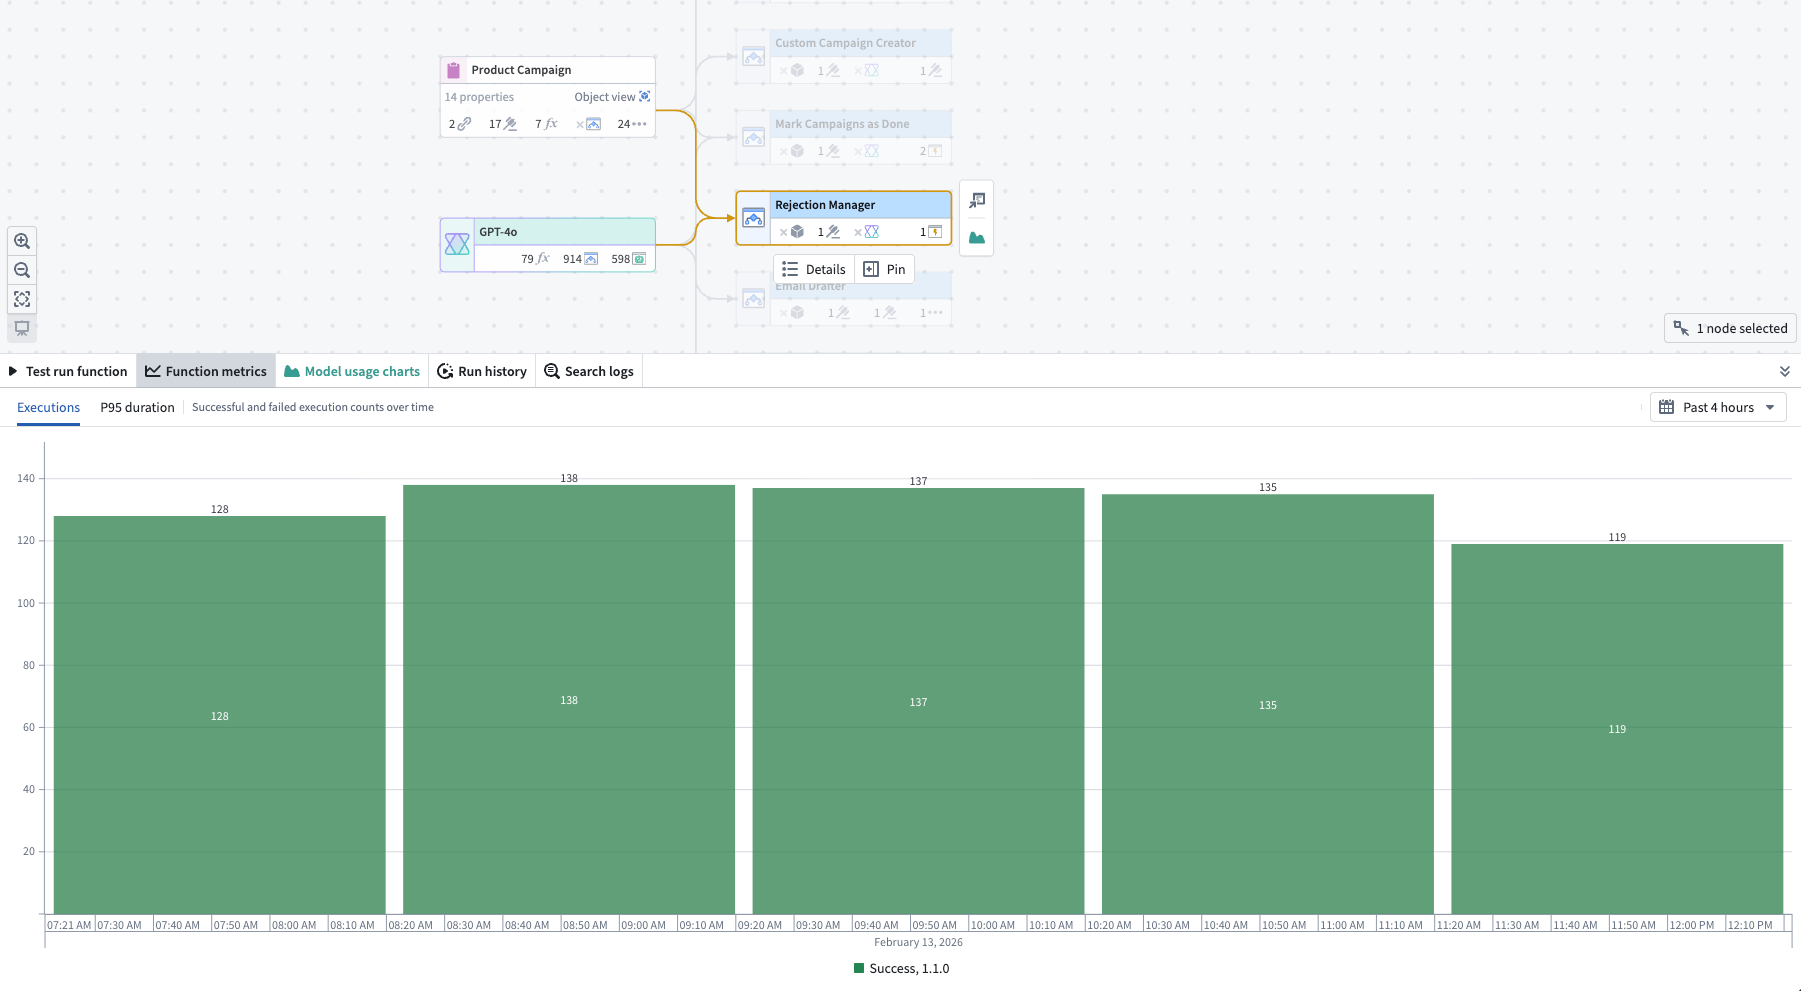
- Success/failure metrics: Monitor the current status of your executions with success and failure counts. This enables rapid identification of issues and supports proactive troubleshooting.
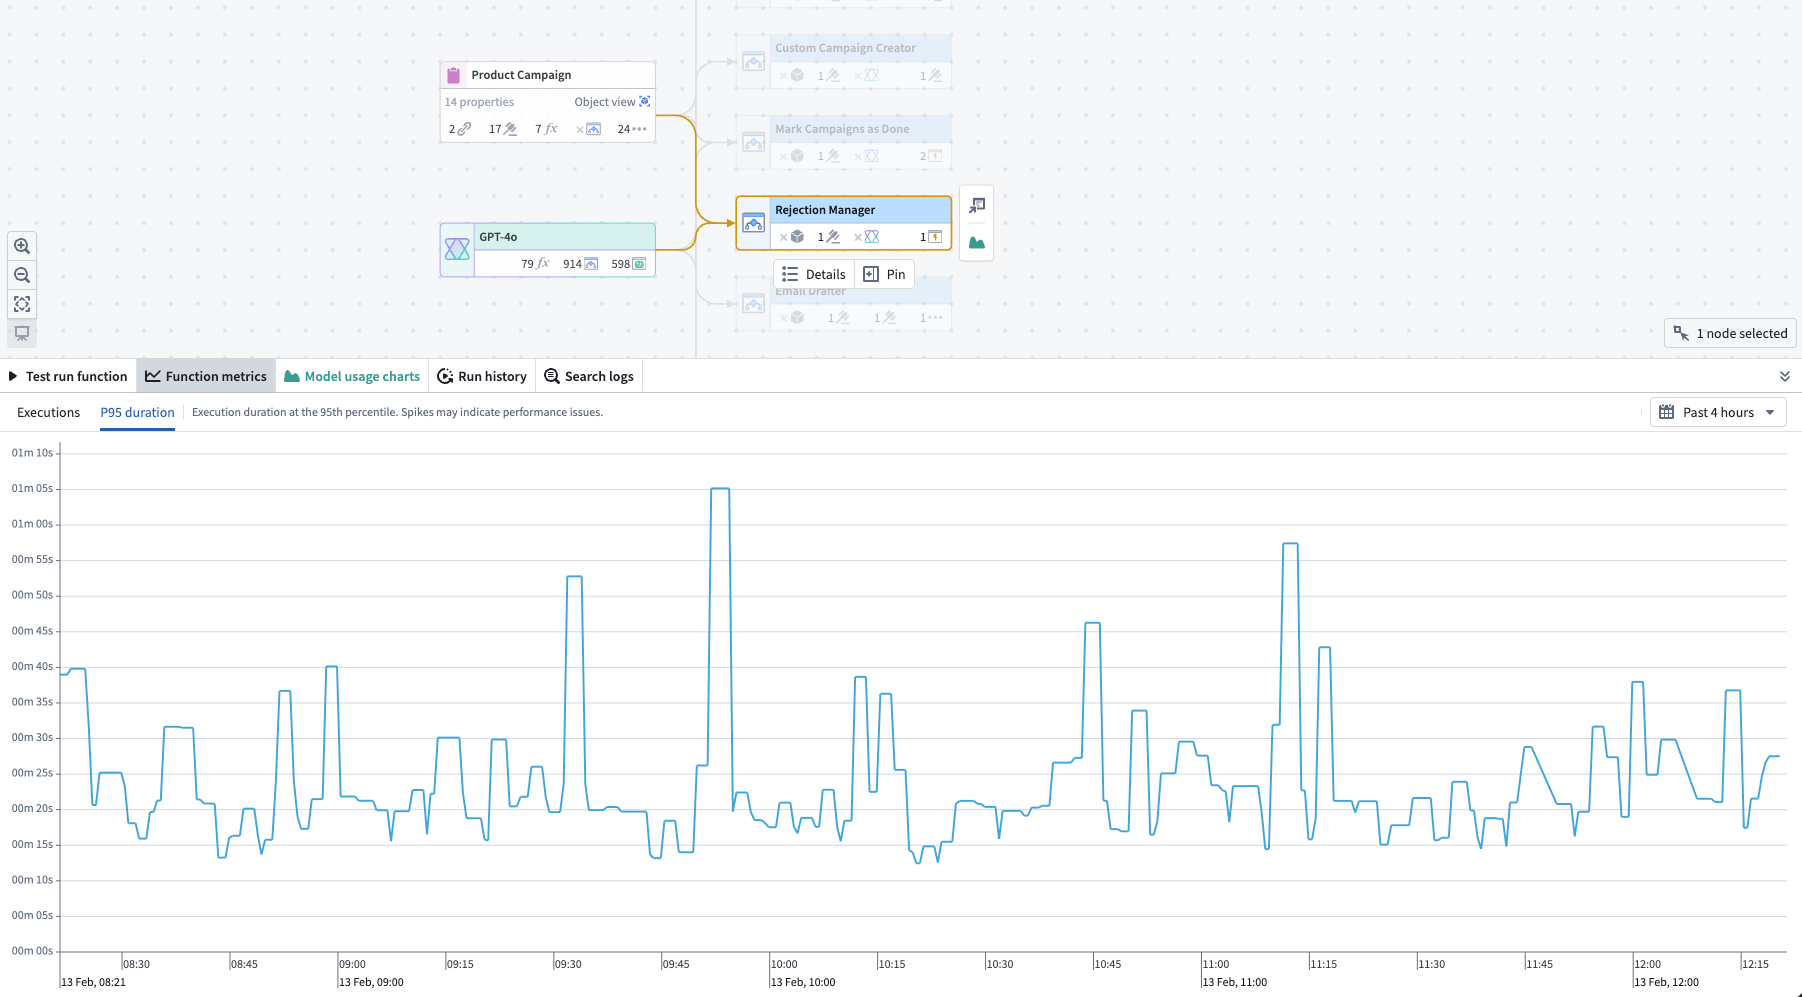
- P95 duration metric: Track the 95th percentile (P95) execution duration. This metric highlights the upper range of execution times, helping you detect performance bottlenecks and optimize workflows.
All metrics are updated in near real-time using the latest data from the Foundry Telemetry Service (FTS).
Resource-specific metrics
Each resource type has its own metrics page with details on available failure categories and how to access metrics:
Permissions
To view metrics, you must be a viewer on the resource. For more details, see the log permissions page.
Related resources
- Execution history: View a complete history of executions over the past 30 days.
- Function monitoring: Set up alerts for function performance and failure rates.
- Action monitoring: Configure monitoring rules for action performance and reliability.
中文翻译
指标
Foundry 为函数(Function)、操作(Action)和 AIP Logic 资源提供近实时指标。您可以通过本体管理器(Ontology Manager)或工作流血缘(Workflow Lineage)选择特定执行的资源节点来访问这些指标。这些指标让您能够了解本体(Ontology)和 AIP 工作流在过去 30 天内的运行状况和性能表现。
可用指标
每种资源类型均提供以下指标:
- 成功/失败指标: 通过成功和失败次数监控执行的当前状态。这有助于快速识别问题并支持主动排查。
- P95 耗时指标: 追踪第 95 百分位(P95)的执行耗时。该指标突出显示执行时间的上限范围,帮助您检测性能瓶颈并优化工作流。
所有指标均使用来自 Foundry 遥测服务(Foundry Telemetry Service, FTS)的最新数据,以近实时方式更新。
资源特定指标
每种资源类型都有独立的指标页面,详细说明可用的失败类别以及如何访问指标:
权限
要查看指标,您必须拥有资源的 viewer 权限。更多详情,请参阅日志权限(Log permissions)页面。
相关资源
- 执行历史(Execution history): 查看过去 30 天的完整执行历史记录。
- 函数监控(Function monitoring): 为函数性能和失败率设置告警。
- 操作监控(Action monitoring): 配置操作性能和可靠性的监控规则。