AIP observability(AIP 可观测性(AIP observability))
AIP observability features provide visibility into your AIP and Ontology workflow executions through metrics, tracing, logs, and execution history. As part of a comprehensive observability strategy across the platform, these features are integrated into Workflow Lineage to enable cross-functional teams to monitor and optimize performance at every level of the applications, workflows, and products built with AIP and the Ontology.
Key capabilities of AIP observability
- Metrics: Monitor near real-time success/failure counts and P95 execution duration for functions, actions, and AIP Logic.
- Execution history: Track functions, actions, automations, and AIP Logic executions over the past 30 days.
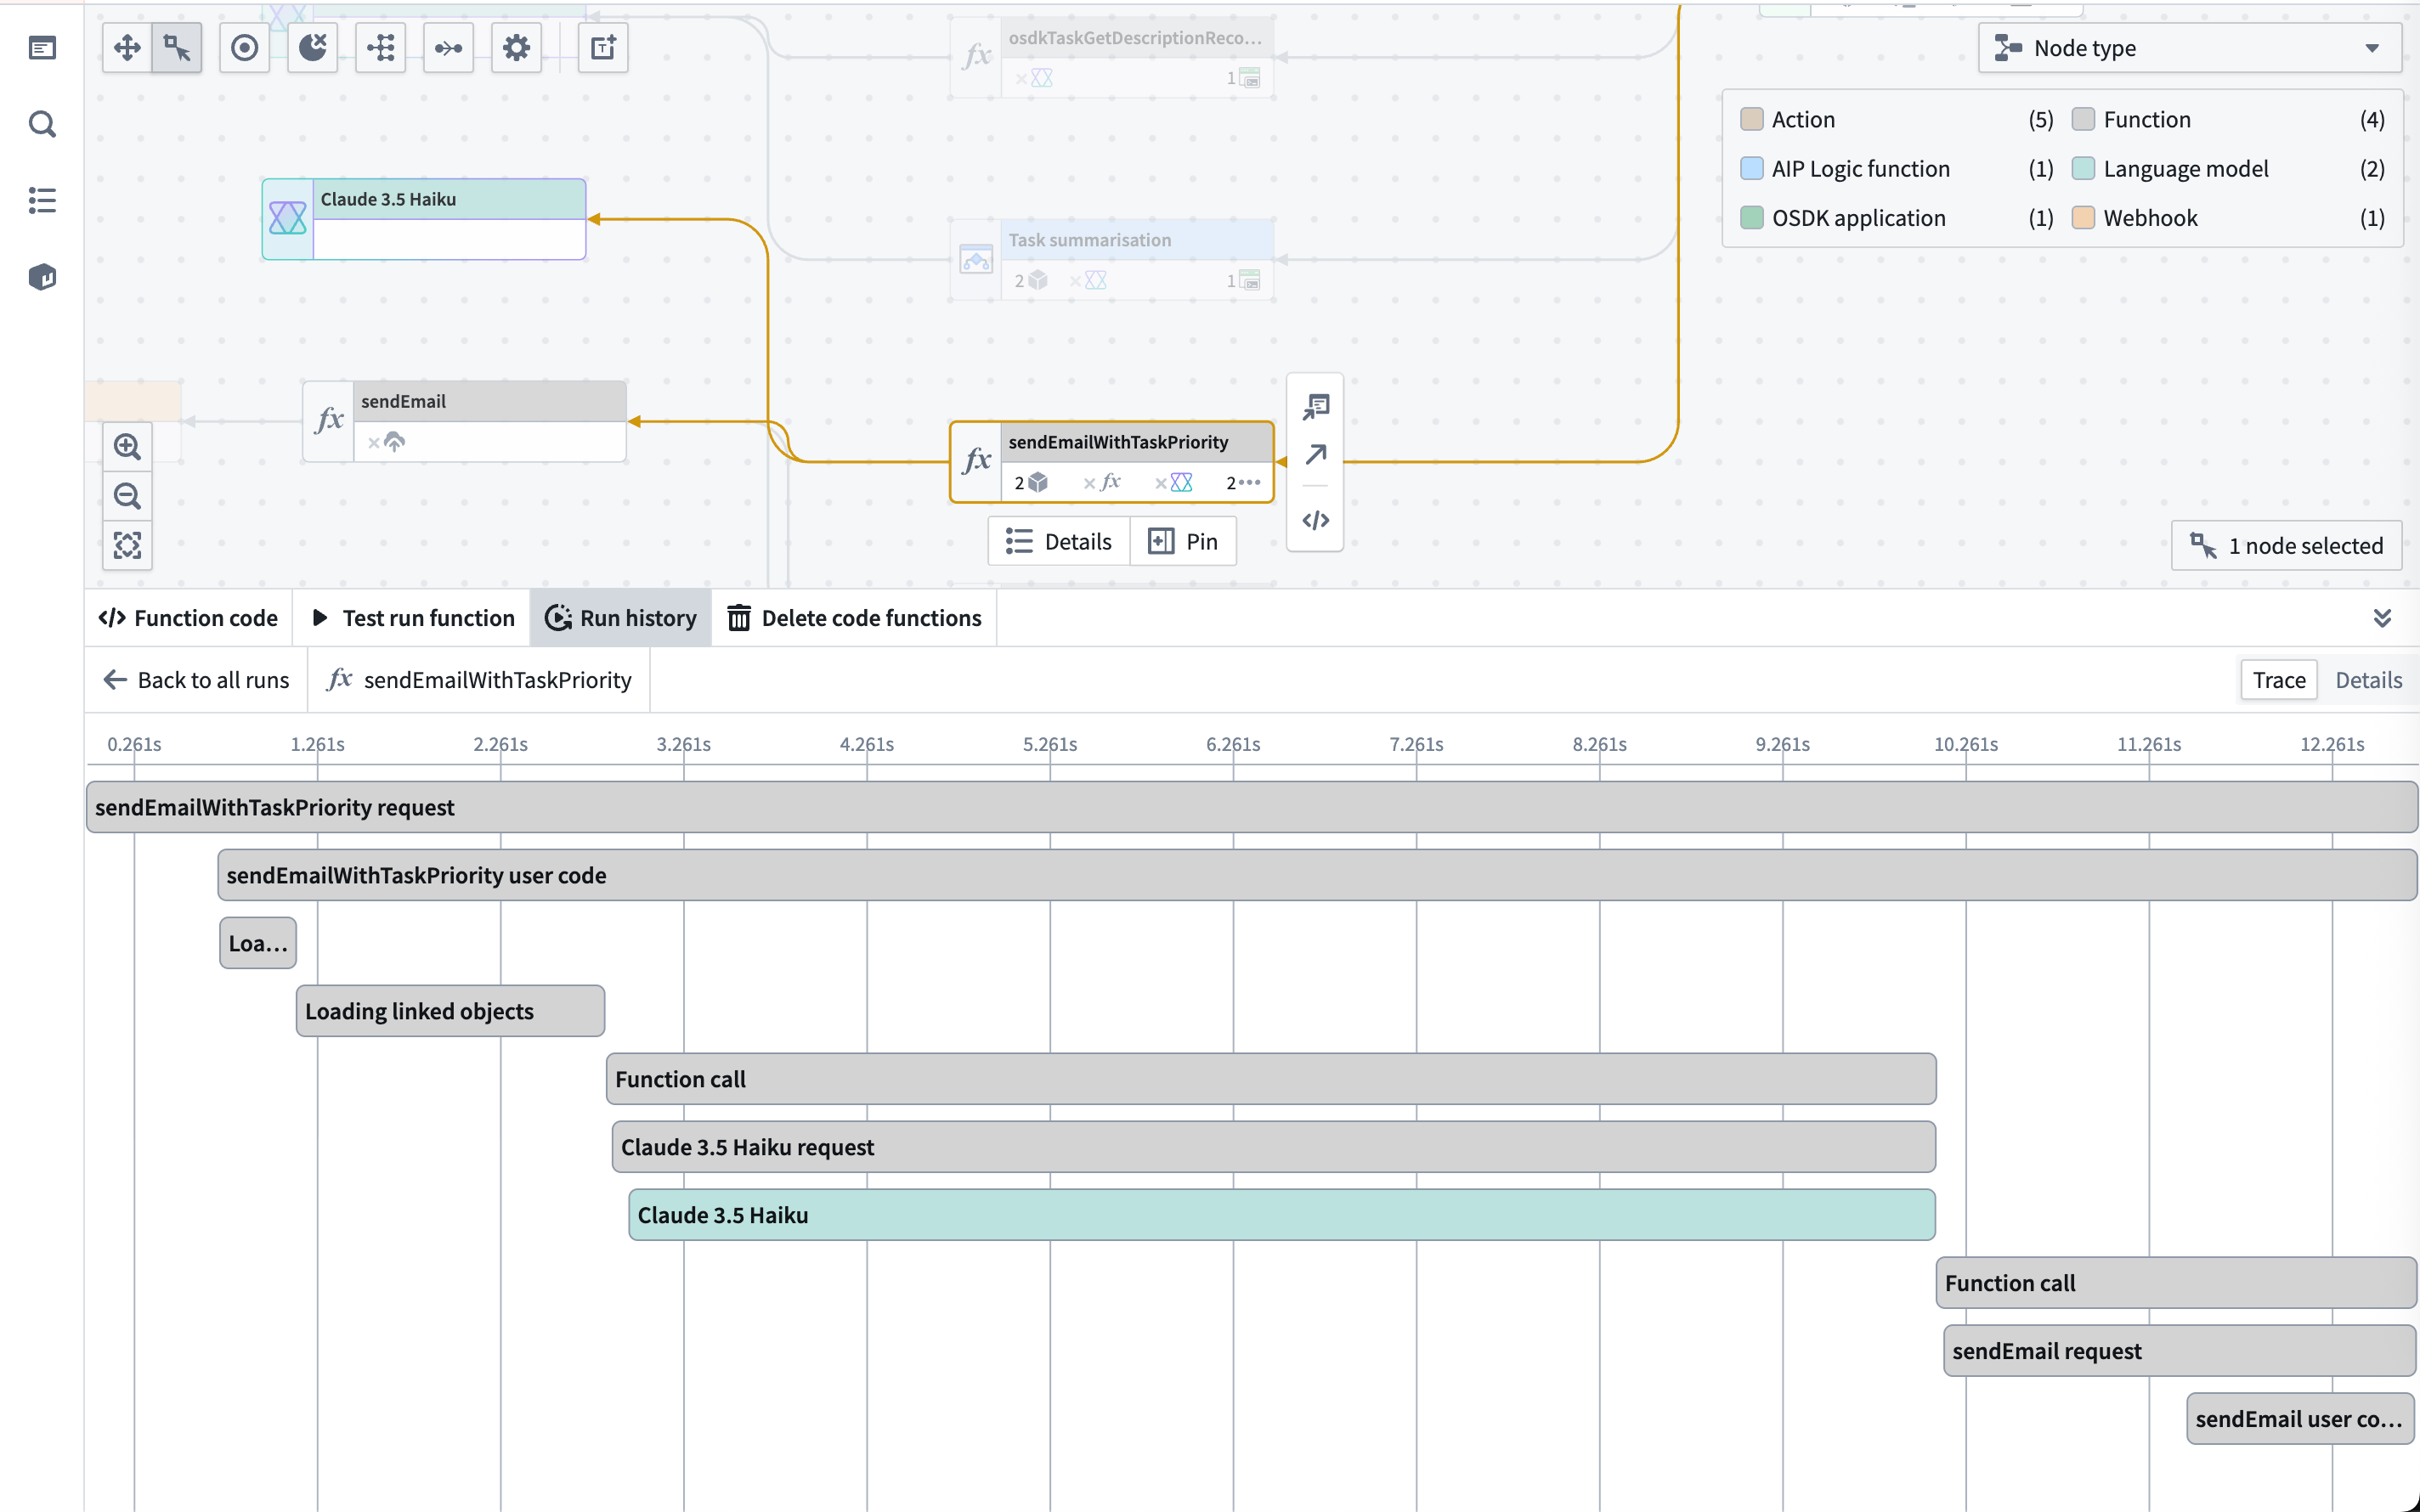
- Distributed tracing: Visualize the complete execution flow across functions, actions, language models, automations, and ontology loads.
- Logging and debugging: Access service logs, custom function log messages, token usage, prompts, error details, and more.
- Log search: Search across all service logs for a source executor to find specific log messages, errors, or patterns across multiple executions.
- Performance monitoring: Identify bottlenecks and optimize execution times.
- Log export to Foundry streaming dataset: Have your logs exported to a streaming dataset and perform complex analysis on your telemetry.
Getting started with AIP observability
To use AIP observability:
- Navigate to a function, action, or automation in Workflow Lineage.
- Select the Run history tab to view recent executions.
- Choose View log details on any execution to access traces and logs.
- Ensure proper log permissions are configured for your resources.
Observability across the platform
AIP observability integrates with the rest of the Palantir platform to provide insight into all of your Ontology and AIP workflows, even if AIP is not enabled on your enrollment. The following tools work together to provide comprehensive visibility into your systems, from individual function execution to platform-wide resource consumption.
Monitoring performance and optimization
- Function instrumentation: Overview of the tools to instrument functions in production.
- Function monitoring: Set up alerts for function performance and failure rates.
- Action metrics: Analyze action execution patterns and performance.
- Action monitoring: Configure monitoring rules to track action performance and reliability.
- Model instrumentation: Overview of the tools to instrument models in production.
Monitoring resource usage and costs
- AIP usage metrics: Model usage coloring and charts for tracking token usage and model requests.
- Logic compute usage: Track compute consumption in AIP Logic applications.
- AIP compute usage: Understand compute allocation and usage across AIP features.
Monitoring model performance
- AIP Evals: Evaluate and monitor LLM performance systematically.
中文翻译
AIP 可观测性(AIP observability)
AIP 可观测性功能通过指标、追踪、日志和执行历史,为您提供对 AIP 和本体论(Ontology)工作流执行的可见性。作为平台整体可观测性策略的一部分,这些功能已集成到工作流沿袭(Workflow Lineage)中,使跨职能团队能够监控和优化基于 AIP 和本体论构建的应用程序、工作流和产品在各个层面的性能。
AIP 可观测性的关键能力
- 指标(Metrics): 近乎实时地监控函数、操作和 AIP 逻辑的成功/失败次数以及 P95 执行时长。
- 执行历史(Execution history): 追踪过去 30 天内函数、操作、自动化和 AIP 逻辑的执行情况。
- 分布式追踪(Distributed tracing): 可视化展示函数、操作、语言模型、自动化和本体论加载的完整执行流程。
- 日志记录与调试(Logging and debugging): 访问服务日志、自定义函数日志消息、令牌用量、提示词、错误详情等信息。
- 日志搜索(Log search): 跨源执行器的所有服务日志进行搜索,以查找特定日志消息、错误或跨多次执行的模式。
- 性能监控(Performance monitoring): 识别瓶颈并优化执行时间。
- 日志导出至 Foundry 流式数据集(Log export to Foundry streaming dataset): 将日志导出到流式数据集,并对遥测数据执行复杂分析。
AIP 可观测性入门
要使用 AIP 可观测性:
- 在工作流沿袭(Workflow Lineage)中导航至某个函数、操作或自动化。
- 选择 运行历史(Run history) 选项卡以查看最近的执行记录。
- 在任何执行记录上选择 查看日志详情(View log details),以访问追踪和日志。
- 确保为您的资源配置了适当的日志权限(Log permissions)。
平台层面的可观测性
AIP 可观测性与 Palantir 平台的其余部分集成,为您所有的本体论和 AIP 工作流提供洞察,即使您的注册环境中未启用 AIP 功能。以下工具协同工作,为您的系统提供从单个函数执行到平台级资源消耗的全面可见性。
监控性能与优化
- 函数仪表化(Function instrumentation): 用于在生产环境中对函数进行仪表化的工具概述。
- 函数监控(Function monitoring): 为函数性能和失败率设置告警。
- 操作指标(Action metrics): 分析操作执行模式与性能。
- 操作监控(Action monitoring): 配置监控规则以追踪操作性能和可靠性。
- 模型仪表化(Model instrumentation): 用于在生产环境中对模型进行仪表化的工具概述。
监控资源使用与成本
- AIP 使用量指标(AIP usage metrics): 用于追踪令牌用量和模型请求的模型使用量着色与图表。
- 逻辑计算用量(Logic compute usage): 追踪 AIP 逻辑应用程序中的计算消耗。
- AIP 计算用量(AIP compute usage): 了解 AIP 功能中的计算分配与使用情况。
监控模型性能
- AIP 评估(AIP Evals): 系统性地评估和监控大语言模型(LLM)性能。