Run history(运行历史)
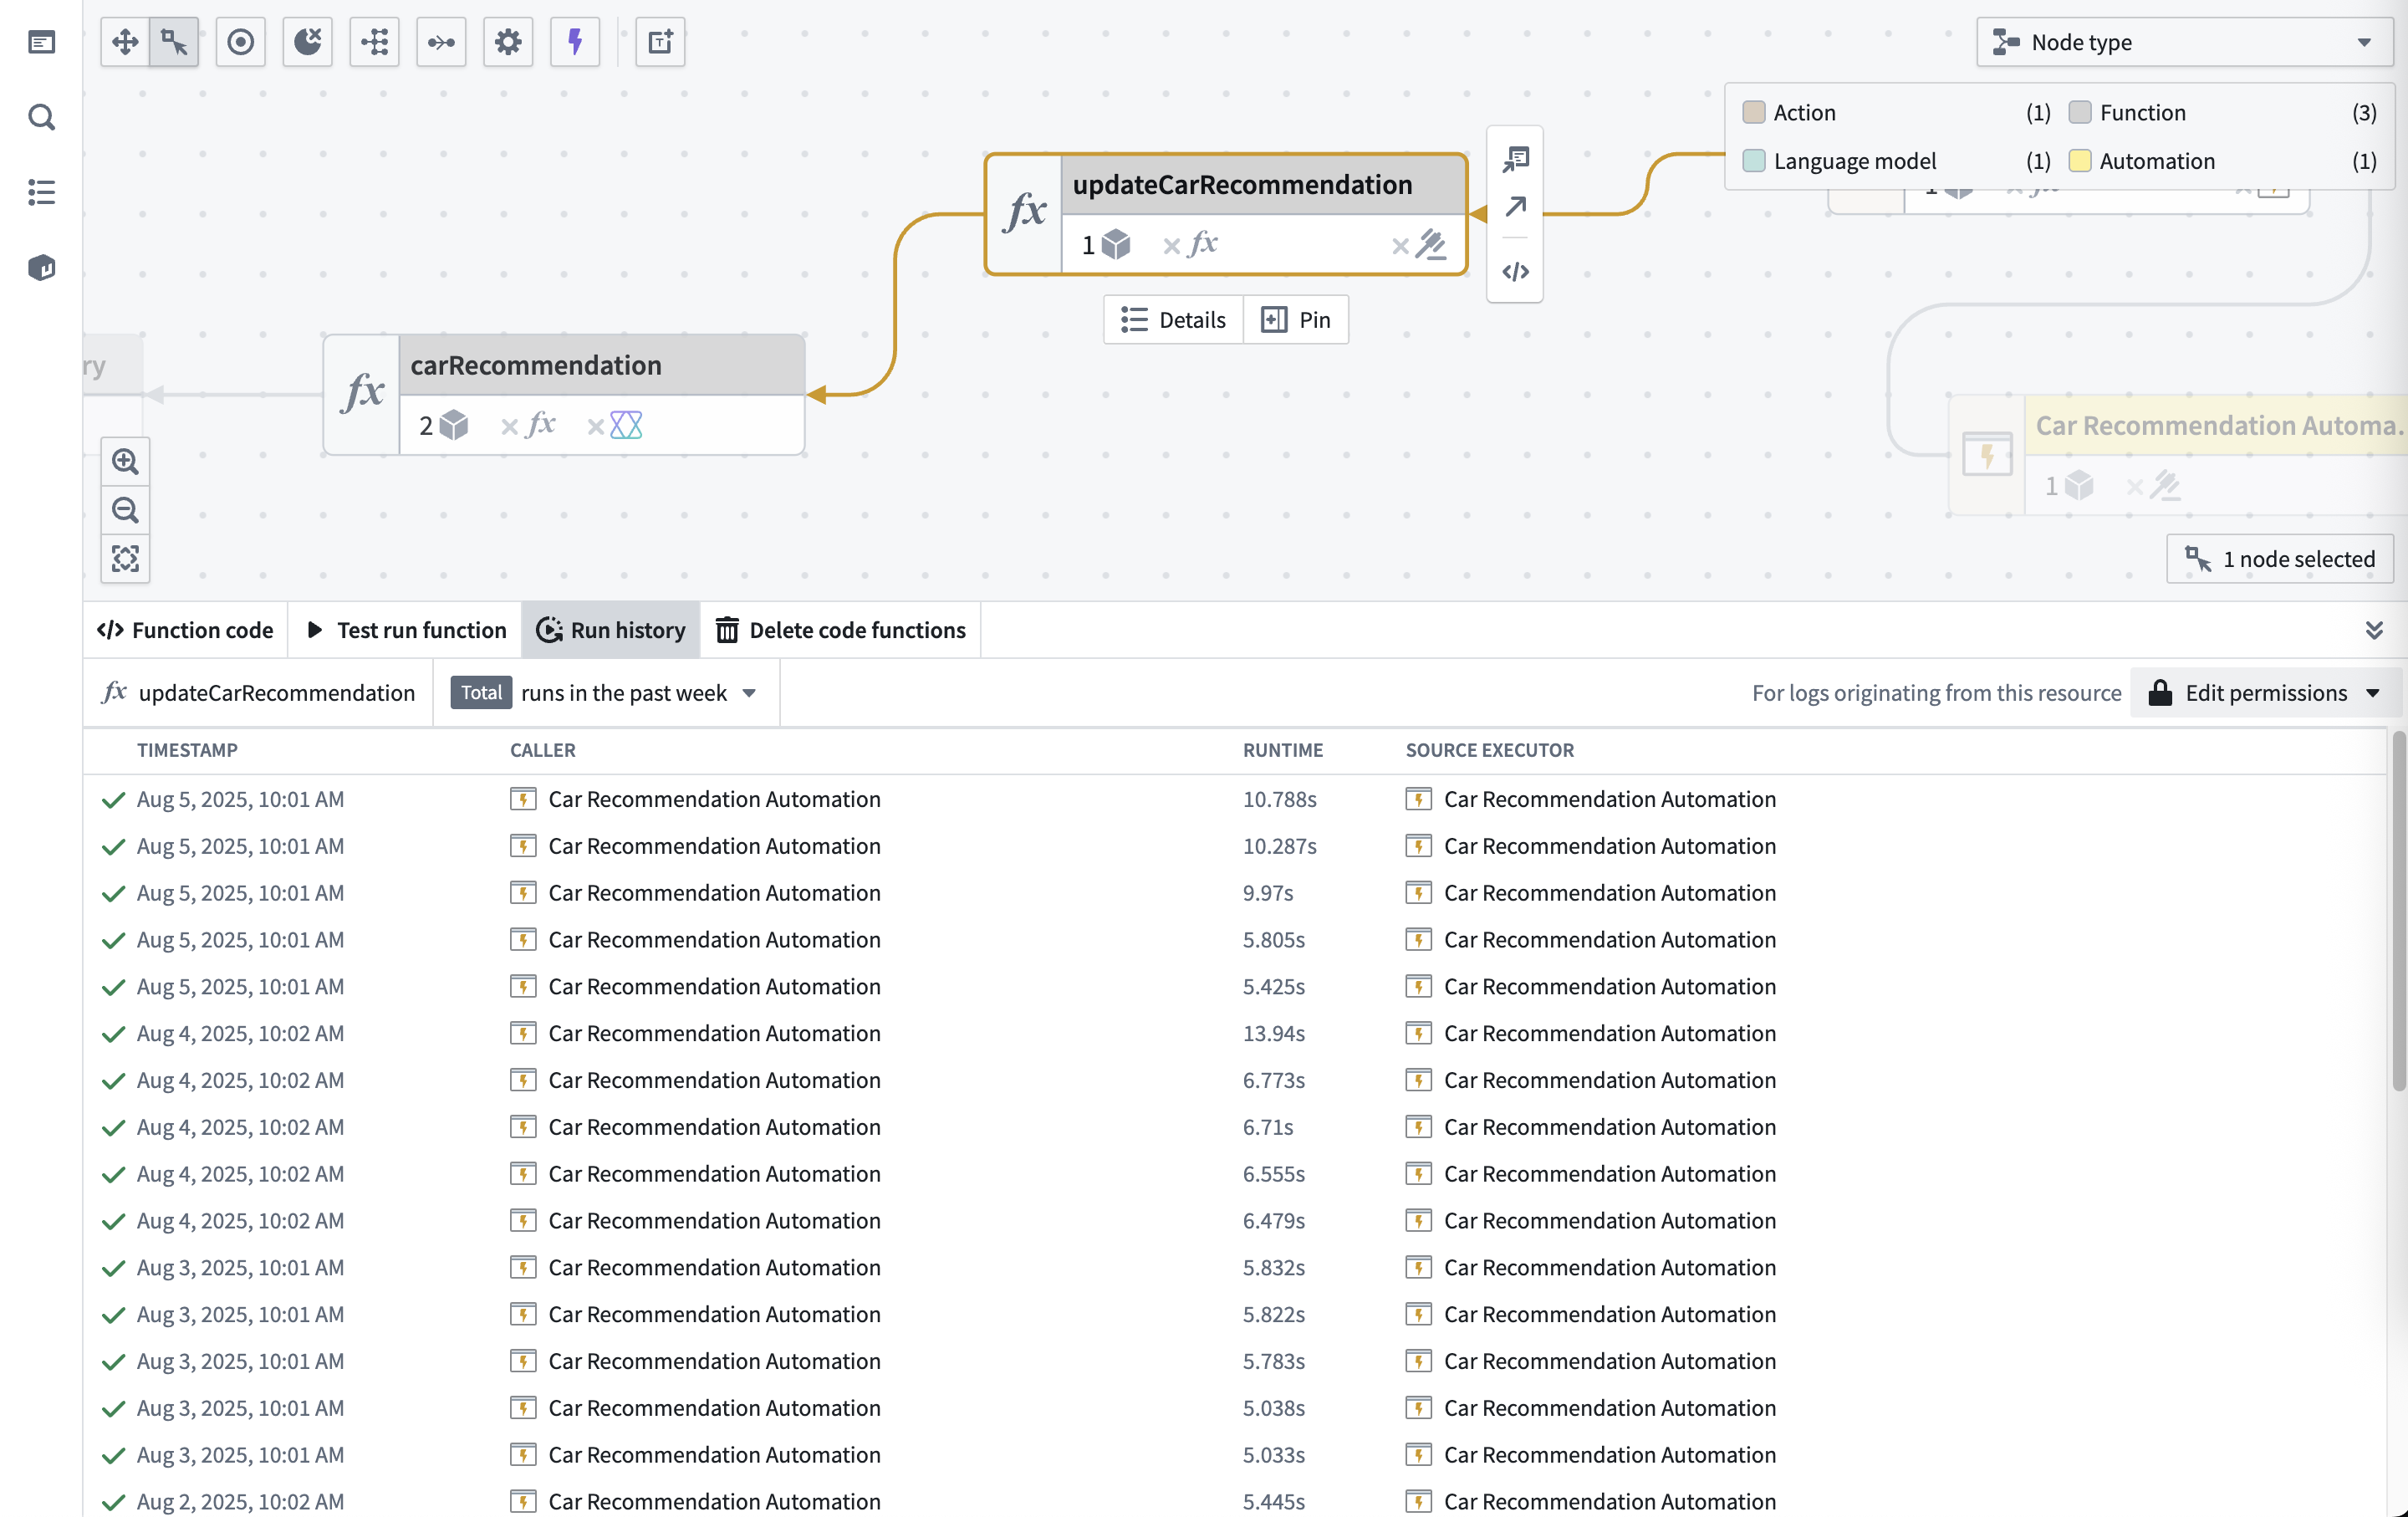
To see the run history for a Function, Action or automation, navigate to the resource, then select the Run history tab. This provides a complete view of all executions over the past 30 days.
Run history data
The Run history table includes:
- Timestamp: When each execution finished.
- Status: Success (✓) or failure (✗).
- Runtime: Total execution time.
- Caller: The resource that triggered the execution; this can be a Workshop application, Agent, Third-party application, Automation, Action, or other system component.
- Source executor: The top level executable resource type (limited to Function, Action, or Automation) in the call chain.
The run history displays executions from the past 30 days, sorted by timestamp.
Limitations
- UDFs in Pipeline Builder: Execution history is not available for user-defined functions (UDFs) run from a sidecar container, such as in Python or Java UDFs.
Filter run history
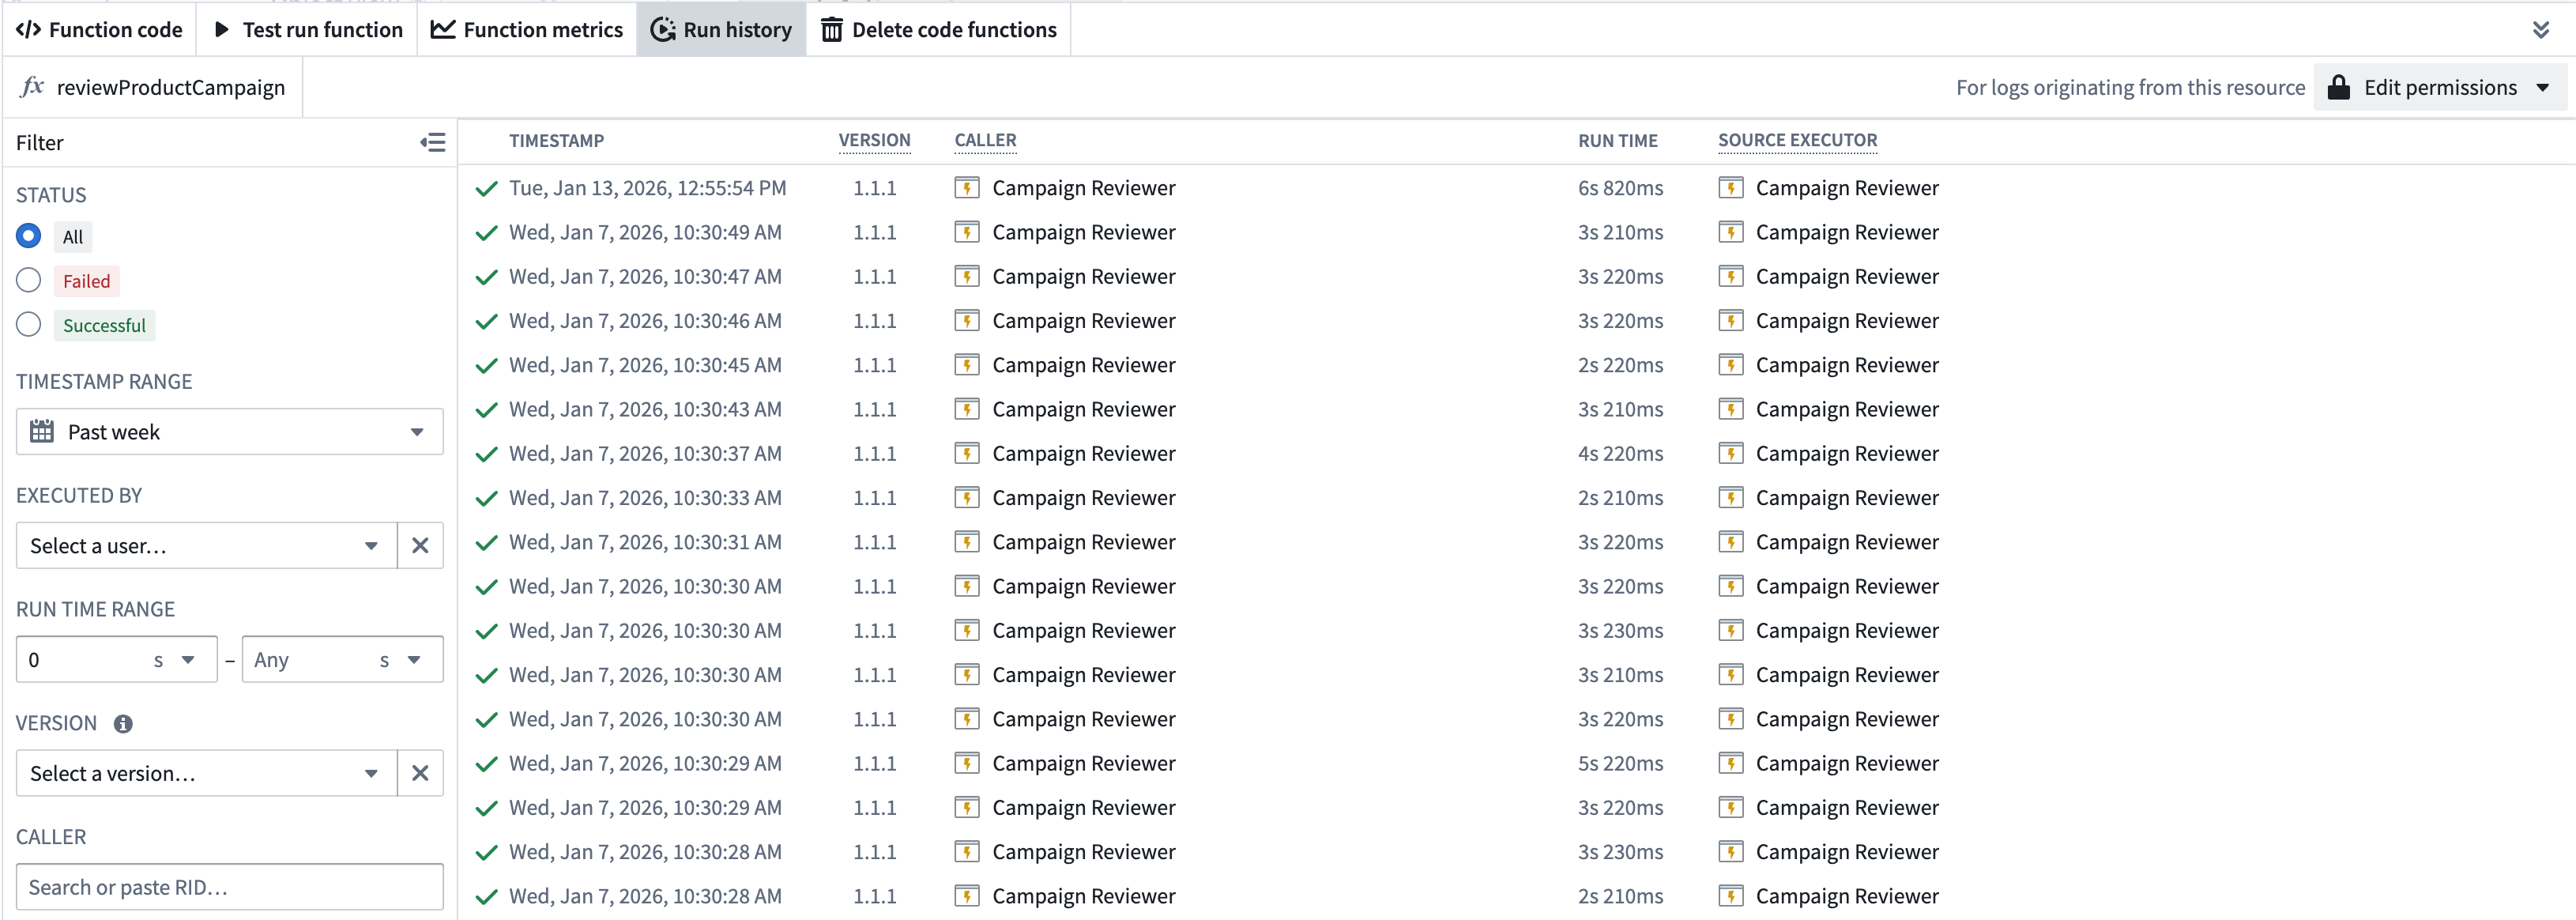
You can filter the results by:
- Status: View successful or failed executions.
- Timestamp range: View executions within a specified date range.
- User: View executions triggered by a specific user.
- Run time range: View executions within a specified duration range.
- Version: View executions for a specified version (only applicable for functions).
- Caller: View executions originating from a specified resource.
- Failure type: View executions that failed for a specific reason. Learn more about function and action failure types.
If more than one filter is specified, the results will be filtered to include only those that match all specified filters.
Inspect a specific execution
To inspect a specific execution, select the View log details option to access the full trace and debugging information.
Next steps
- View trace details to understand execution flow.
- Access service logs for detailed debugging.
- Configure log permissions to enable log visibility.
中文翻译
运行历史
要查看函数(Function)、操作(Action)或自动化(Automation)的运行历史,请导航至相应资源,然后选择运行历史选项卡。该页面提供了过去30天内所有执行情况的完整视图。
运行历史数据
运行历史表格包含以下内容:
- 时间戳(Timestamp): 每次执行完成的时间。
- 状态(Status): 成功(✓)或失败(✗)。
- 运行时长(Runtime): 总执行时间。
- 调用方(Caller): 触发执行的资源,可以是 Workshop 应用、代理(Agent)、第三方应用、自动化(Automation)、操作(Action)或其他系统组件。
- 源执行器(Source executor): 调用链中的顶层可执行资源类型(仅限于函数、操作或自动化)。
运行历史显示过去30天内的执行记录,并按时间戳排序。
限制
筛选运行历史
您可以通过以下条件筛选结果:
- 状态: 查看成功或失败的执行记录。
- 时间戳范围: 查看指定日期范围内的执行记录。
- 用户: 查看特定用户触发的执行记录。
- 运行时长范围: 查看指定时长范围内的执行记录。
- 版本: 查看指定版本的执行记录(仅适用于函数)。
- 调用方: 查看来自指定资源的执行记录。
- 失败类型: 查看因特定原因失败的执行记录。了解更多关于函数和操作失败类型的信息。
如果指定了多个筛选条件,结果将仅包含同时满足所有指定条件的记录。
检查特定执行记录
要检查特定执行记录,请选择查看日志详情选项,以获取完整的追踪和调试信息。