Service logs and debugging(服务日志与调试)
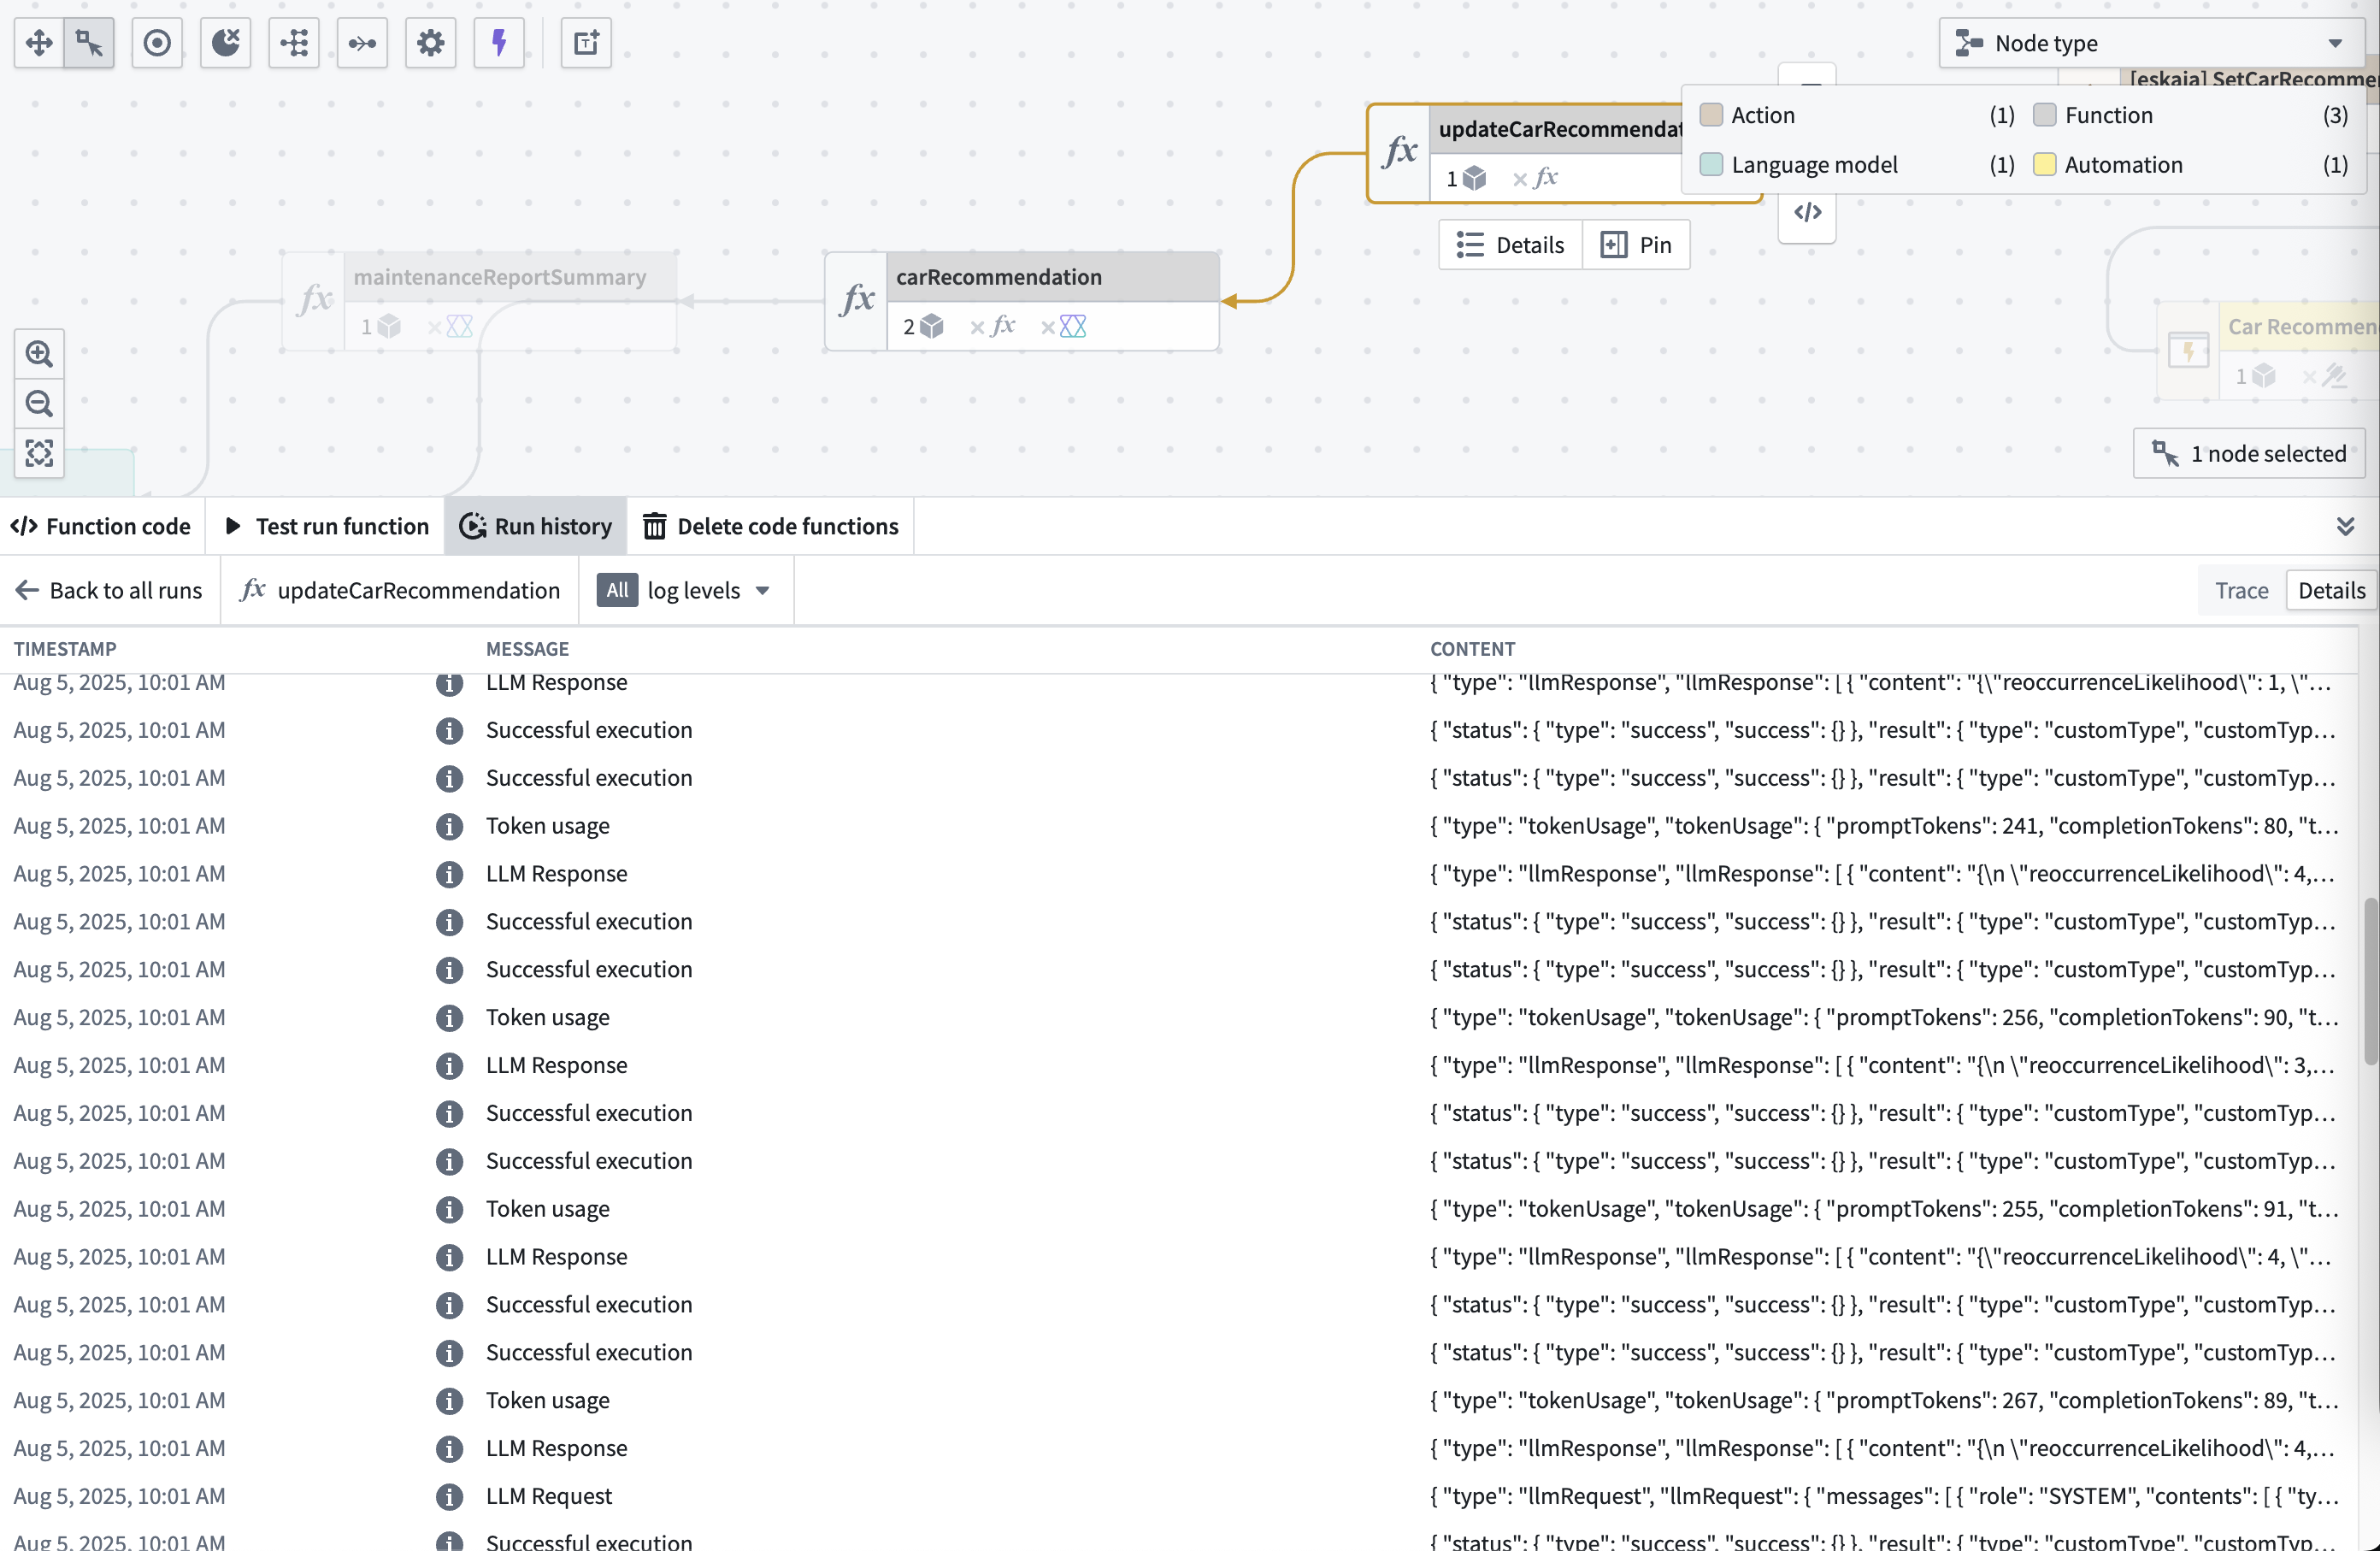
To access detailed logging information, navigate to the Details view after selecting the View log details option for a specific execution.
The service logs provide:
- Chronological log entries: All log messages generated during execution.
- Log levels:
INFO,WARN,ERROR,DEBUG, andTRACEmessages. - Custom log messages: Any console.log() or logging statements from your functions or models.
Permission required
To view traces and service logs, an administrator must enable log access for the relevant project. Users always have access to logs for their own executions from the past 24 hours, except on CBAC stacks, where log access must be enabled to view trace and service logs.
Filtering logs
To filter for specific log levels, use the log levels selector at the top of the table:
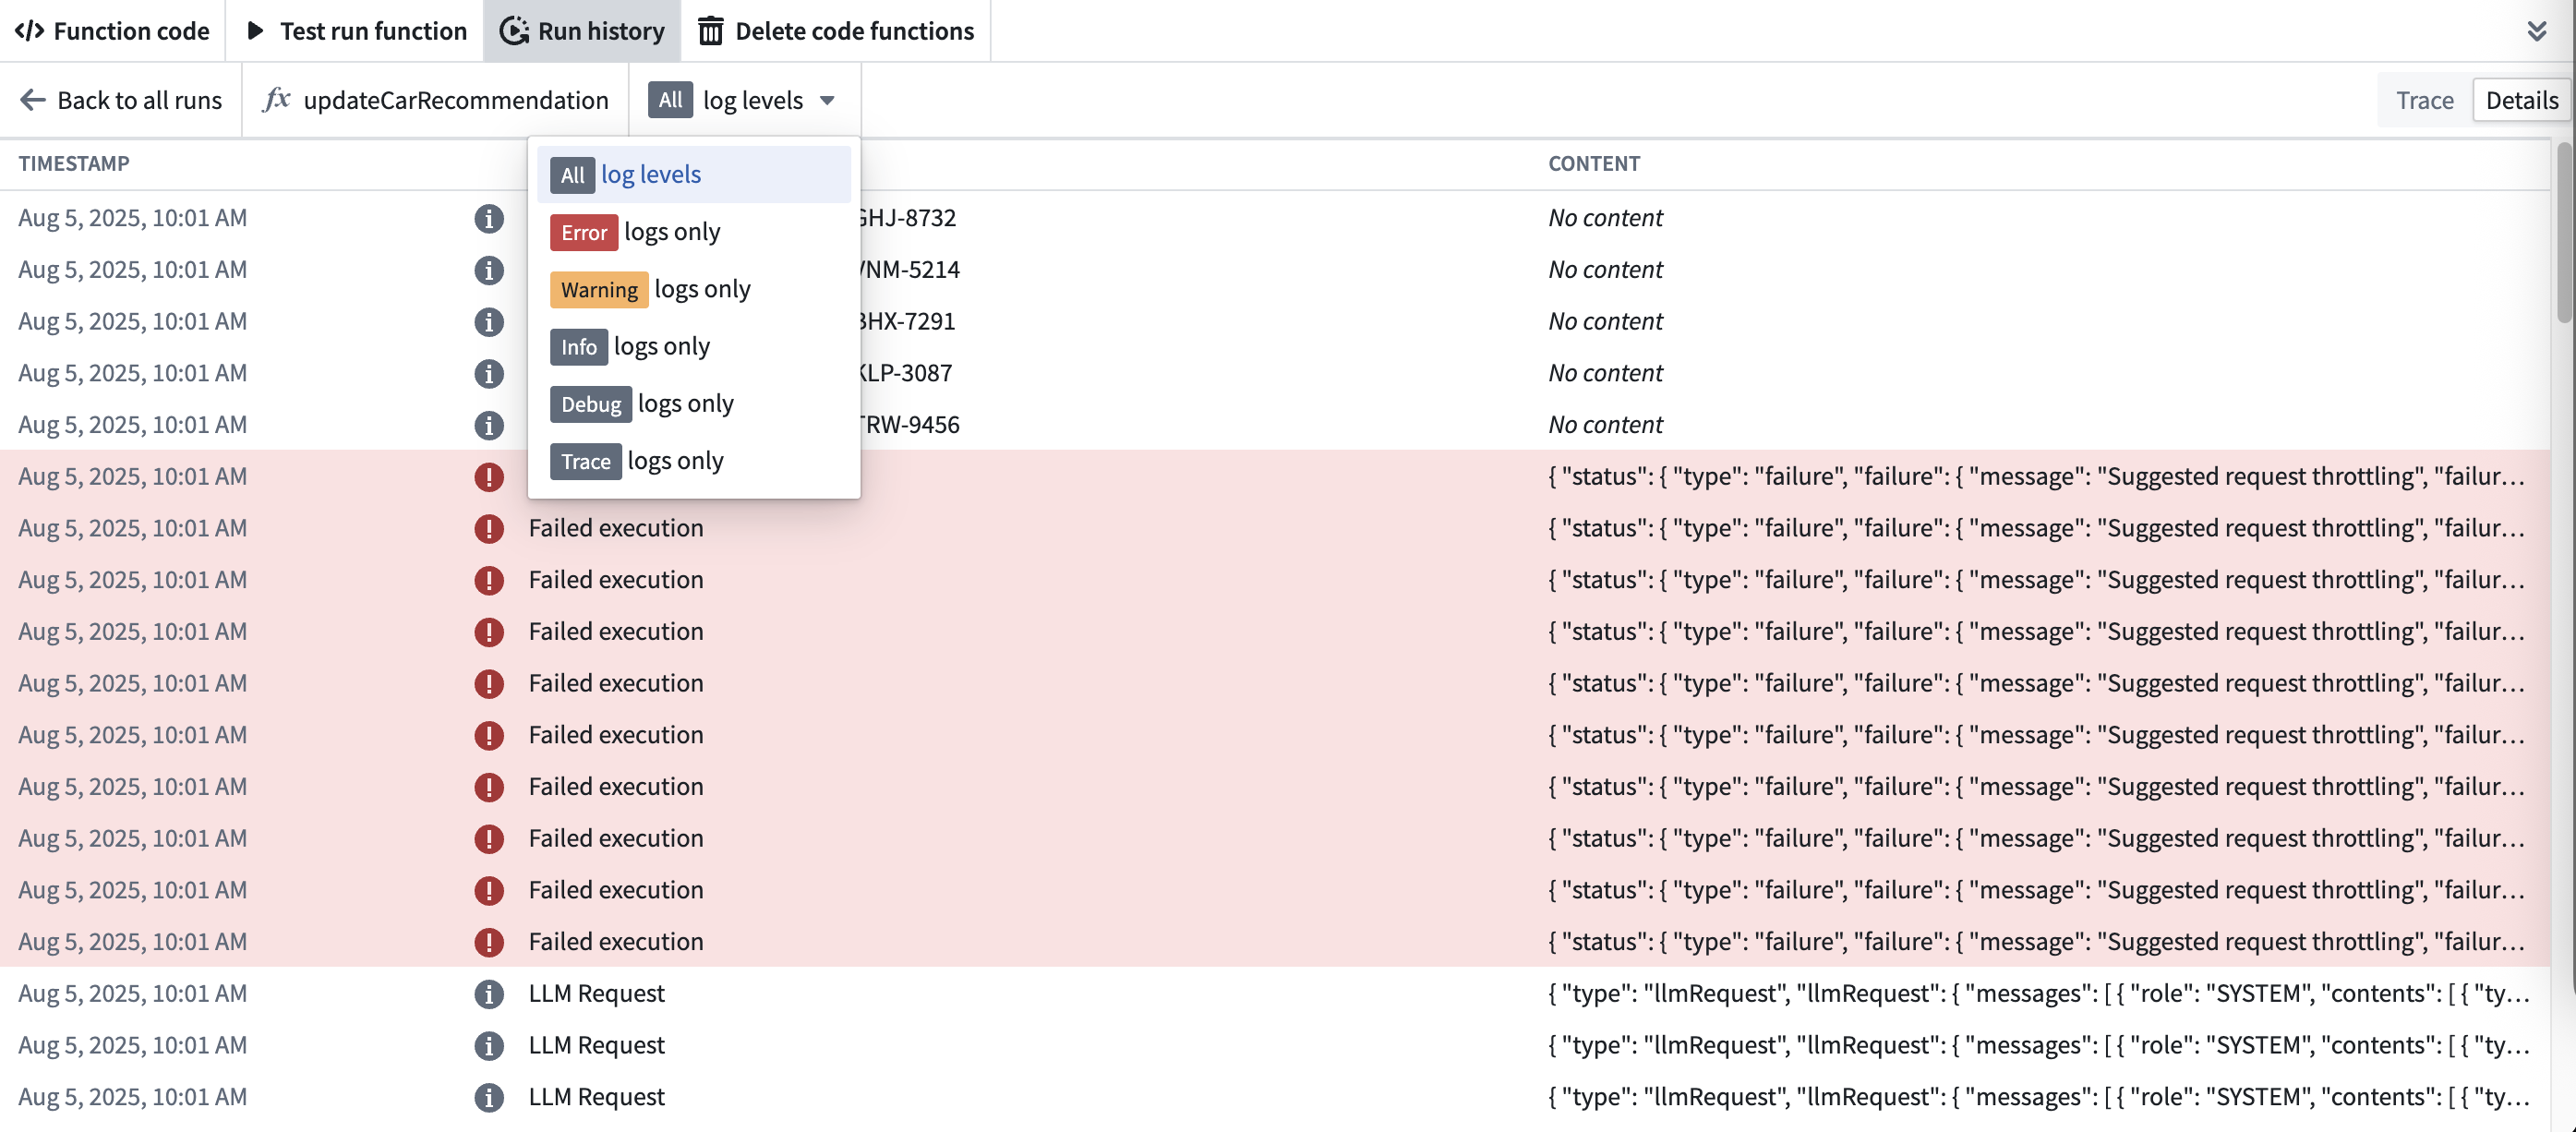
Available log levels:
- ERROR: Error messages and stack traces
- WARN: Warnings about potential issues
- INFO: General information about execution flow
- DEBUG: Detailed debugging information
- TRACE: Detailed trace information
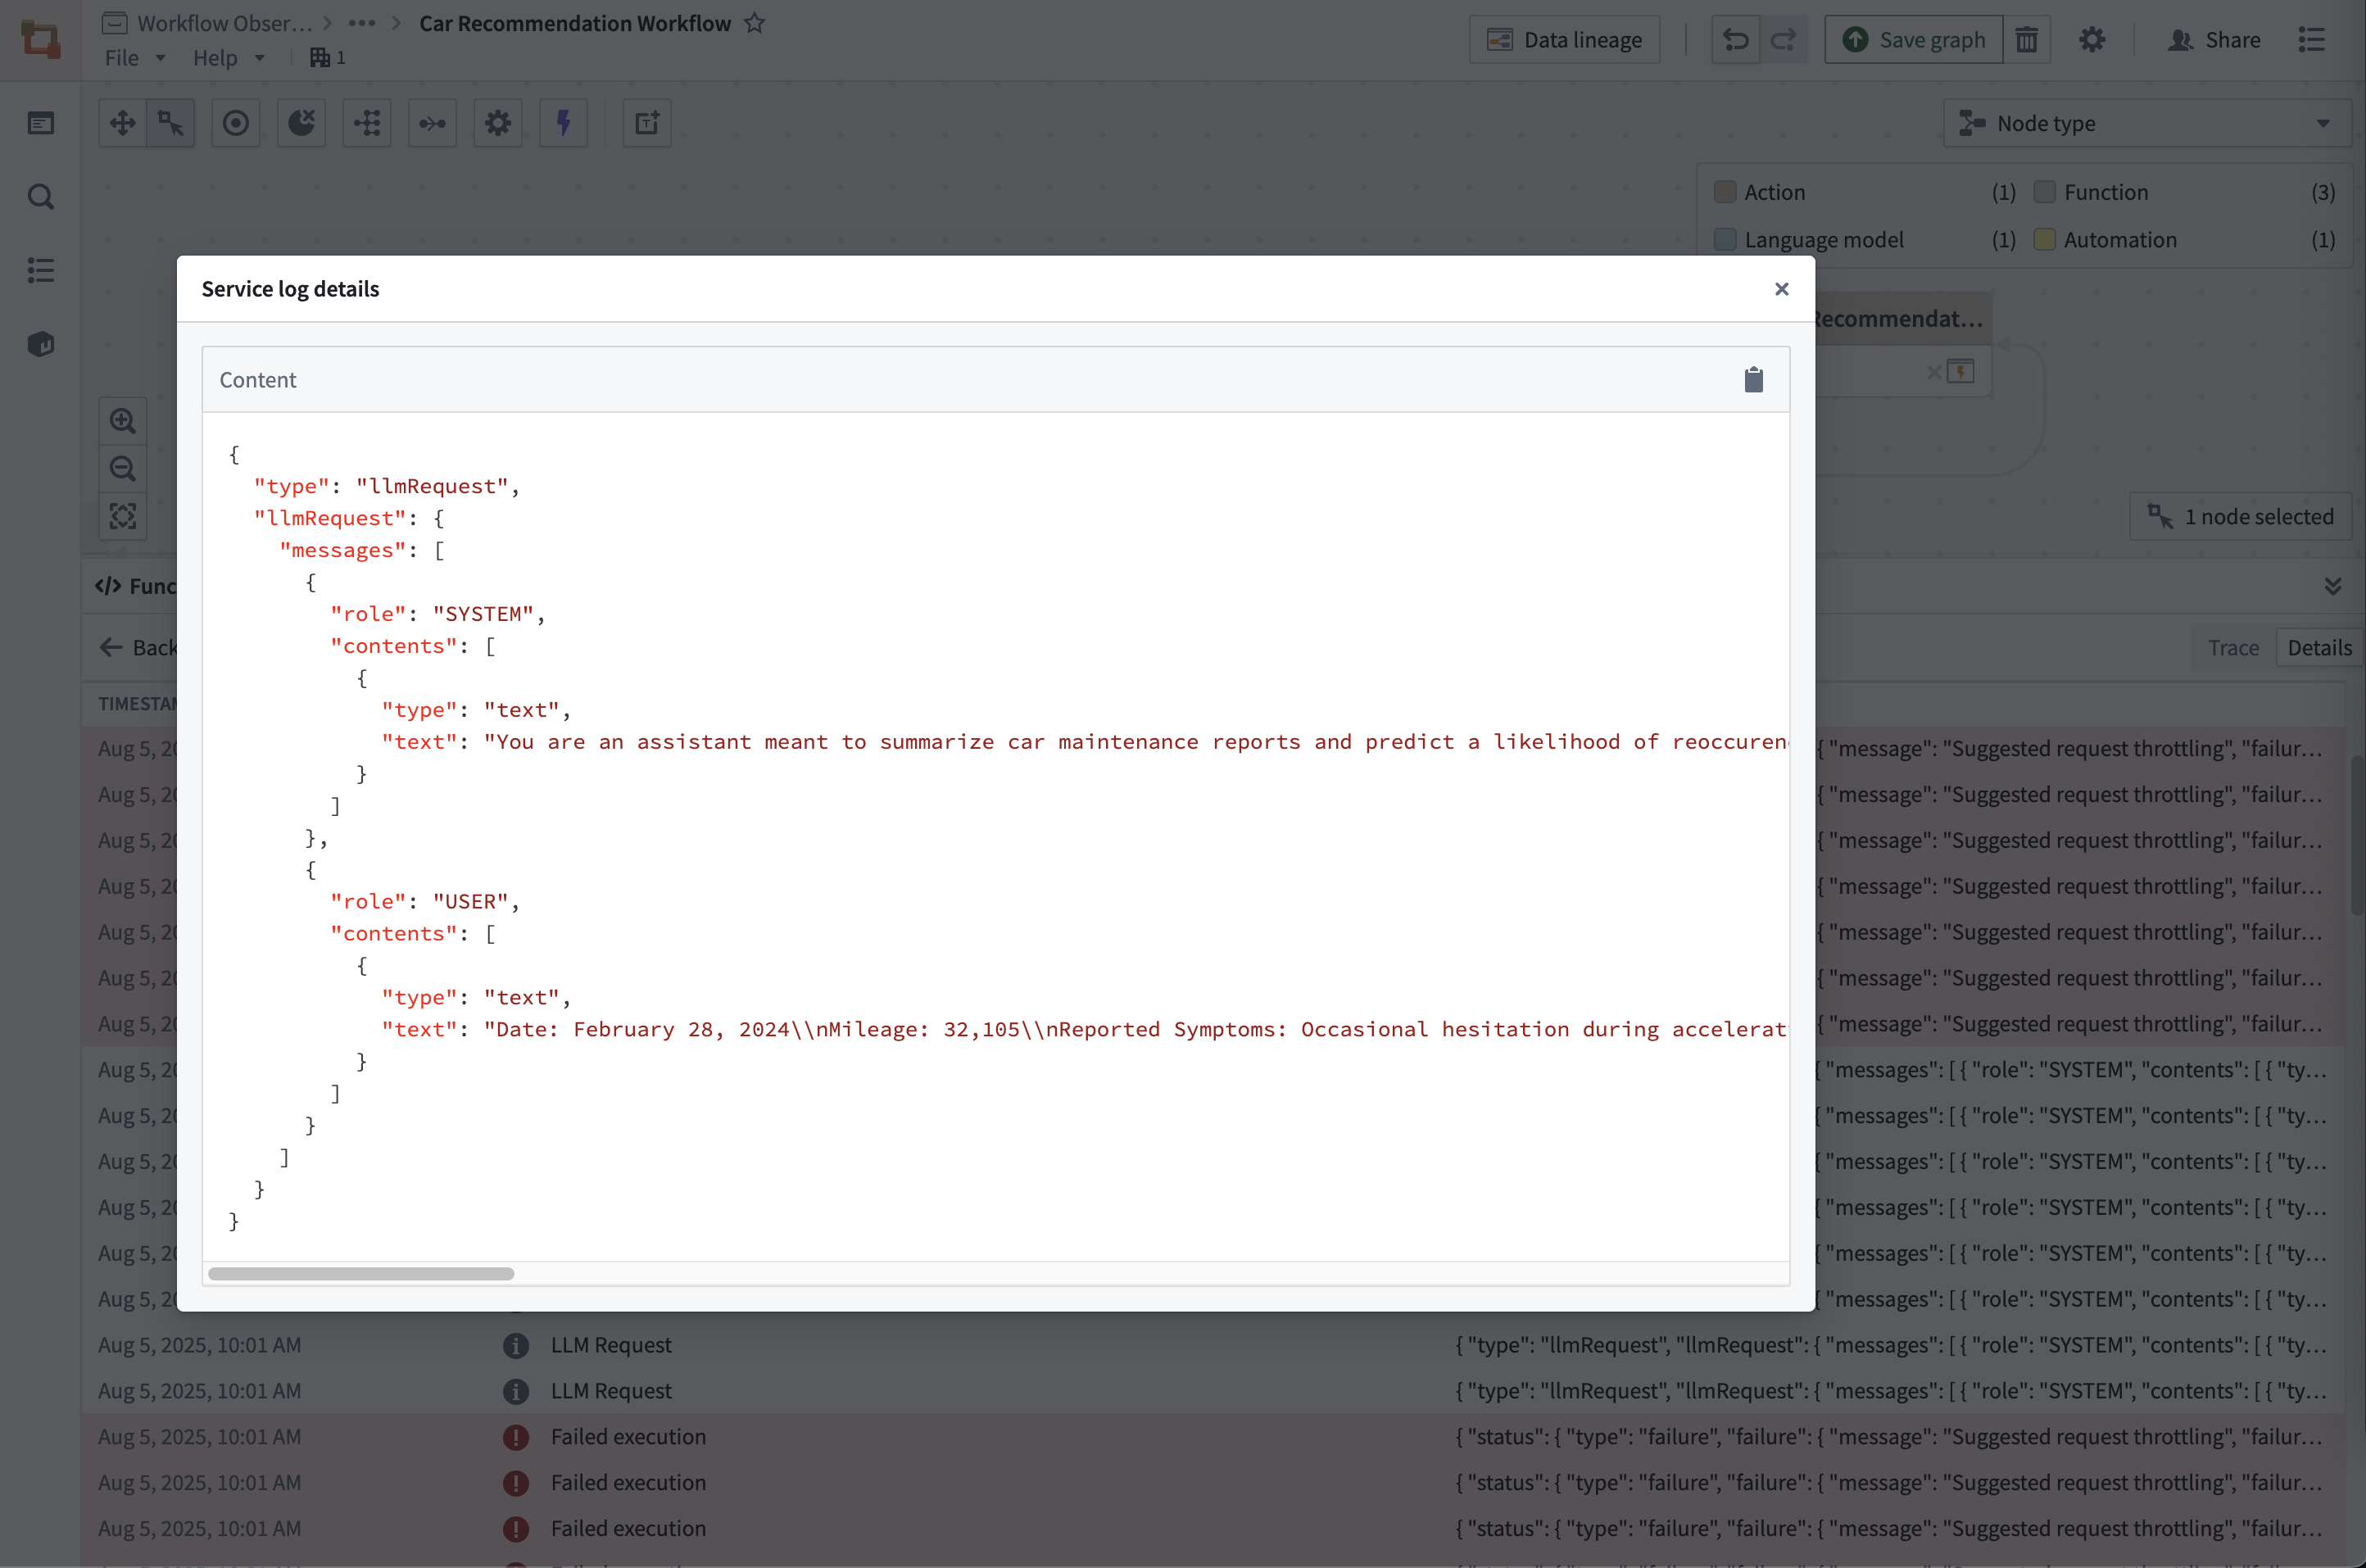
To see the full details of any log entry, select the Content field:
Writing effective logs in your functions
Effective logging helps you debug issues quickly and understand your function's behavior in production. Follow these best practices:
Choose appropriate log levels
- INFO: Use for normal operation flow and key business events.
- WARN: Use for recoverable issues or unexpected conditions that don't prevent execution.
- ERROR: Use for failures that prevent normal operation.
- DEBUG: Use for detailed diagnostic information (avoid in production).
Include relevant context
We recommend including identifiers and relevant data that can help you understand what has happened:
```typescript tab="TypeScript v1" // TypeScript v1 example - Good logging practices console.log("Processing order", orderId, "for user", userId); // Include relevant IDs console.log("Retrieved", results.length, "items from Ontology"); // Include counts/metrics console.warn("Retry attempt", attemptNumber, "of", maxRetries, "for operation", operationId); // Include retry context console.error("Failed to process order", orderId, "Error:", error.message); // Include error details
```typescript tab="TypeScript v2"
import { logs } from "@opentelemetry/api-logs";
const logger = logs.getLogger("my-function");

// TypeScript v2 example - Good logging practices
logger.emit({
    severityText: "INFO",
    attributes: { LOG_MESSAGE: `Processing order ${orderId} for user ${userId}` }, // Include relevant IDs
    body: { orderId, userId },
});
logger.emit({
    severityText: "WARN",
    attributes: { LOG_MESSAGE: `Retry attempt ${attemptNumber} of ${maxRetries} for operation ${operationId}` }, // Include retry context
    body: { attemptNumber, maxRetries, operationId },
});
logger.emit({
    severityText: "ERROR",
    attributes: { LOG_MESSAGE: `Failed to process order ${orderId}. Error: ${error.message}` }, // Include error details
    body: { orderId, error: error.message },
});
Avoid logging sensitive data
Never log sensitive information that could compromise security:
// ❌ Don't do this
console.log("User credentials", username, password);
console.log("API response", fullApiResponse); // May contain sensitive data

// ✅ Do this instead
console.log("Authentication attempt for user", username);
console.log("API call completed with status", response.status);
See also
- Log search: Search across logs from all executions for a source executor.
- Log permissions: Configure who can view logs.
- Trace view: Correlate logs with execution timeline.
中文翻译
服务日志与调试
要访问详细的日志信息,请在选定特定执行的 查看日志详情 选项后,导航至 详情 视图。
服务日志提供以下内容:
- 按时间顺序排列的日志条目: 执行期间生成的所有日志消息。
- 日志级别:
INFO、WARN、ERROR、DEBUG和TRACE消息。 - 自定义日志消息: 来自函数或模型的任何 console.log() 或日志记录语句。
所需权限
要查看追踪(trace)和服务日志,管理员必须为相关项目启用日志访问权限。用户始终可以访问自己过去24小时内执行的日志,但在基于分类的访问控制(CBAC)堆栈上除外,在这些堆栈上必须启用日志访问权限才能查看追踪和服务日志。
筛选日志
要筛选特定日志级别,请使用表格顶部的 日志级别 选择器:
可用的日志级别:
- ERROR: 错误消息和堆栈跟踪
- WARN: 关于潜在问题的警告
- INFO: 关于执行流程的常规信息
- DEBUG: 详细的调试信息
- TRACE: 详细的追踪信息
要查看任何日志条目的完整详情,请选择 内容 字段:
在函数中编写有效的日志
有效的日志记录有助于您快速调试问题并了解函数在生产环境中的行为。请遵循以下最佳实践:
选择合适的日志级别
- INFO: 用于正常操作流程和关键业务事件。
- WARN: 用于可恢复的问题或不影响执行的意外情况。
- ERROR: 用于阻止正常操作的故障。
- DEBUG: 用于详细的诊断信息(避免在生产环境中使用)。
包含相关上下文
我们建议包含标识符和相关数据,以帮助您了解发生的情况:
```typescript tab="TypeScript v1" // TypeScript v1 示例 - 良好的日志记录实践 console.log("正在处理订单", orderId, ",用户", userId); // 包含相关ID console.log("从本体检索到", results.length, "个项目"); // 包含计数/指标 console.warn("重试尝试", attemptNumber, ",共", maxRetries, "次,操作", operationId); // 包含重试上下文 console.error("处理订单失败", orderId, "错误:", error.message); // 包含错误详情
```typescript tab="TypeScript v2"
import { logs } from "@opentelemetry/api-logs";
const logger = logs.getLogger("my-function");

// TypeScript v2 示例 - 良好的日志记录实践
logger.emit({
    severityText: "INFO",
    attributes: { LOG_MESSAGE: `正在处理订单 ${orderId},用户 ${userId}` }, // 包含相关ID
    body: { orderId, userId },
});
logger.emit({
    severityText: "WARN",
    attributes: { LOG_MESSAGE: `重试尝试 ${attemptNumber},共 ${maxRetries} 次,操作 ${operationId}` }, // 包含重试上下文
    body: { attemptNumber, maxRetries, operationId },
});
logger.emit({
    severityText: "ERROR",
    attributes: { LOG_MESSAGE: `处理订单 ${orderId} 失败。错误: ${error.message}` }, // 包含错误详情
    body: { orderId, error: error.message },
});
避免记录敏感数据
切勿记录可能危及安全的敏感信息:
// ❌ 不要这样做
console.log("用户凭据", username, password);
console.log("API响应", fullApiResponse); // 可能包含敏感数据

// ✅ 请这样做
console.log("用户", username, "的身份验证尝试");
console.log("API调用完成,状态码", response.status);