Trace views(追踪视图(Trace views))
The Trace view provides a visual timeline of your workflow execution, showing how different services interact and where time is spent. Specifically, a distributed trace is the timeline comprising all of the events between the generation of a request and the receipt of a response; these events can cross process, network and security boundaries. Distributed traces are key to understanding the path a request takes within your application.
Permission required
To view traces and service logs, an administrator must enable log access for the relevant project. Users always have access to logs for their own executions from the past 24 hours, except on CBAC stacks, where log access must be enabled to view trace and service logs.
Key elements of the trace view
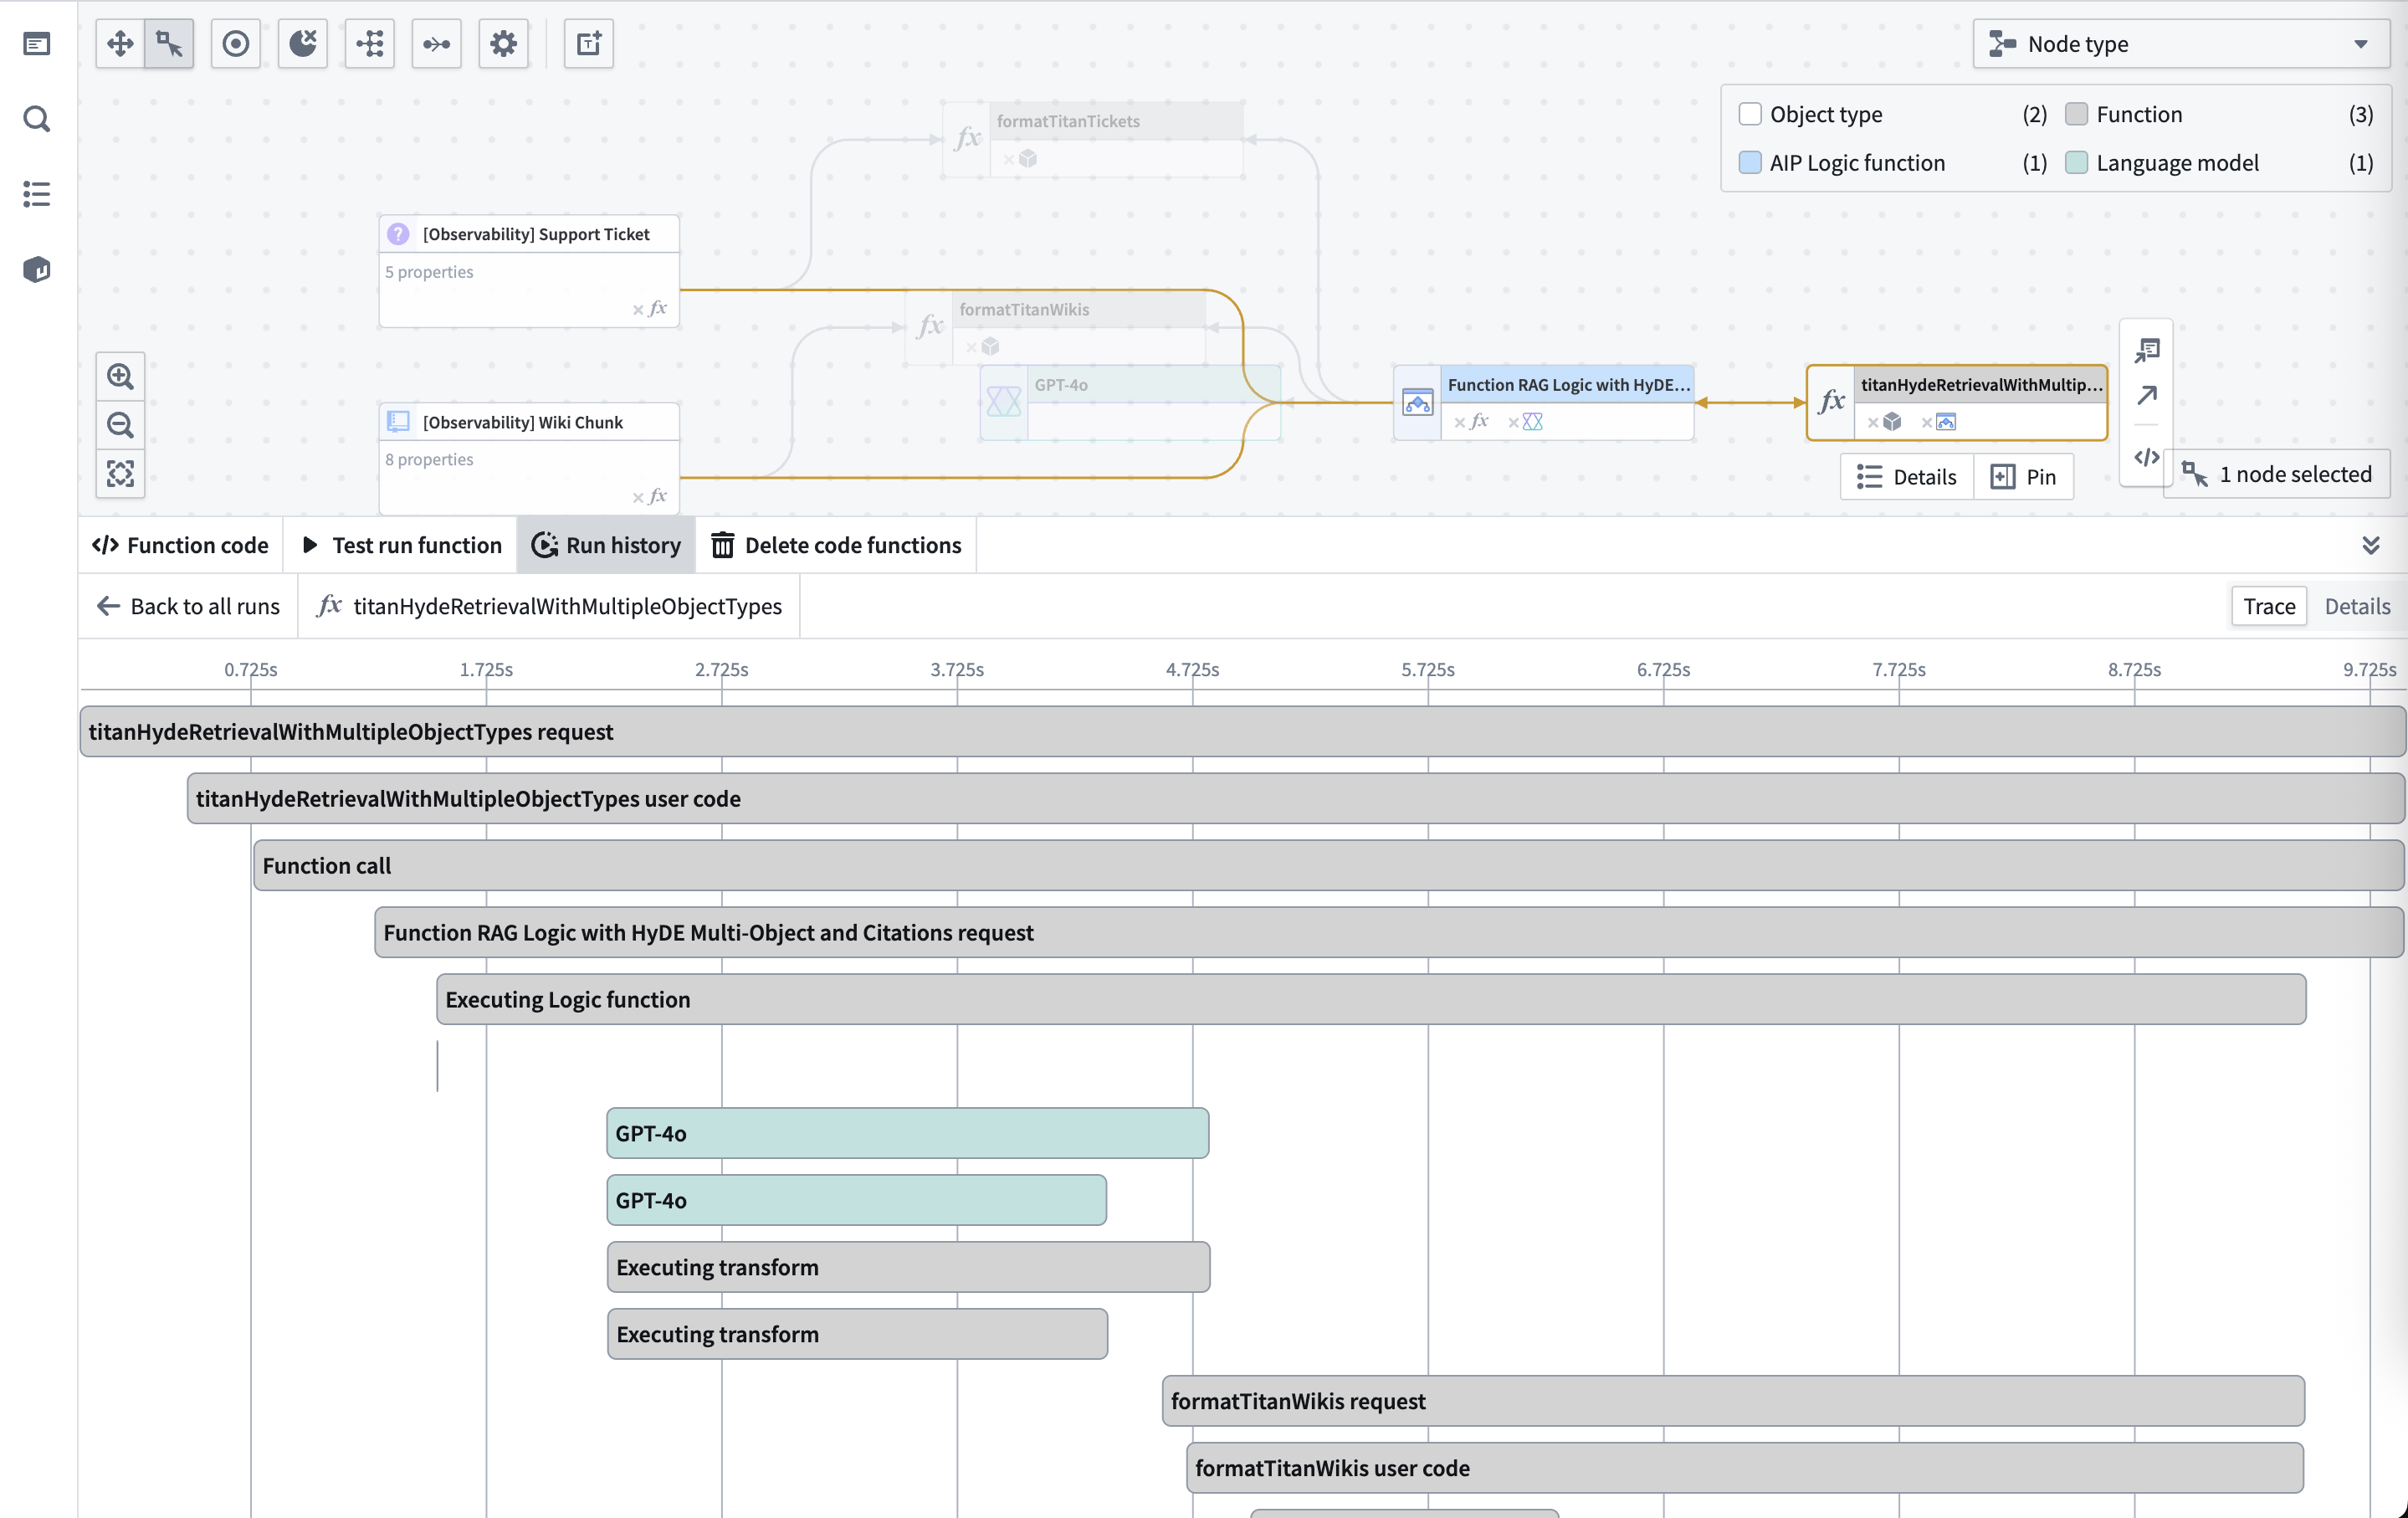
- Timeline visualization: Horizontal bars show the duration of each operation.
- Service hierarchy: Nested spans show parent-child relationships between operations.
- Resource types: Coloring indicating whether each span was produced from a function, action, automation, model, or LLM call.
- Performance metrics: Each span displays its execution time.
Analyzing trace details
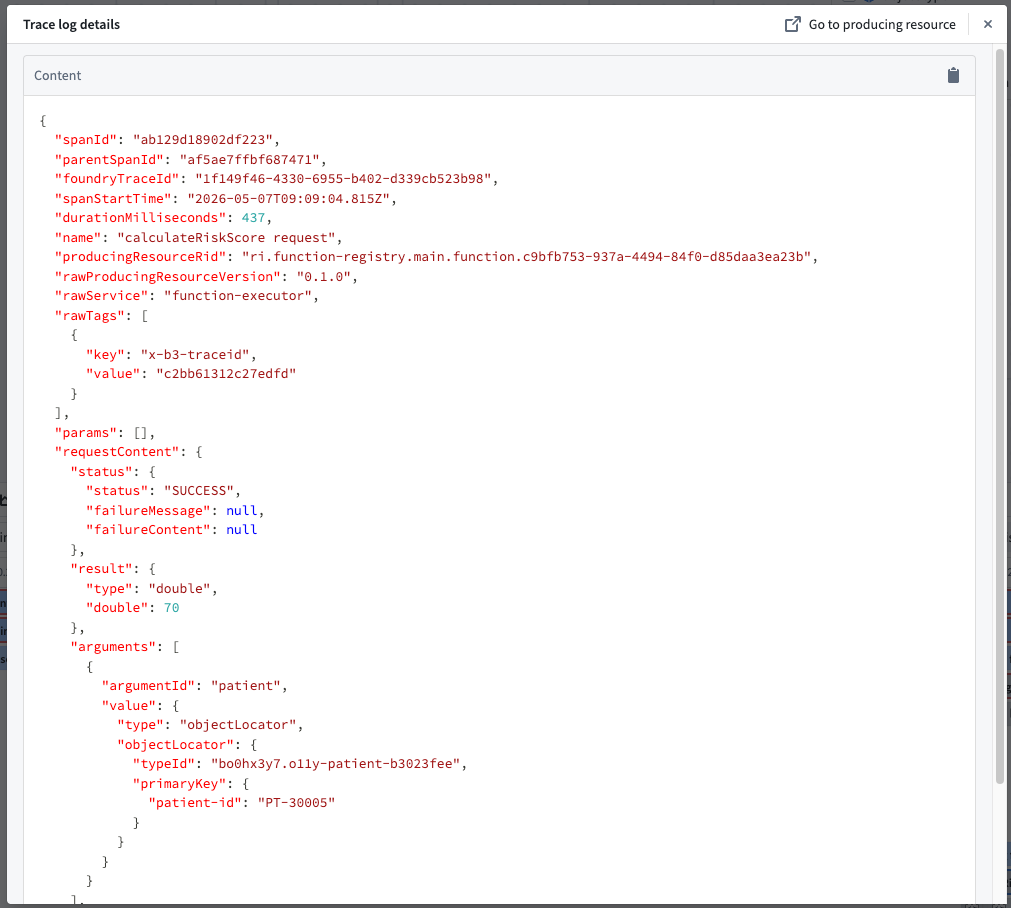
You can select any span to see the full Trace Log Details for that specific operation.
Trace details include:
- Operation name: The specific function, action, language model, automation, model, or inner operation being executed.
- Duration: Execution time for the operation.
- Input/output data: For Function execution requests, you can view the parameters passed to and returned from the operation.
- Model interactions: For LLM calls, you can view the prompt, response, and token usage.
- Error information: Stack traces and error messages for failed operations.
- Trace identifiers:
foundryTraceId, the Foundry-assigned identifier used to fetch telemetry, andx-b3-traceid, the standard distributed-tracing identifier included in the tags field on each service log entry (best-effort; may be absent on logs originating outside Foundry, such as applications built with the Ontology SDK).
Related features
- Execution history: View all recent executions before diving into traces.
- Service logs: Access detailed log messages for each span.
- Performance monitoring: Analyze trace data to identify optimization opportunities.
中文翻译
追踪视图(Trace views)
追踪视图以可视化时间线形式展示工作流执行过程,呈现不同服务间的交互方式及耗时分布。具体而言,分布式追踪(distributed trace) 是指从请求生成到收到响应之间所有事件构成的时间线;这些事件可能跨越进程、网络和安全边界。分布式追踪是理解请求在应用程序中路径的关键。
所需权限
要查看追踪和服务日志,管理员必须为相关项目启用日志访问权限。用户始终可以查看自己过去24小时内执行的日志,但基于分类的访问控制(CBAC)堆栈除外——在该环境下必须启用日志访问权限才能查看追踪和服务日志。
追踪视图的关键元素
- 时间线可视化: 水平条显示每个操作的持续时间。
- 服务层级: 嵌套跨度(span)展示操作间的父子关系。
- 资源类型: 颜色标识每个跨度来自函数(function)、操作(action)、自动化(automation)、模型(model)还是大语言模型(LLM)调用。
- 性能指标: 每个跨度显示其执行时间。
分析追踪详情
您可以选择任意跨度,查看该操作的完整追踪日志详情(Trace Log Details)。
追踪详情包括:
- 操作名称: 正在执行的特定函数、操作、语言模型、自动化、模型或内部操作。
- 持续时间: 操作的执行时间。
- 输入/输出数据: 对于函数执行请求,可查看传入和返回的参数。
- 模型交互: 对于大语言模型(LLM)调用,可查看提示词(prompt)、响应(response)和令牌用量(token usage)。
- 错误信息: 失败操作的堆栈追踪和错误消息。
- 追踪标识符:
foundryTraceId(Foundry分配的用于获取遥测数据的标识符)和x-b3-traceid(标准分布式追踪标识符,包含在每个服务日志条目的 tags 字段中;尽力提供,对于源自Foundry外部的日志——如使用本体SDK构建的应用程序——可能缺失)。
相关功能
- 执行历史(Execution history):在深入追踪前查看所有近期执行记录。
- 服务日志(Service logs):访问每个跨度的详细日志消息。
- 性能监控(Performance monitoring):分析追踪数据以发现优化机会。