Automation events(自动化事件)
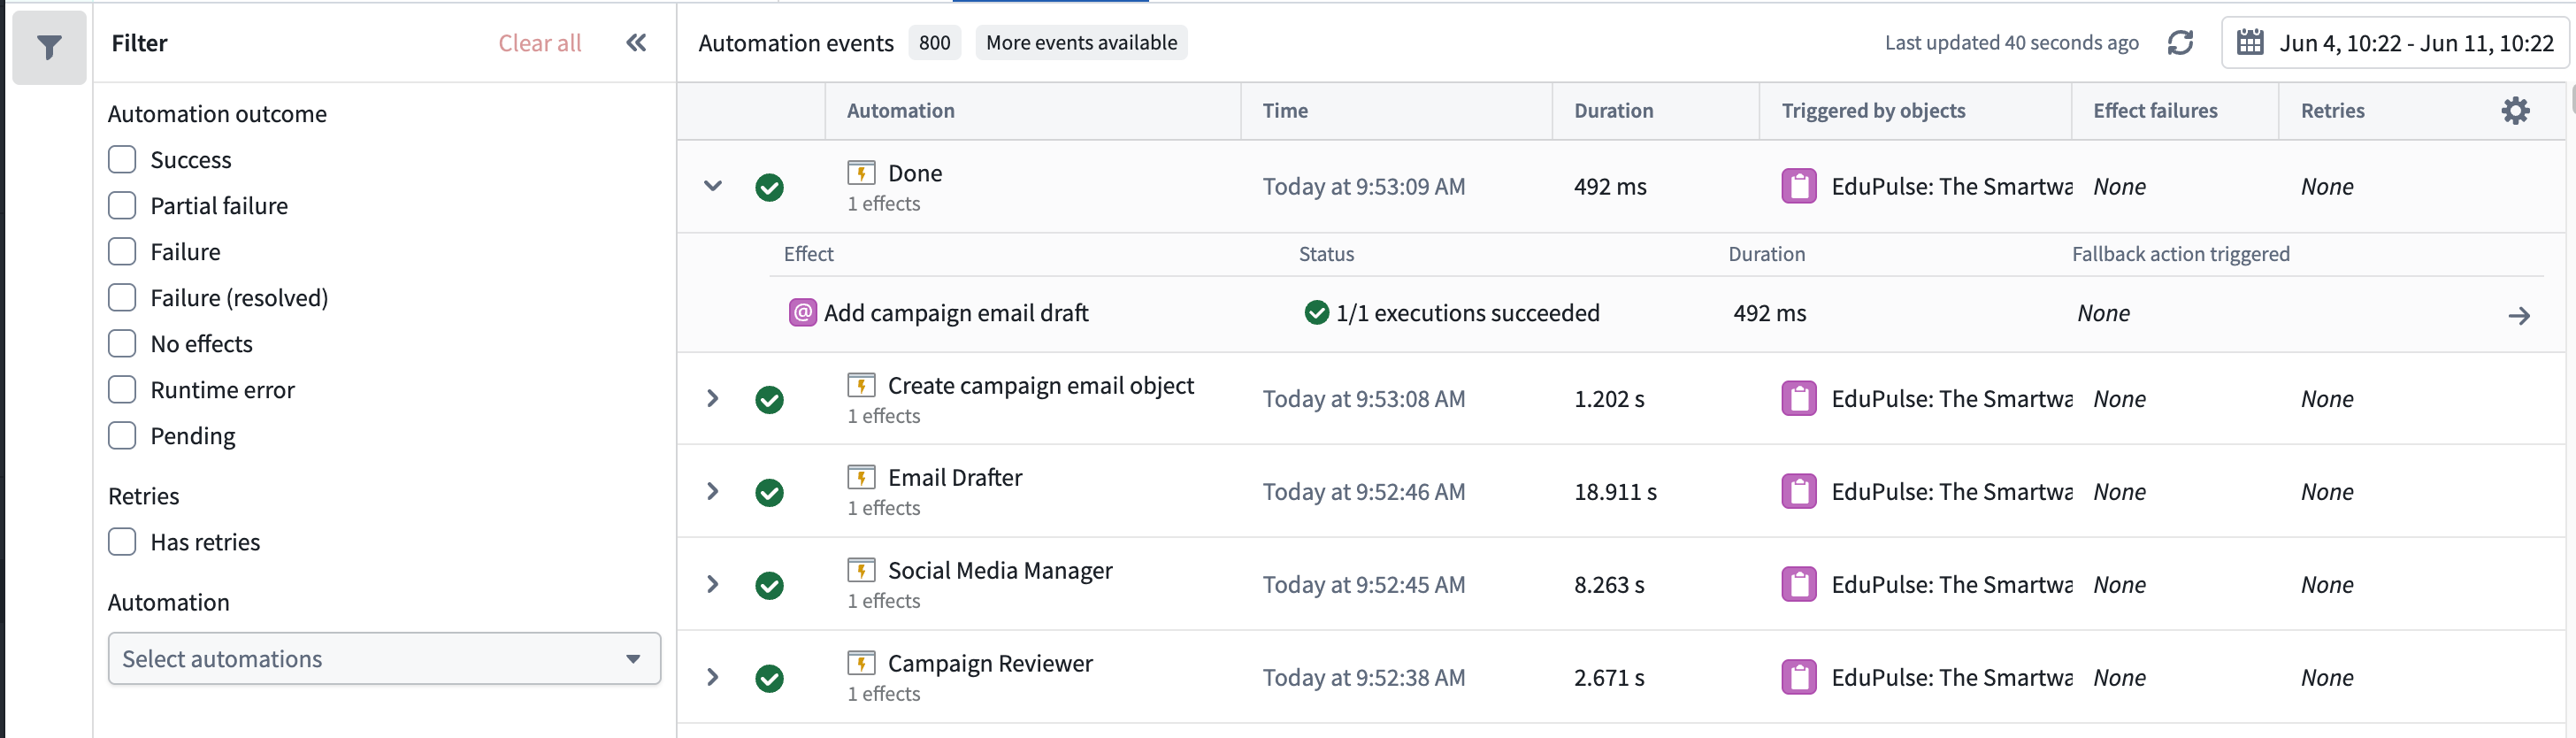
The Automation events tab provides observability into all automation events across your workbench. Monitor system performance, investigate failures from the automation down to the logic block, and understand how automations are processing objects over time. Each event entry displays the automation name, effect and fallback action (if applicable), event details, outcome (success, failure, or fallback triggered), and triggering objects. Executions are grouped by batches, aligned with the Automate history view, so you can see each execution alongside the individual objects within the run.
You can filter events by the following:
- Time range: Scope to a specific period.
- Outcome: Filter to successes, failures, fallback actions triggered, or successful events that produced no edits.
- Retries: Isolate automations that retried, helping you identify candidates for optimization.
- Automation: Focus on events for a specific automation.
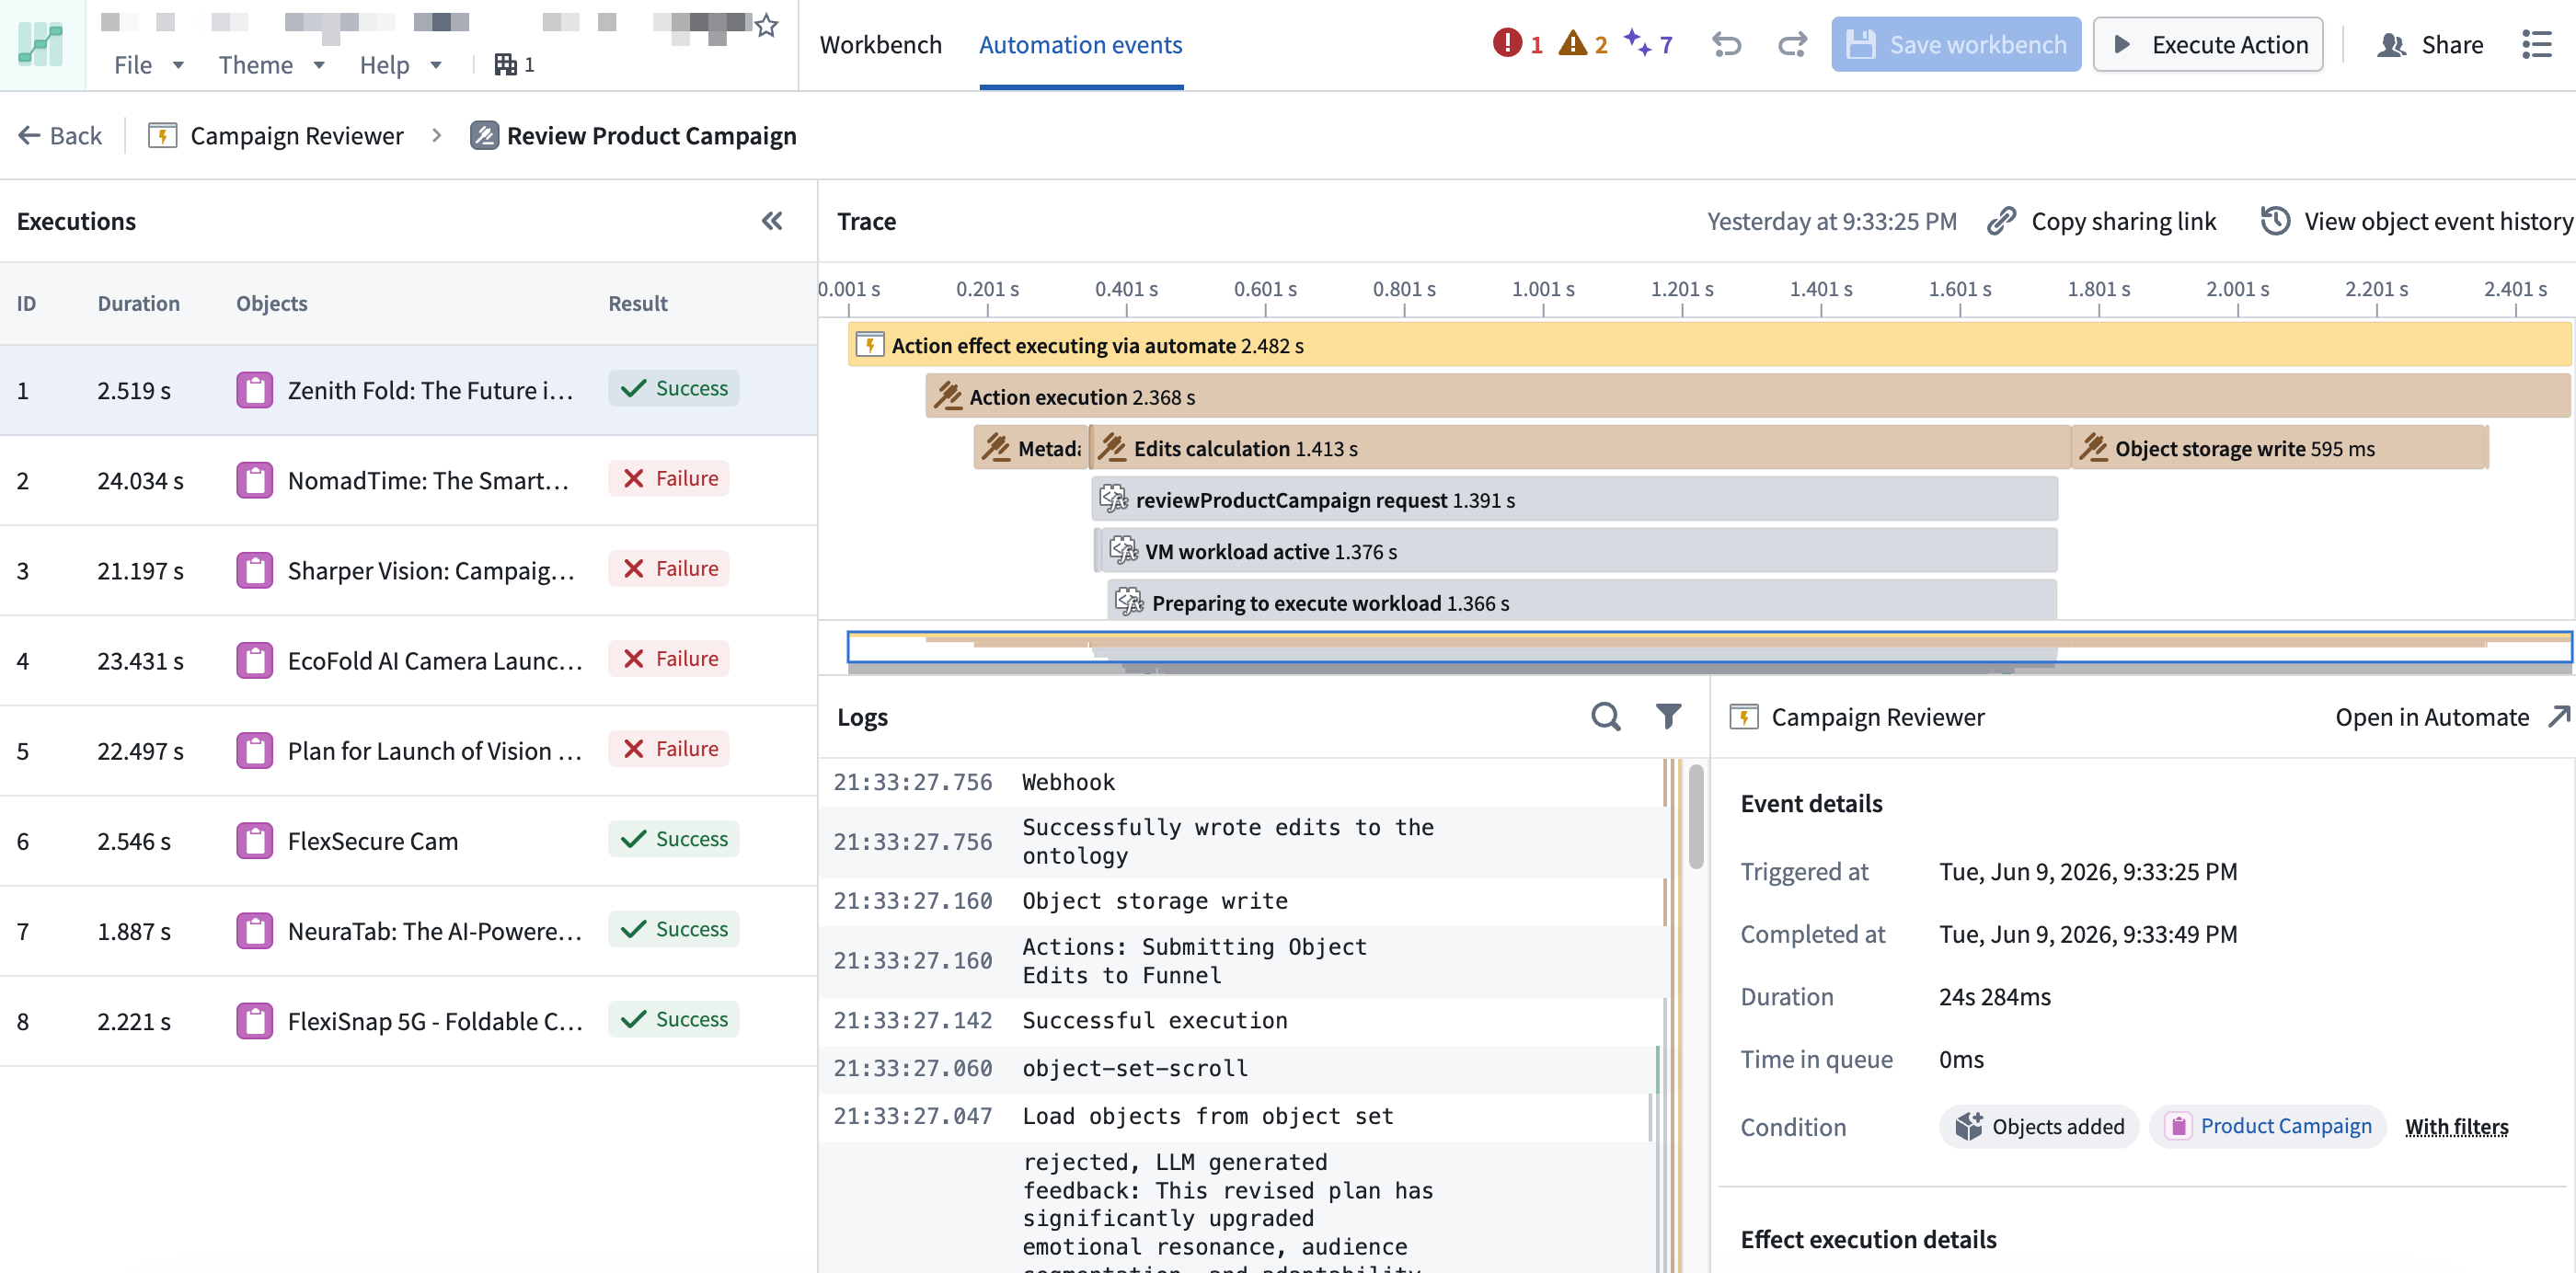
Select any event to drill into per-object trace logs with step-by-step details, inline links to related resources, error messages and stack traces for failures, and timing information to spot performance bottlenecks. Much of this context surfaces directly in Autopilot, so you can investigate without traversing multiple products within the platform.
:::callout{theme="neutral"}
For more granular logs, consider using console in your TypeScript functions or import logging in your Python functions.
:::
Troubleshooting tips
Use the following best practices to help you troubleshoot failures in your automations:
- Filter to failed events to find what broke in the automation path.
- Select a failed event to read the trace logs and error messages.
- Navigate to the affected object to view its full history across all automations.
- Compare failed and successful events of the same automation to spot patterns.
- Follow inline resource links to the automations, functions, and objects involved.
Monitor system health
Beyond debugging, the Automation events tab provides ongoing visibility into system performance over time. Use it to track how frequently automations run, where failure rates are increasing, which automations are processing the most events, and whether event times are growing. Monitoring these trends helps you identify and address issues before they affect your workflow.
中文翻译
自动化事件
自动化事件选项卡提供工作台中所有自动化事件的可观测性。您可以监控系统性能、从自动化层面深入至逻辑模块排查故障,并了解自动化如何随时间推移处理对象。每个事件条目均显示自动化名称、效果及回退操作(如适用)、事件详情、结果(成功、失败或触发回退)以及触发对象。执行记录按批次分组,与自动化历史视图保持一致,使您能够同时查看每次执行及其运行中的各个对象。
您可以通过以下条件筛选事件:
- 时间范围: 限定特定时间段。
- 结果: 筛选成功、失败、已触发的回退操作,或未产生任何编辑的成功事件。
- 重试: 筛选出已重试的自动化,帮助您识别可优化的候选对象。
- 自动化: 聚焦特定自动化的事件。
选择任意事件即可深入查看每个对象的跟踪日志,其中包含逐步详情、相关资源的内联链接、失败时的错误消息及堆栈跟踪,以及用于发现性能瓶颈的时间信息。这些上下文信息大多可直接在 Autopilot 中呈现,因此您无需在平台内切换多个产品即可进行调查。
:::callout{theme="neutral"}
如需更精细的日志,建议在 TypeScript 函数中使用 console,或在 Python 函数中使用 import logging。
:::
故障排查技巧
请遵循以下最佳实践来排查自动化中的故障:
- 筛选失败事件,找出自动化路径中的故障点。
- 选择某个失败事件,查看跟踪日志和错误消息。
- 导航至受影响的对象,查看其在所有自动化中的完整历史记录。
- 比较同一自动化的失败事件与成功事件,发现规律。
- 点击内联资源链接,跳转至相关的自动化、函数和对象。
监控系统健康状态
除调试功能外,自动化事件选项卡还提供系统性能随时间变化的持续可见性。您可以使用它来跟踪自动化的运行频率、故障率上升的位置、处理事件最多的自动化,以及事件处理时间是否增长。监控这些趋势有助于您在问题影响工作流之前及时发现并解决它们。