Dependency graph view(依赖关系图视图)
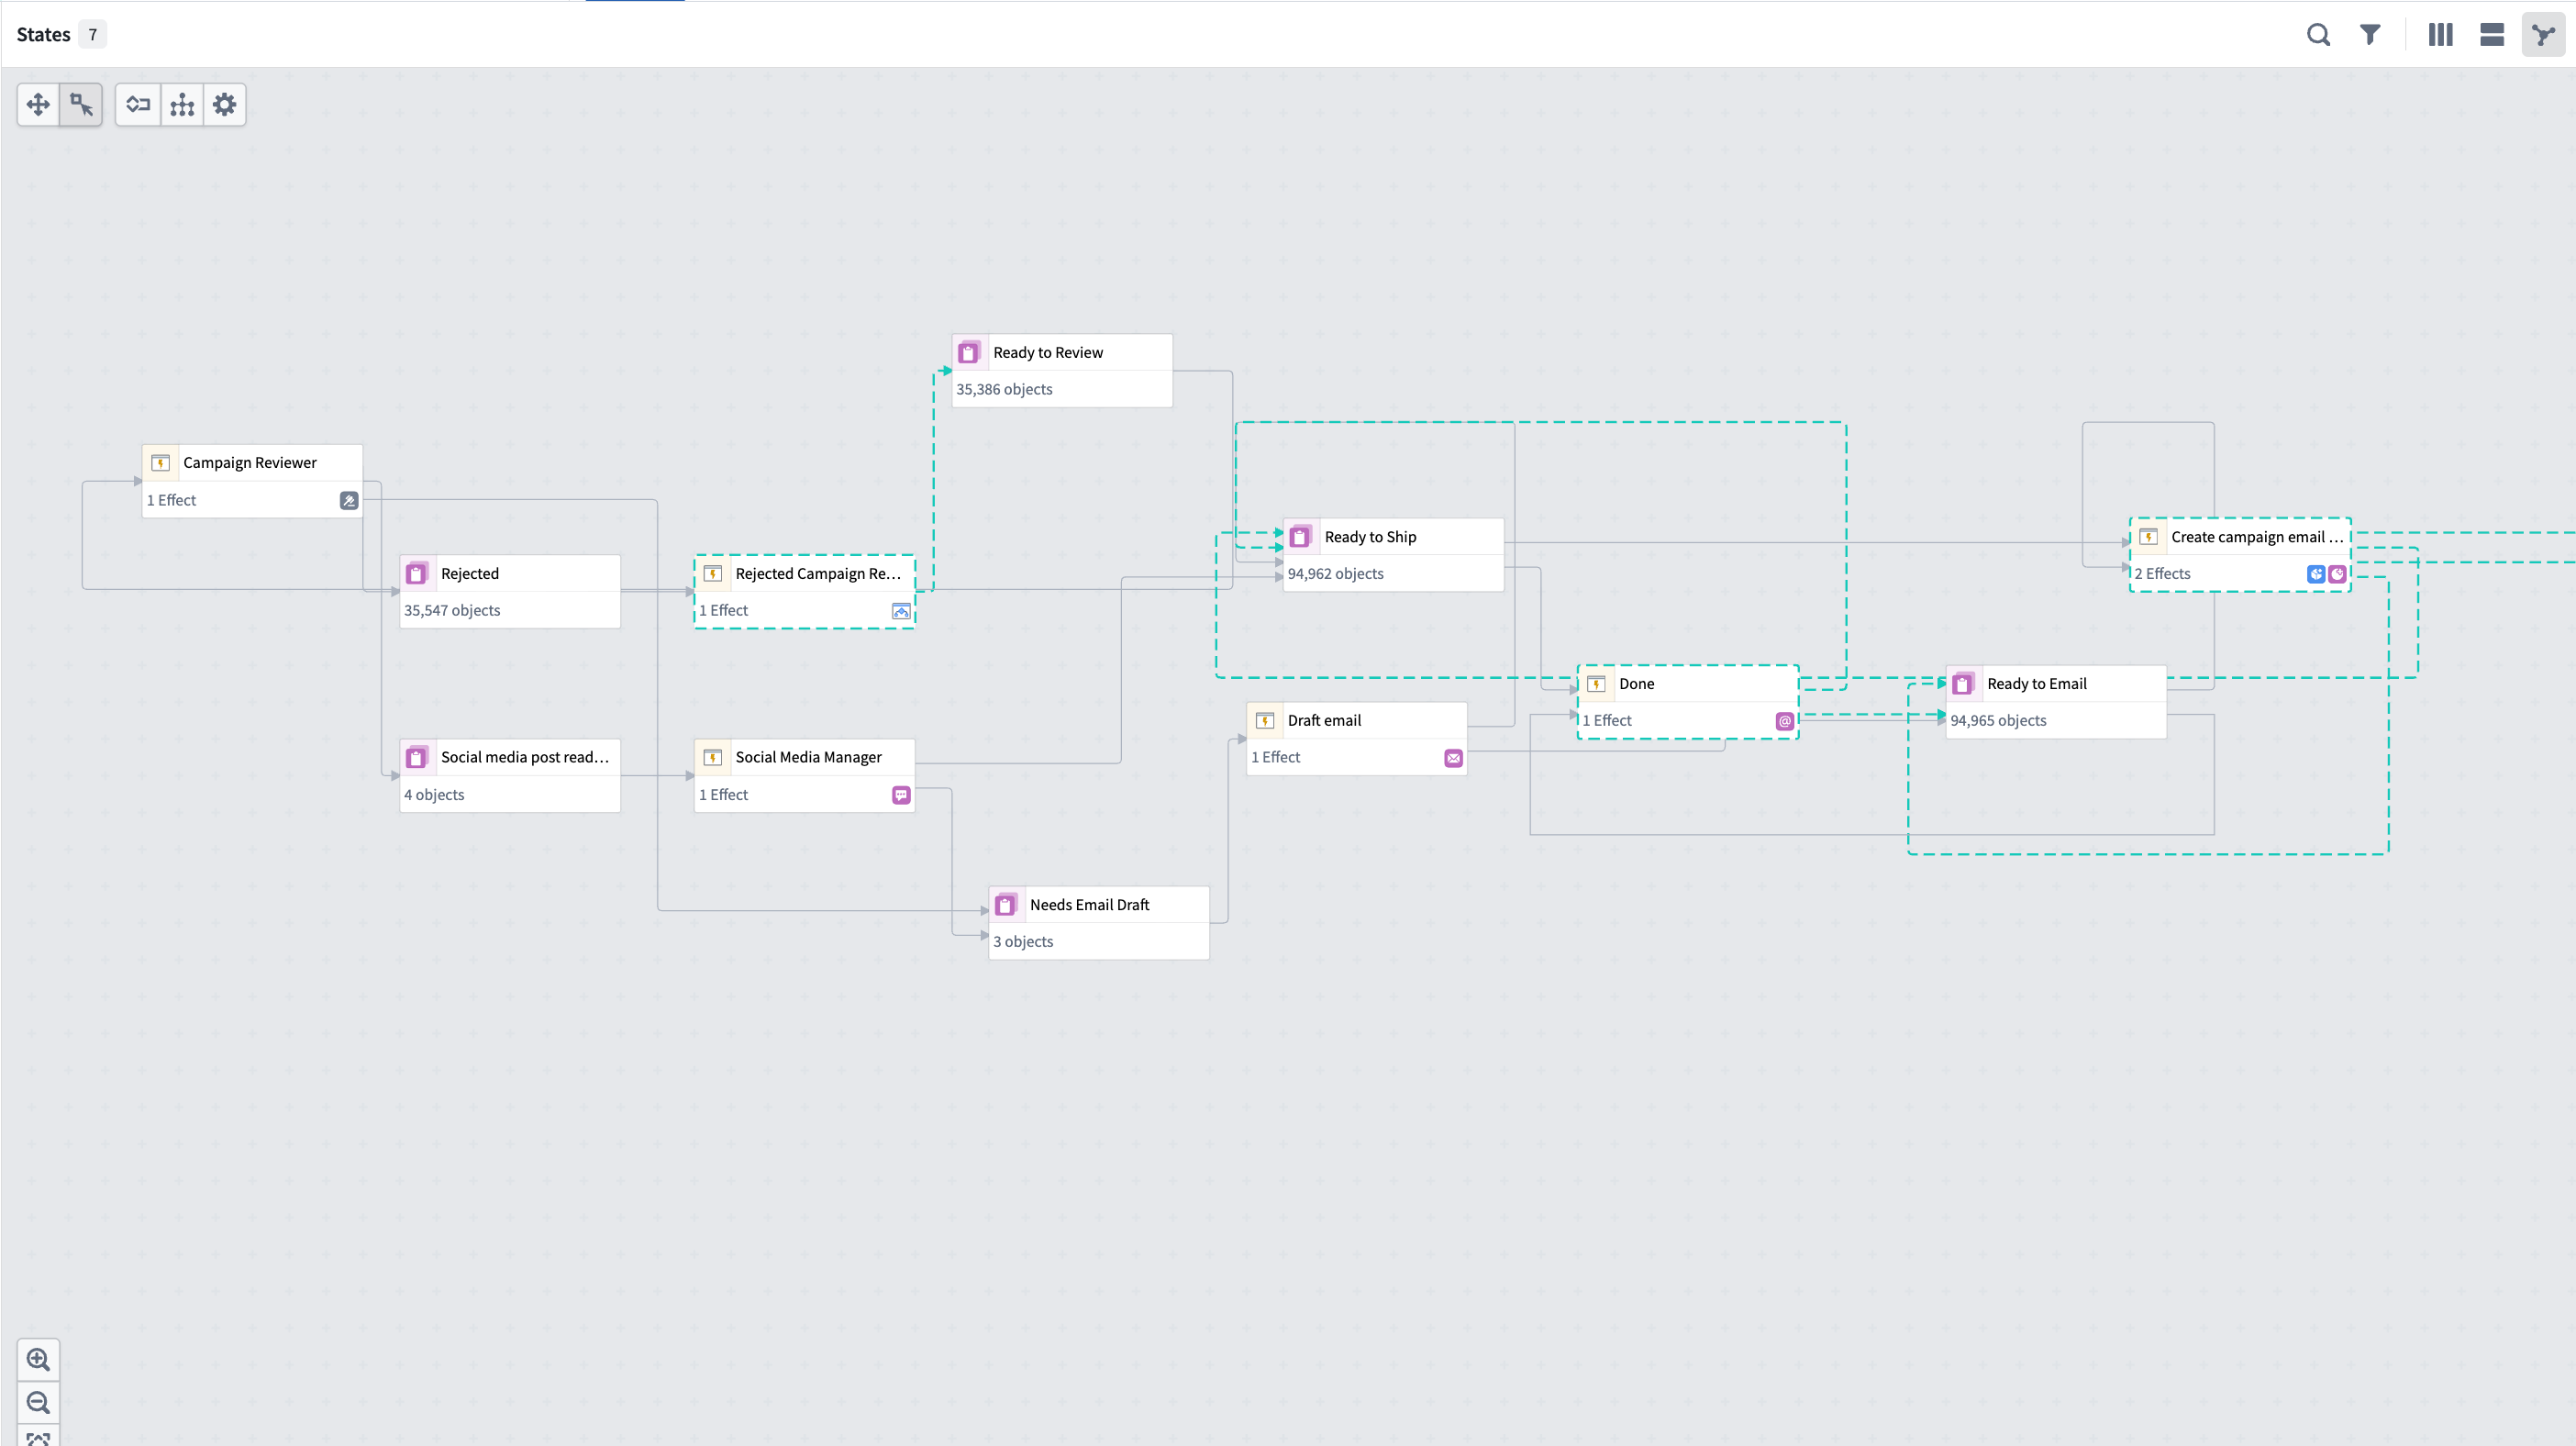
Autopilot's graph view displays the complete dependency graph of your automation system, showing all automations, actions, functions, logic functions, and their relationships. This view helps you understand the architecture of your workflow, identify dependencies, and troubleshoot issues across your automation system.
The dependency graph is composed of nodes and edges:
- Nodes: Represent automations (composed of actions and logic) and Workshop applications (also composed of actions). Together, these show both automated and human-driven components of your workflow.
- Edges: Show dependencies and execution flow between nodes.
Human vs. automation components
The graph distinguishes between human-driven and automated components of your workflow:
- Workshop nodes: Human actions and Workshop applications appear as distinct nodes on the graph.
- Transition breakdown: View which state transitions are driven by human actions rather than automation.
- Collaboration patterns: Understand where humans and automation interact in your workflow.
Historical object paths
View the historical path of an object as it moves through your workflow over time. When you select an object, you can display its path on the graph to view the following:
- The states the object has passed through
- The automations that processed the object at each stage
- The sequence and timing of state transitions
Liveness indicators
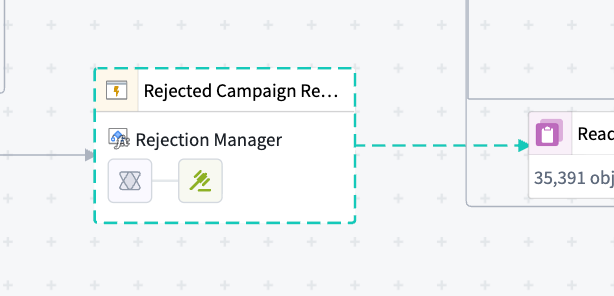
When automations are actively executing, the graph displays real-time indicators:
- Animated dotted lines: Active processing appears as animated dotted lines on the edges connecting to the states where objects are currently being processed.
- Node highlights: Automations that are currently running are highlighted on the graph.
These indicators provide immediate visibility into system activity and help you monitor automation execution in real time.
Graph controls and navigation
Use the graph controls toolbar and navigation features to explore your workflow:
- Auto-layout: Automatically organize nodes to minimize edge crossings and improve readability.
- Edge styling: Choose between orthogonal (right-angled) or curved edges.
- Expand all nodes: Expand all collapsed sections of the graph to view the full workflow structure. When you expand nodes, you can see fallback effects configured in your automations.
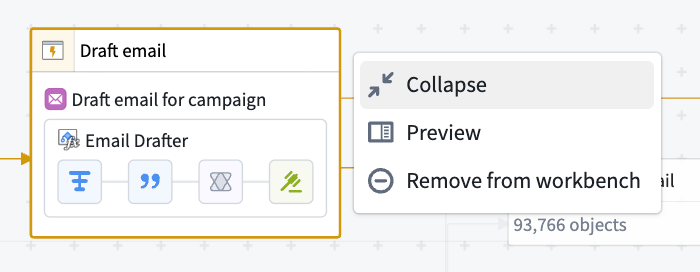
- Select nodes: Select any node to view details in the right side panel.
- Remove nodes: Choose a node, then select Remove from workbench to remove it from your graph view.
中文翻译
依赖关系图视图
Autopilot 的图形视图展示了自动化系统的完整依赖关系图,显示所有自动化流程、操作、函数、逻辑函数及其相互关系。该视图有助于理解工作流的架构、识别依赖关系,并在整个自动化系统中排查问题。
依赖关系图由节点和边组成:
- 节点: 代表自动化流程(由操作和逻辑组成)和 Workshop 应用程序(也由操作组成)。两者共同展示工作流中自动化与人工驱动的组件。
- 边: 显示节点之间的依赖关系和执行流向。
人工与自动化组件
该图区分了工作流中人工驱动与自动化的组件:
- Workshop 节点: 人工操作和 Workshop 应用程序在图中显示为独立节点。
- 转换分解: 查看哪些状态转换由人工操作驱动,而非自动化流程。
- 协作模式: 了解工作流中人工与自动化的交互节点。
历史对象路径
查看对象随时间在工作流中移动的历史路径。选择某个对象后,可在图上显示其路径,以查看以下内容:
- 对象经过的状态
- 每个阶段处理该对象的自动化流程
- 状态转换的顺序与时间
活跃度指示器
当自动化流程正在执行时,图表会显示实时指示器:
- 动画虚线: 活跃处理过程以动画虚线形式显示在连接当前处理对象状态的边上。
- 节点高亮: 当前正在运行的自动化流程在图中高亮显示。
这些指示器可即时呈现系统活动状态,帮助您实时监控自动化执行情况。
图形控制与导航
使用图形控制工具栏和导航功能探索工作流:
- 自动布局: 自动组织节点,最大限度减少边交叉,提升可读性。
- 边样式: 选择正交(直角)或曲线边。
- 展开所有节点: 展开图中所有折叠部分,查看完整工作流结构。展开节点后,可查看自动化流程中配置的回退效果。
- 选择节点: 选择任意节点,在右侧面板查看详情。
- 移除节点: 选中节点后,选择从工作台移除,将其从图形视图中删除。