Workbench(工作台(Workbench))
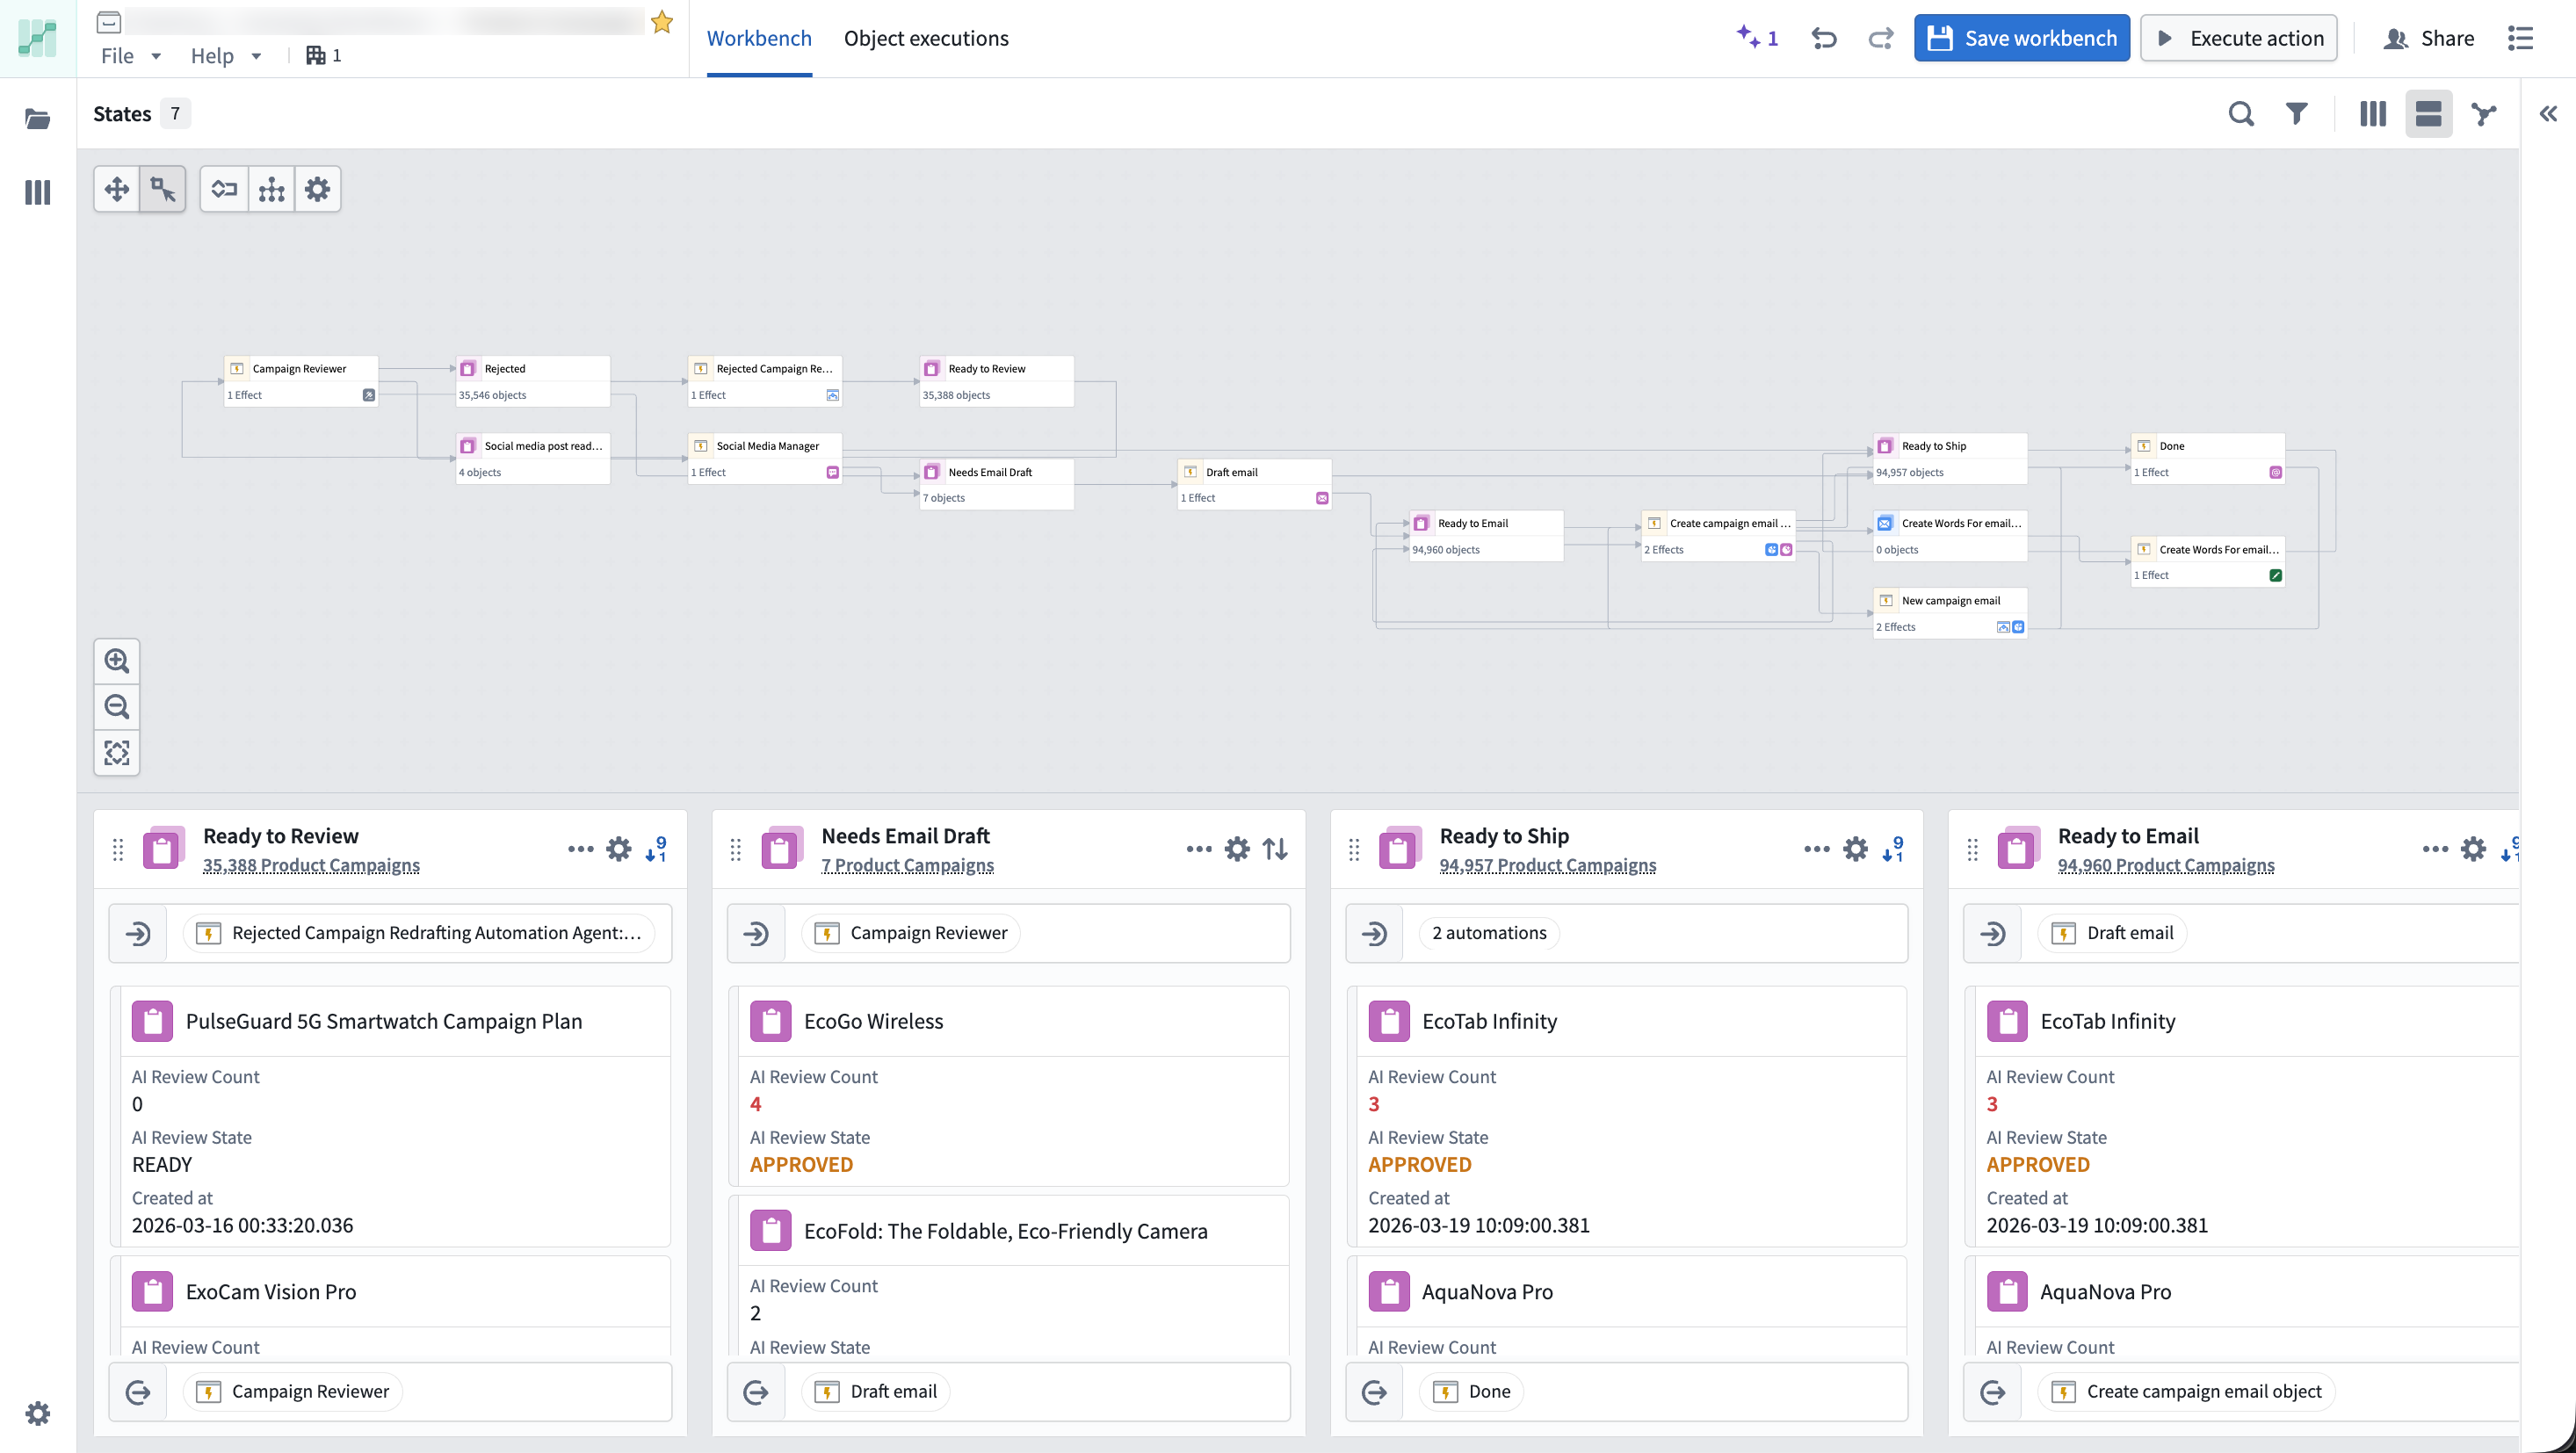
The Autopilot workbench provides two coordinated views for visualizing and managing your automation workflows: Kanban boards and dependency graphs. You can switch between these views or display them side by side.
You can search for any object using Cmd+F (macOS) or Ctrl+F (Windows), filter to objects linked to a selected object, and view live indicators showing which automations are currently executing.
Kanban and graph views
Use the view selector in the top toolbar to switch between the different options:
- Kanban view: View your state-based workflow where each column represents a state and each card is an object.
- Graph view: Explore the dependency graph of your automation system, understand automation relationships, and visualize historical paths for each object.
- Split view: View both the Kanban board and graph simultaneously.
States
States represent distinct stages in your automation workflow. Each state corresponds to a column in the Kanban board and a node on the graph, and defines where objects are in their lifecycle.
States are automatically inferred from your automations or can be manually defined. Autopilot analyzes your automation conditions and effects to generate initial states, which you can then customize to match your workflow needs.
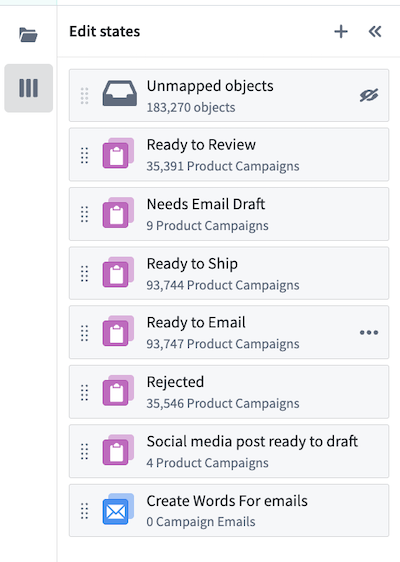
Manage all states in the sidebar
Use the States sidebar on the left to manage your workflow states:
- Add states: Create custom states to represent additional steps in your workflow.
- Reorder states: Drag and drop states to reorganize the column ordering in your Kanban board.
- Focus a state: Zoom to a specific state on both the graph and Kanban views.
- Configure a state: Select a state to open the configuration panel.
- Delete a state: Remove states that are no longer relevant to your workflow.
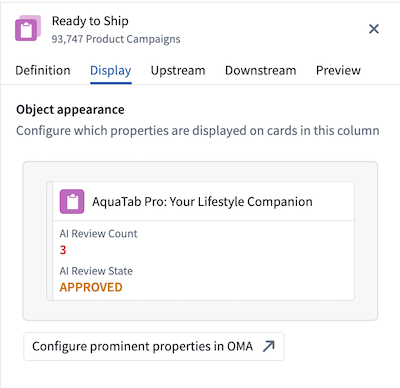
Configure each state
To configure your state, choose a state in the States sidebar or select the cog button in the top right corner of a column header. The right side panel opens to display the following:
- Definition: Configure which object types belong in this state and conditions for objects to enter or exit. You can also rename the state.
- Display: Customize the column name, color, and icon.
- Upstream and Downstream: View historical transitions (last 100 edits) for objects entering this state (Upstream) and leaving this state (Downstream) with a breakdown of manual and automated transitions to monitor workflow automation levels.
- Preview: View how the Kanban column appears in your workbench, including the list of objects currently in that column.
中文翻译
工作台(Workbench)
Autopilot 工作台提供两种协同视图,用于可视化管理自动化工作流:看板视图(Kanban boards)和依赖关系图(dependency graphs)。您可以在两种视图间切换,或并排显示。
您可以使用 Cmd+F(macOS)或 Ctrl+F(Windows)搜索任意对象,筛选与选定对象关联的条目,并查看实时指示器了解当前正在执行的自动化任务。
看板视图与图形视图
使用顶部工具栏中的视图选择器切换不同选项:
- 看板视图(Kanban view):查看基于状态的工作流,每列代表一个状态,每张卡片代表一个对象。
- 图形视图(Graph view):探索自动化系统的依赖关系图,理解自动化间的关联,并查看每个对象的历史路径。
- 分屏视图(Split view):同时显示看板视图和图形视图。
状态(States)
状态代表自动化工作流中的不同阶段。每个状态对应看板视图中的一列和图形视图中的一个节点,定义对象在其生命周期中所处的位置。
状态可从自动化任务中自动推断,也可手动定义。Autopilot 会分析您的自动化条件和效果以生成初始状态,您随后可根据工作流需求进行自定义。
在侧边栏中管理所有状态
使用左侧的状态(States)侧边栏管理工作流状态:
- 添加状态(Add states):创建自定义状态,代表工作流中的额外步骤。
- 重新排序状态(Reorder states):拖放状态以重新组织看板视图中的列顺序。
- 聚焦状态(Focus a state):在图形视图和看板视图中同时放大显示特定状态。
- 配置状态(Configure a state):选择状态以打开配置面板。
- 删除状态(Delete a state):移除工作流中不再相关的状态。
配置每个状态
要配置状态,请在状态(States)侧边栏中选择一个状态,或点击列标题右上角的齿轮按钮。右侧面板将打开并显示以下内容:
- 定义(Definition):配置哪些对象类型属于此状态,以及对象进入或退出该状态的条件。您还可以重命名状态。
- 显示(Display):自定义列名称、颜色和图标。
- 上游与下游(Upstream and Downstream):查看对象进入此状态(上游)和离开此状态(下游)的历史转换记录(最近 100 次编辑),并包含手动与自动转换的细分数据,以监控工作流自动化水平。
- 预览(Preview):查看看板列在工作台中的显示效果,包括当前位于该列中的对象列表。