Visualize experiments(可视化实验(Visualize experiments))
Once published alongside a model version, experiments are immediately available to view and compare on the model page under the Experiments tab.
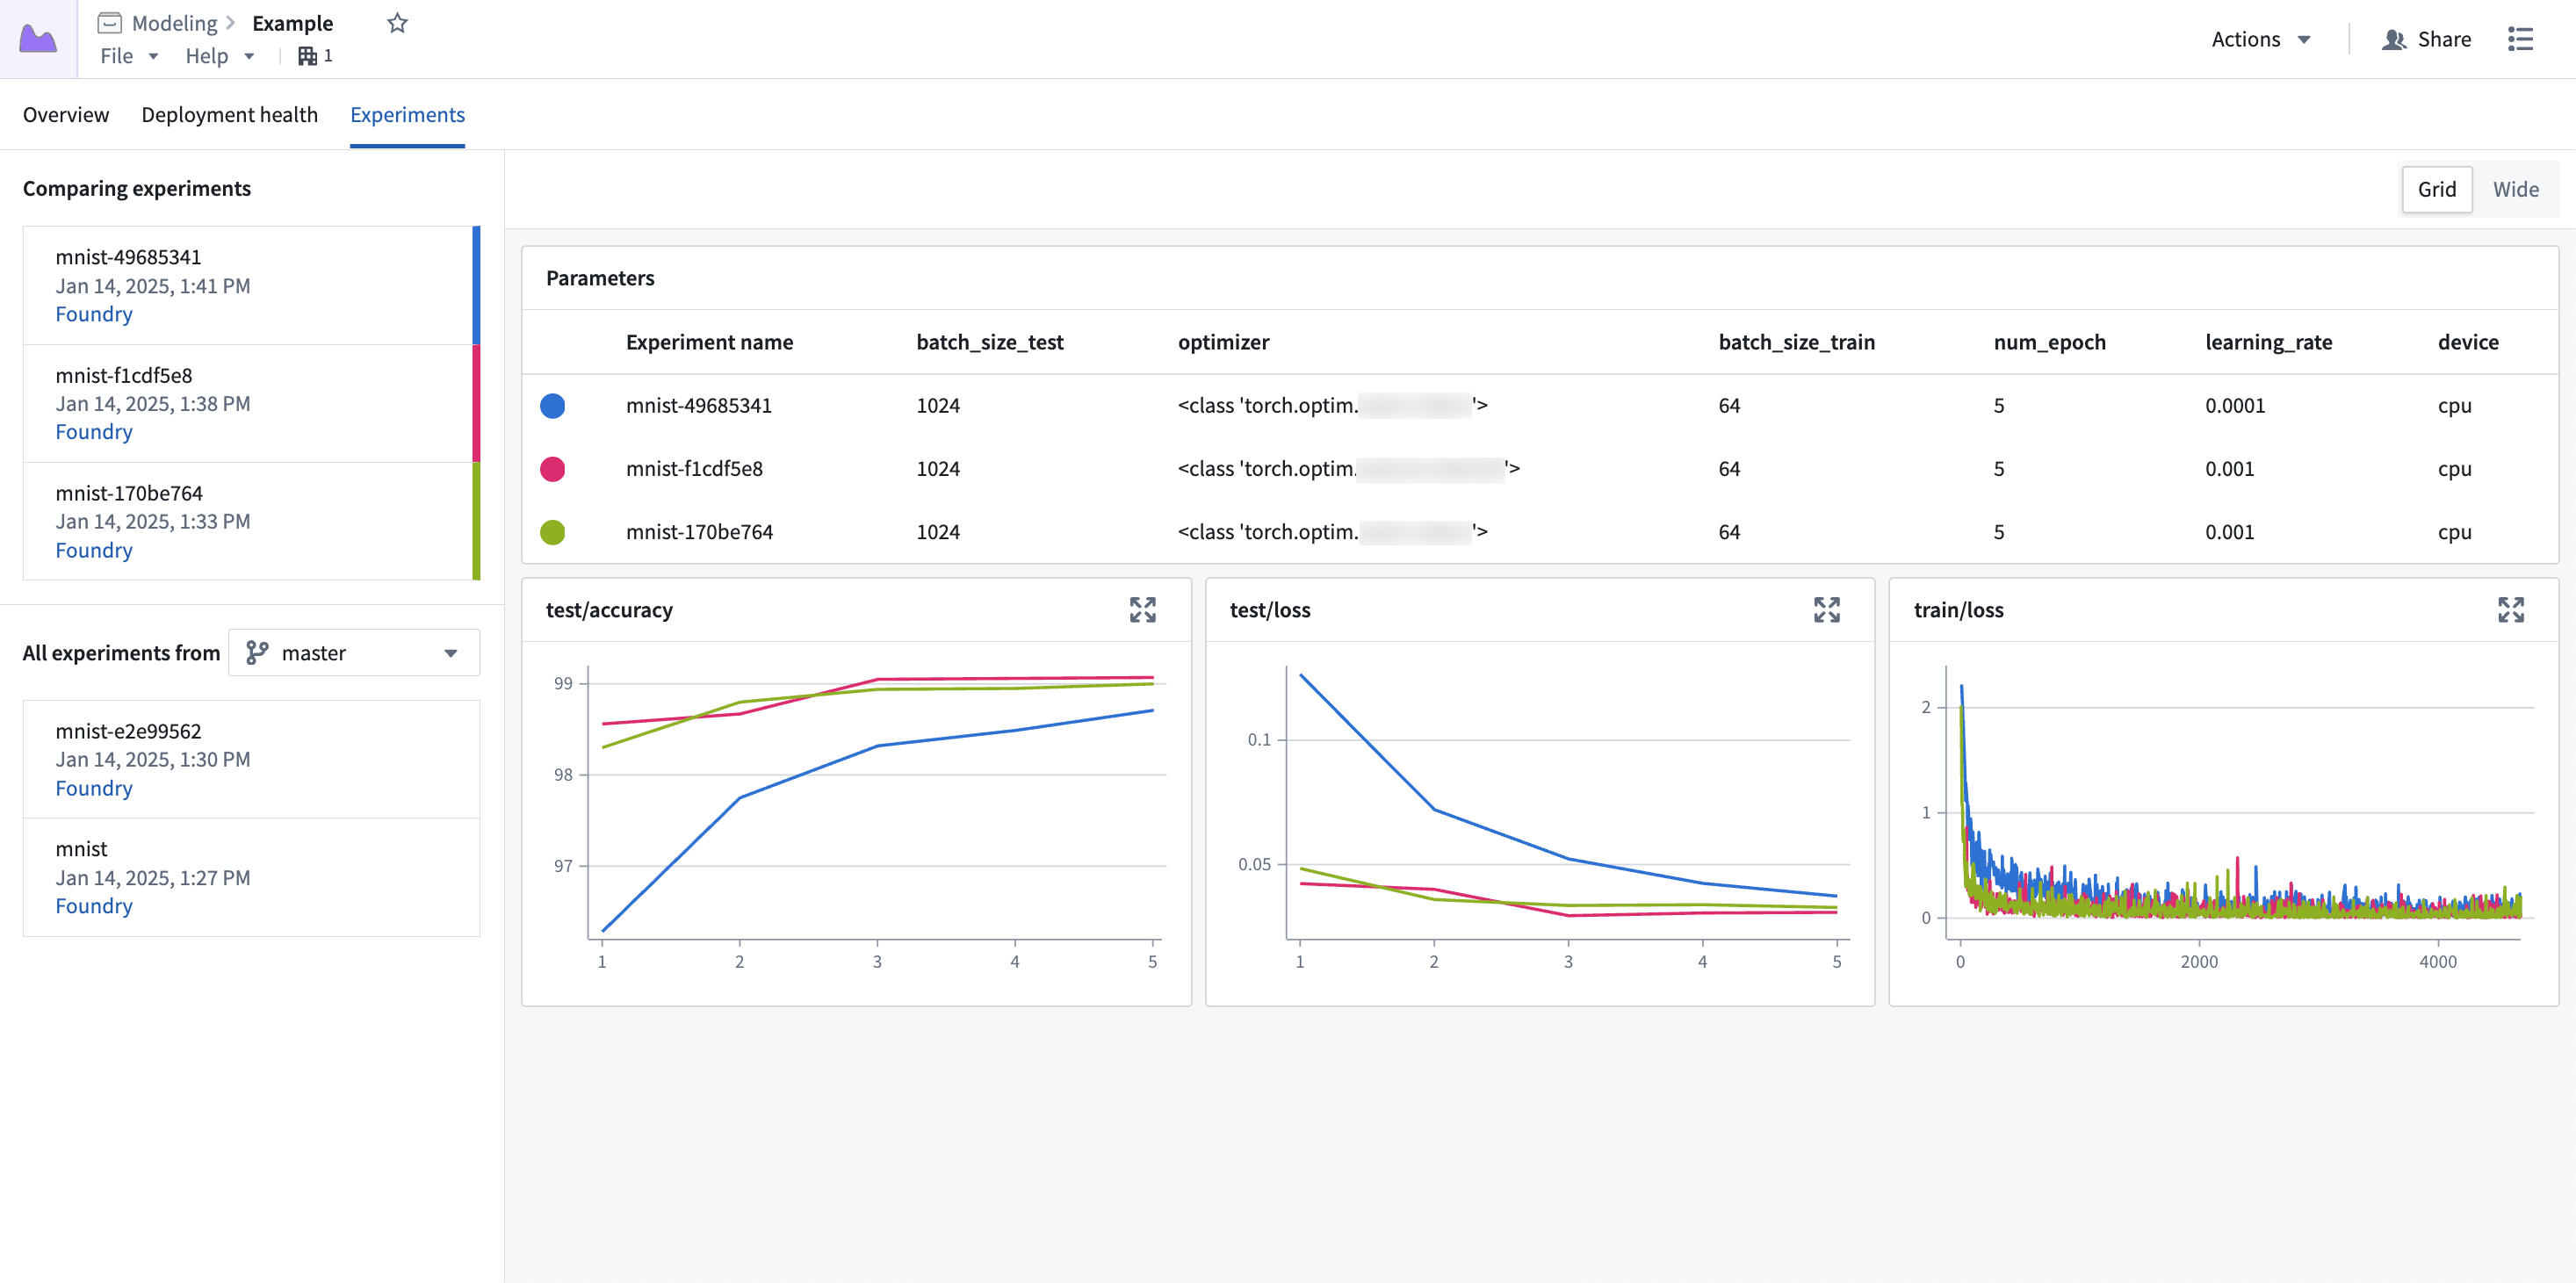
Experiment data is displayed with a hyperparameter table at the top, followed by line charts for each of the metrics. Each row of the hyperparameter table represents a single experiment, with each experiment's metric data overlaid on the charts.
Select experiments
By default, only the latest experiment is selected for visualization. To populate the view with more experiments, select the + icon next to any experiment in the left sidebar.
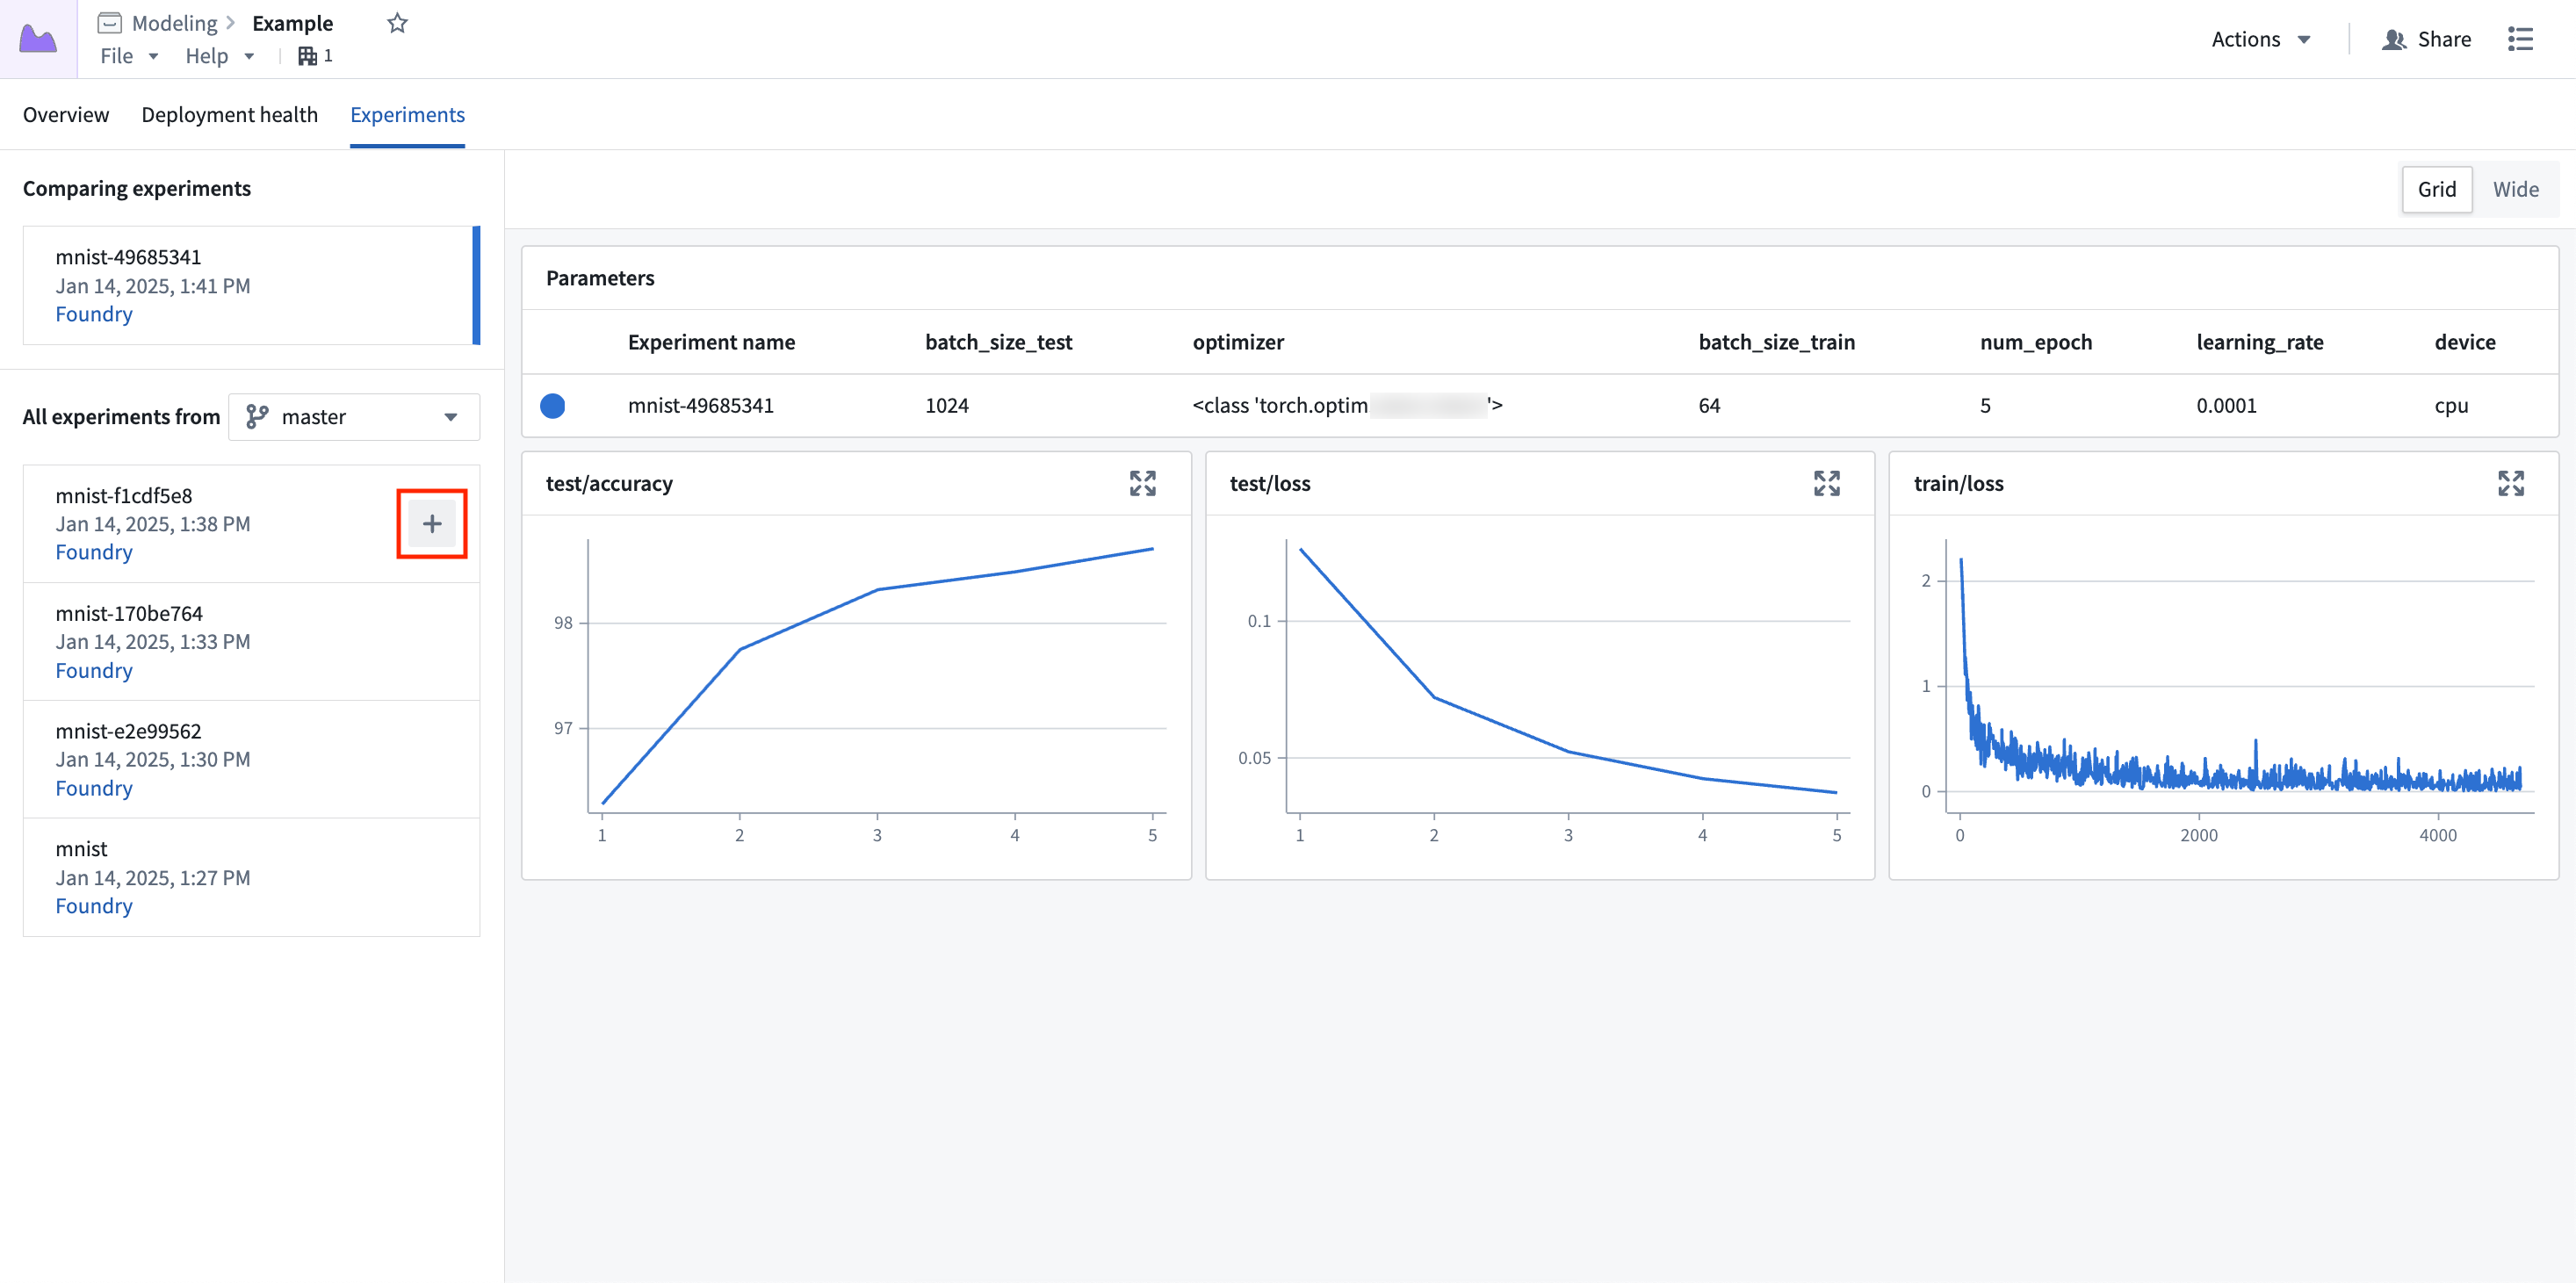
Up to five experiments can be selected for comparison at once.
Expand charts
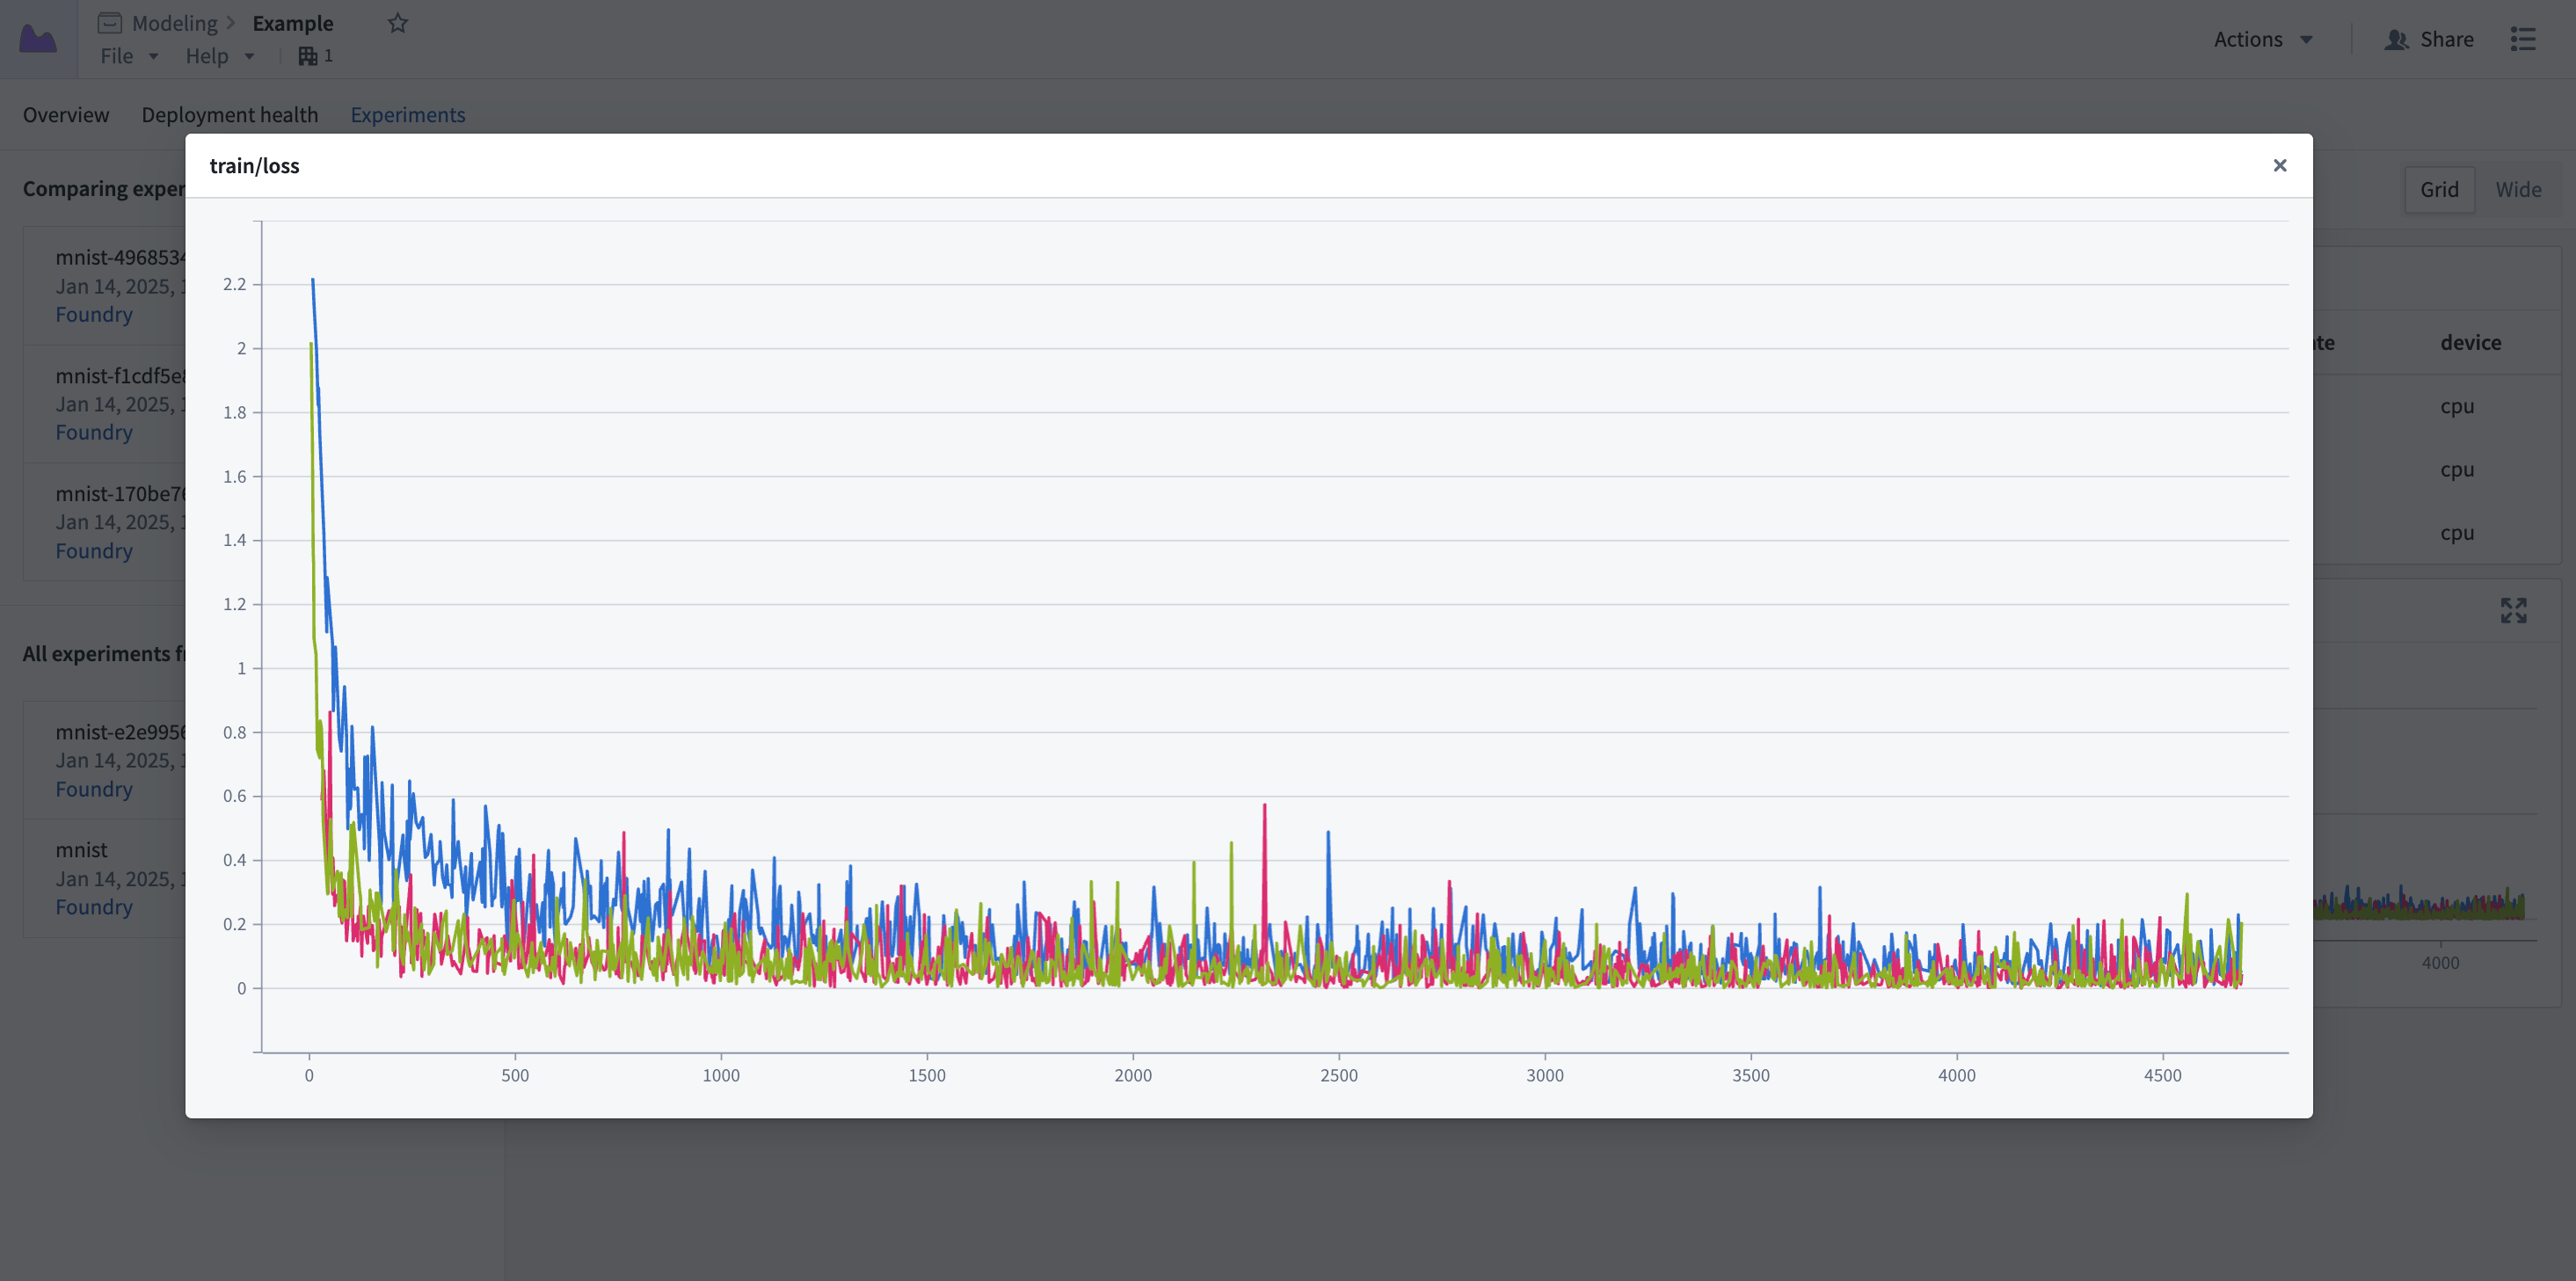
Metric charts can be expanded to a larger view for a more in-depth view of the metric data.
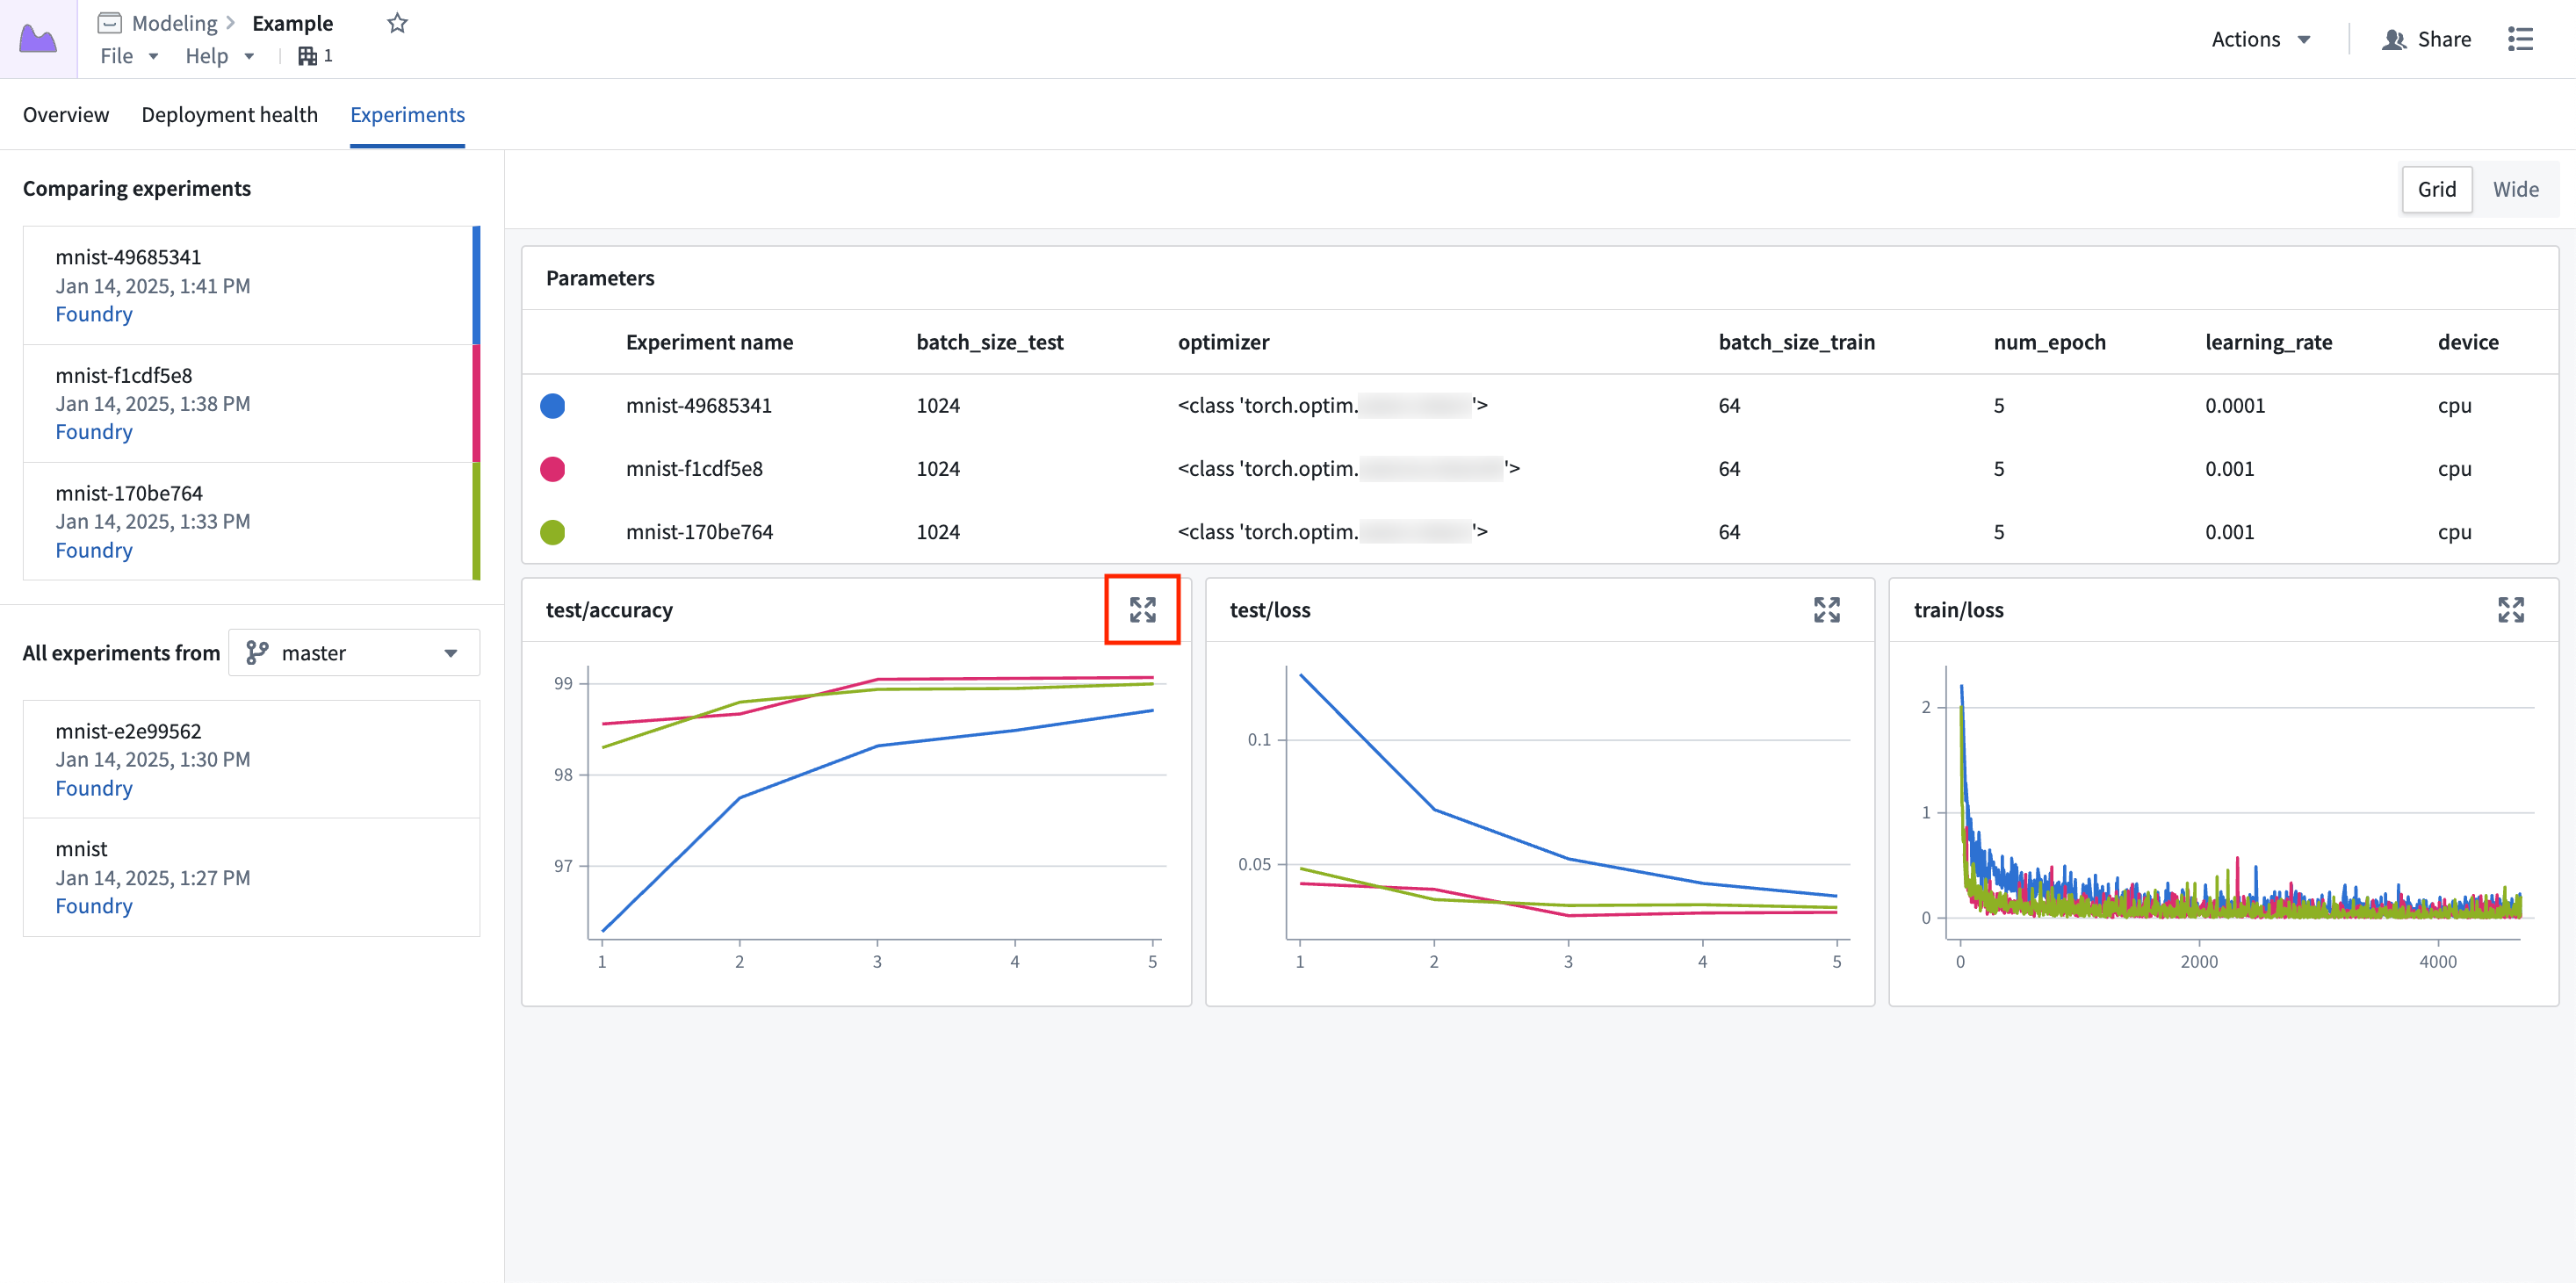
Select the expand button to open the experiment in a pop-up dialog.
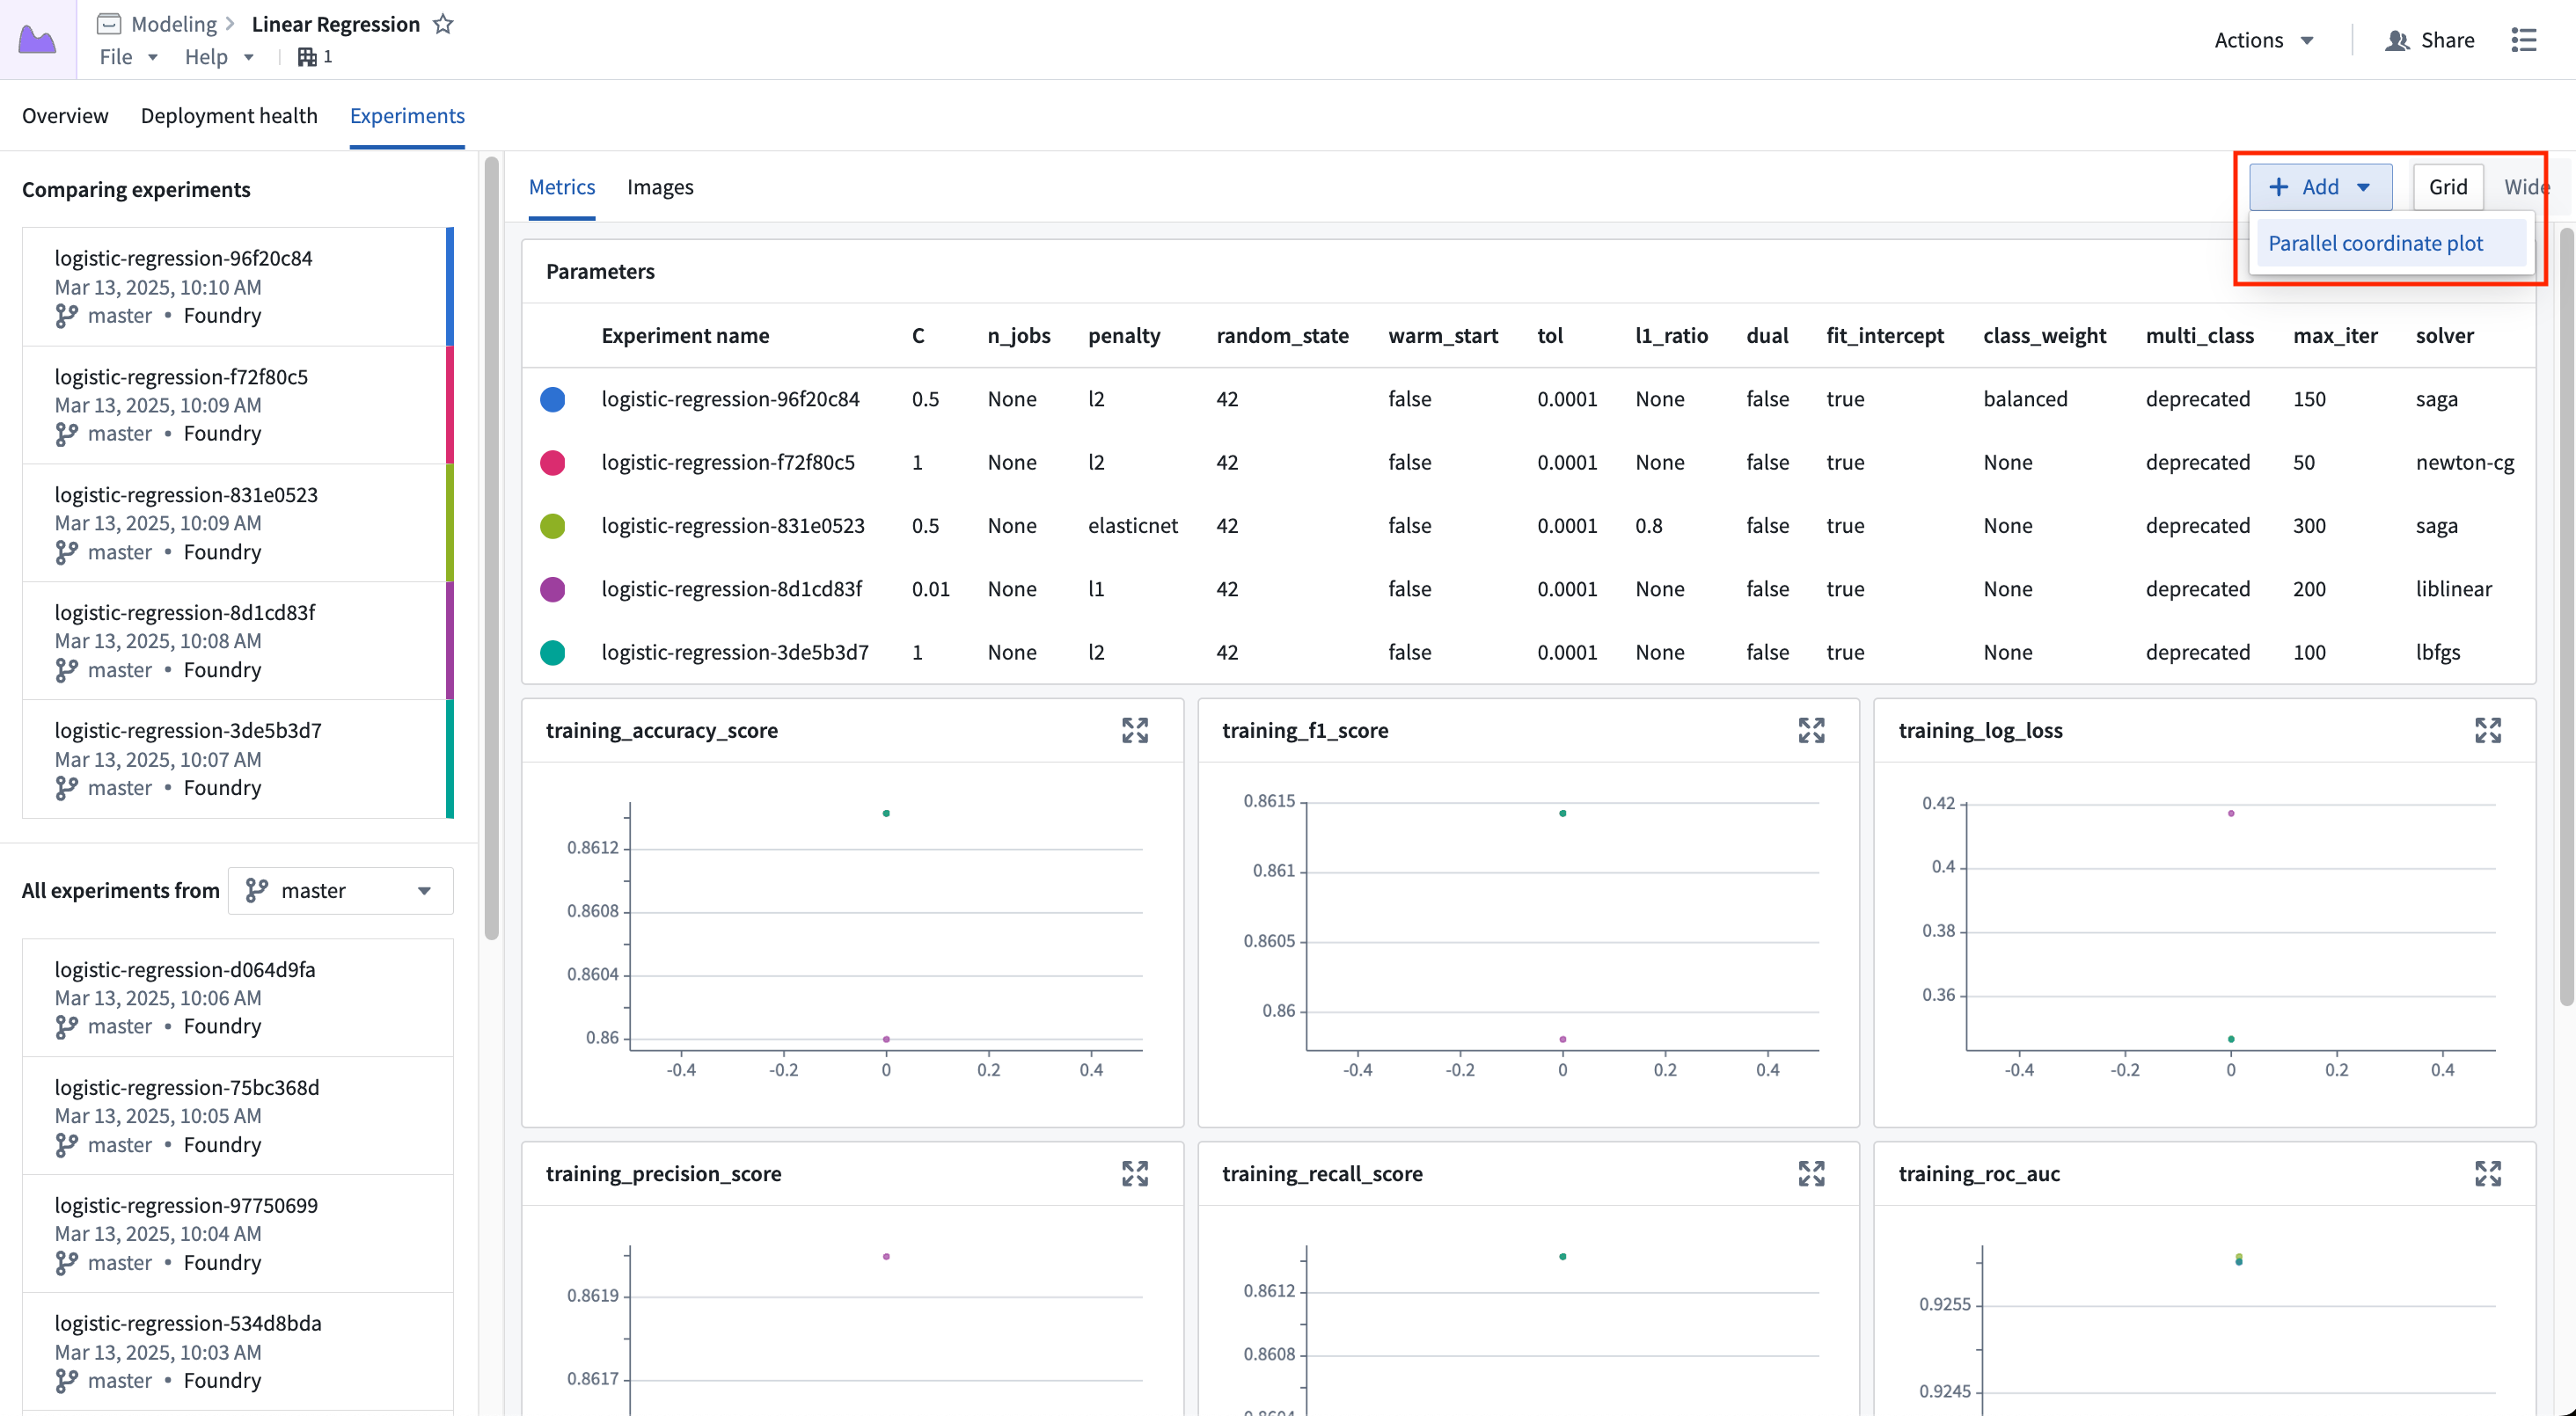
Parallel coordinate plot
A parallel coordinate plot can help users understand how a change in a parameter value might affect the end result of a training job. To add a parallel coordinate plot to the view, select Add and then Parallel coordinate plot.
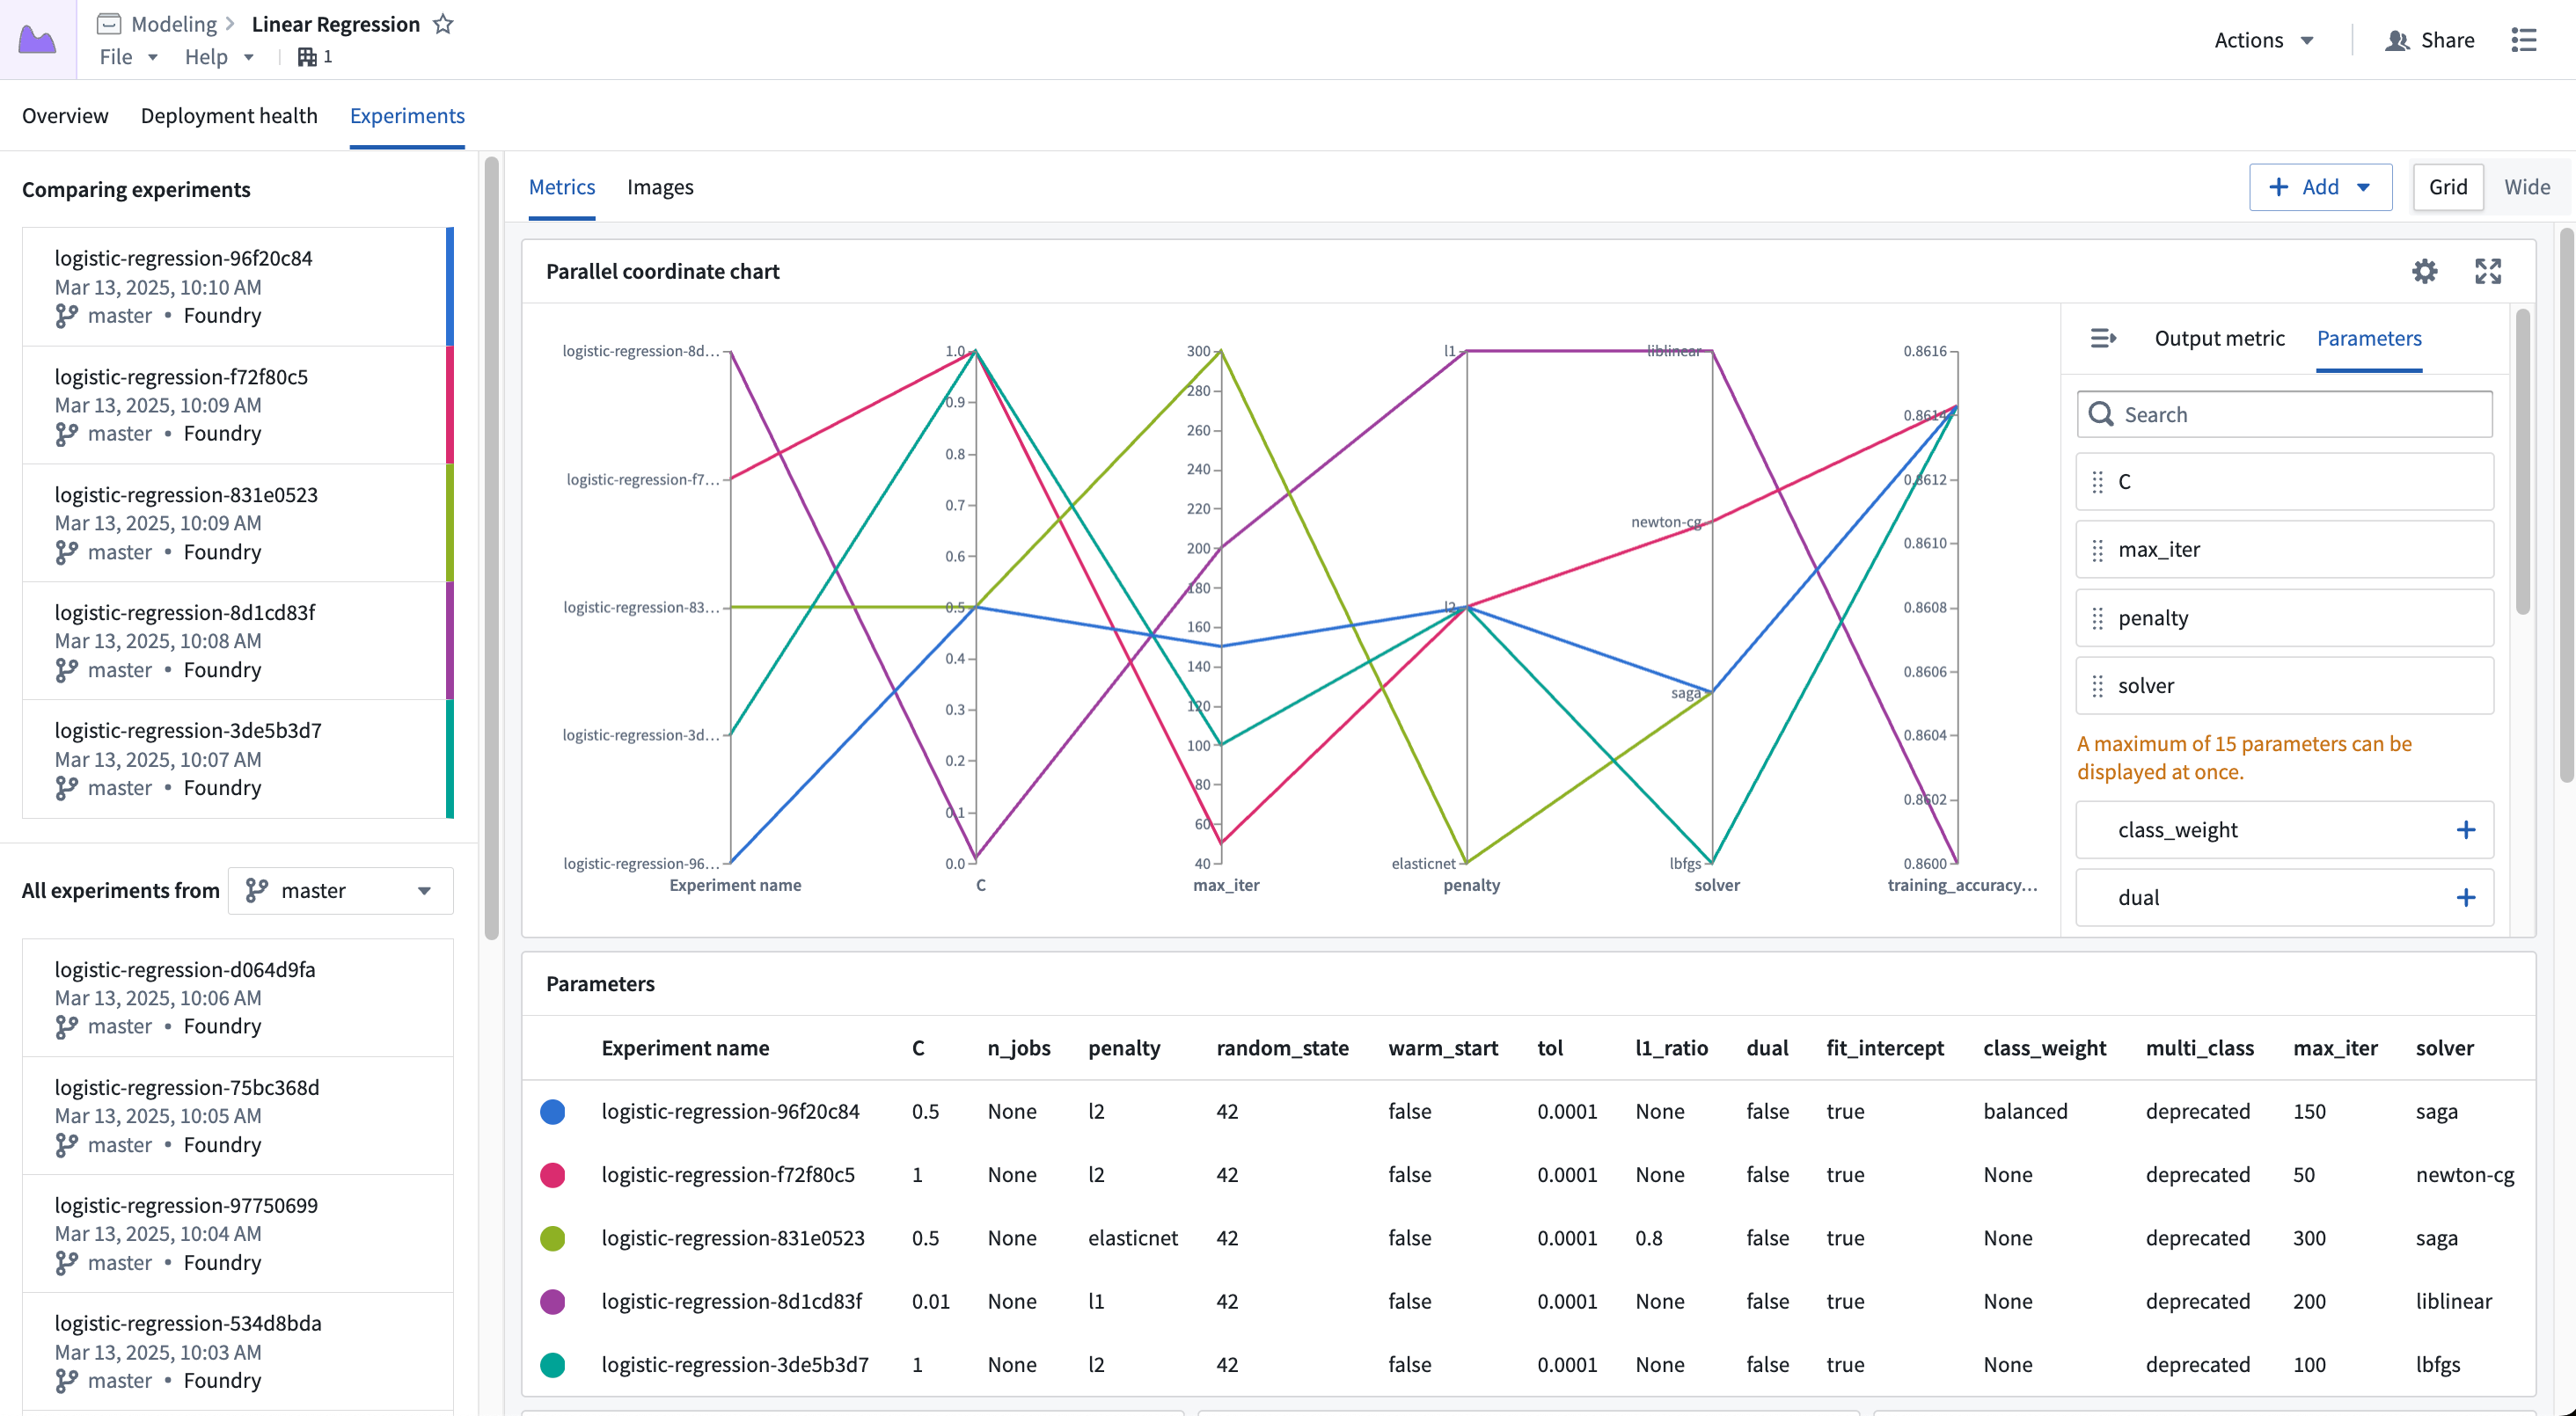
Once the new chart has been added, you can configure which parameters to show and what output metric value to render. Any parameter logged to any of the currently selected experiments may be added to the view.
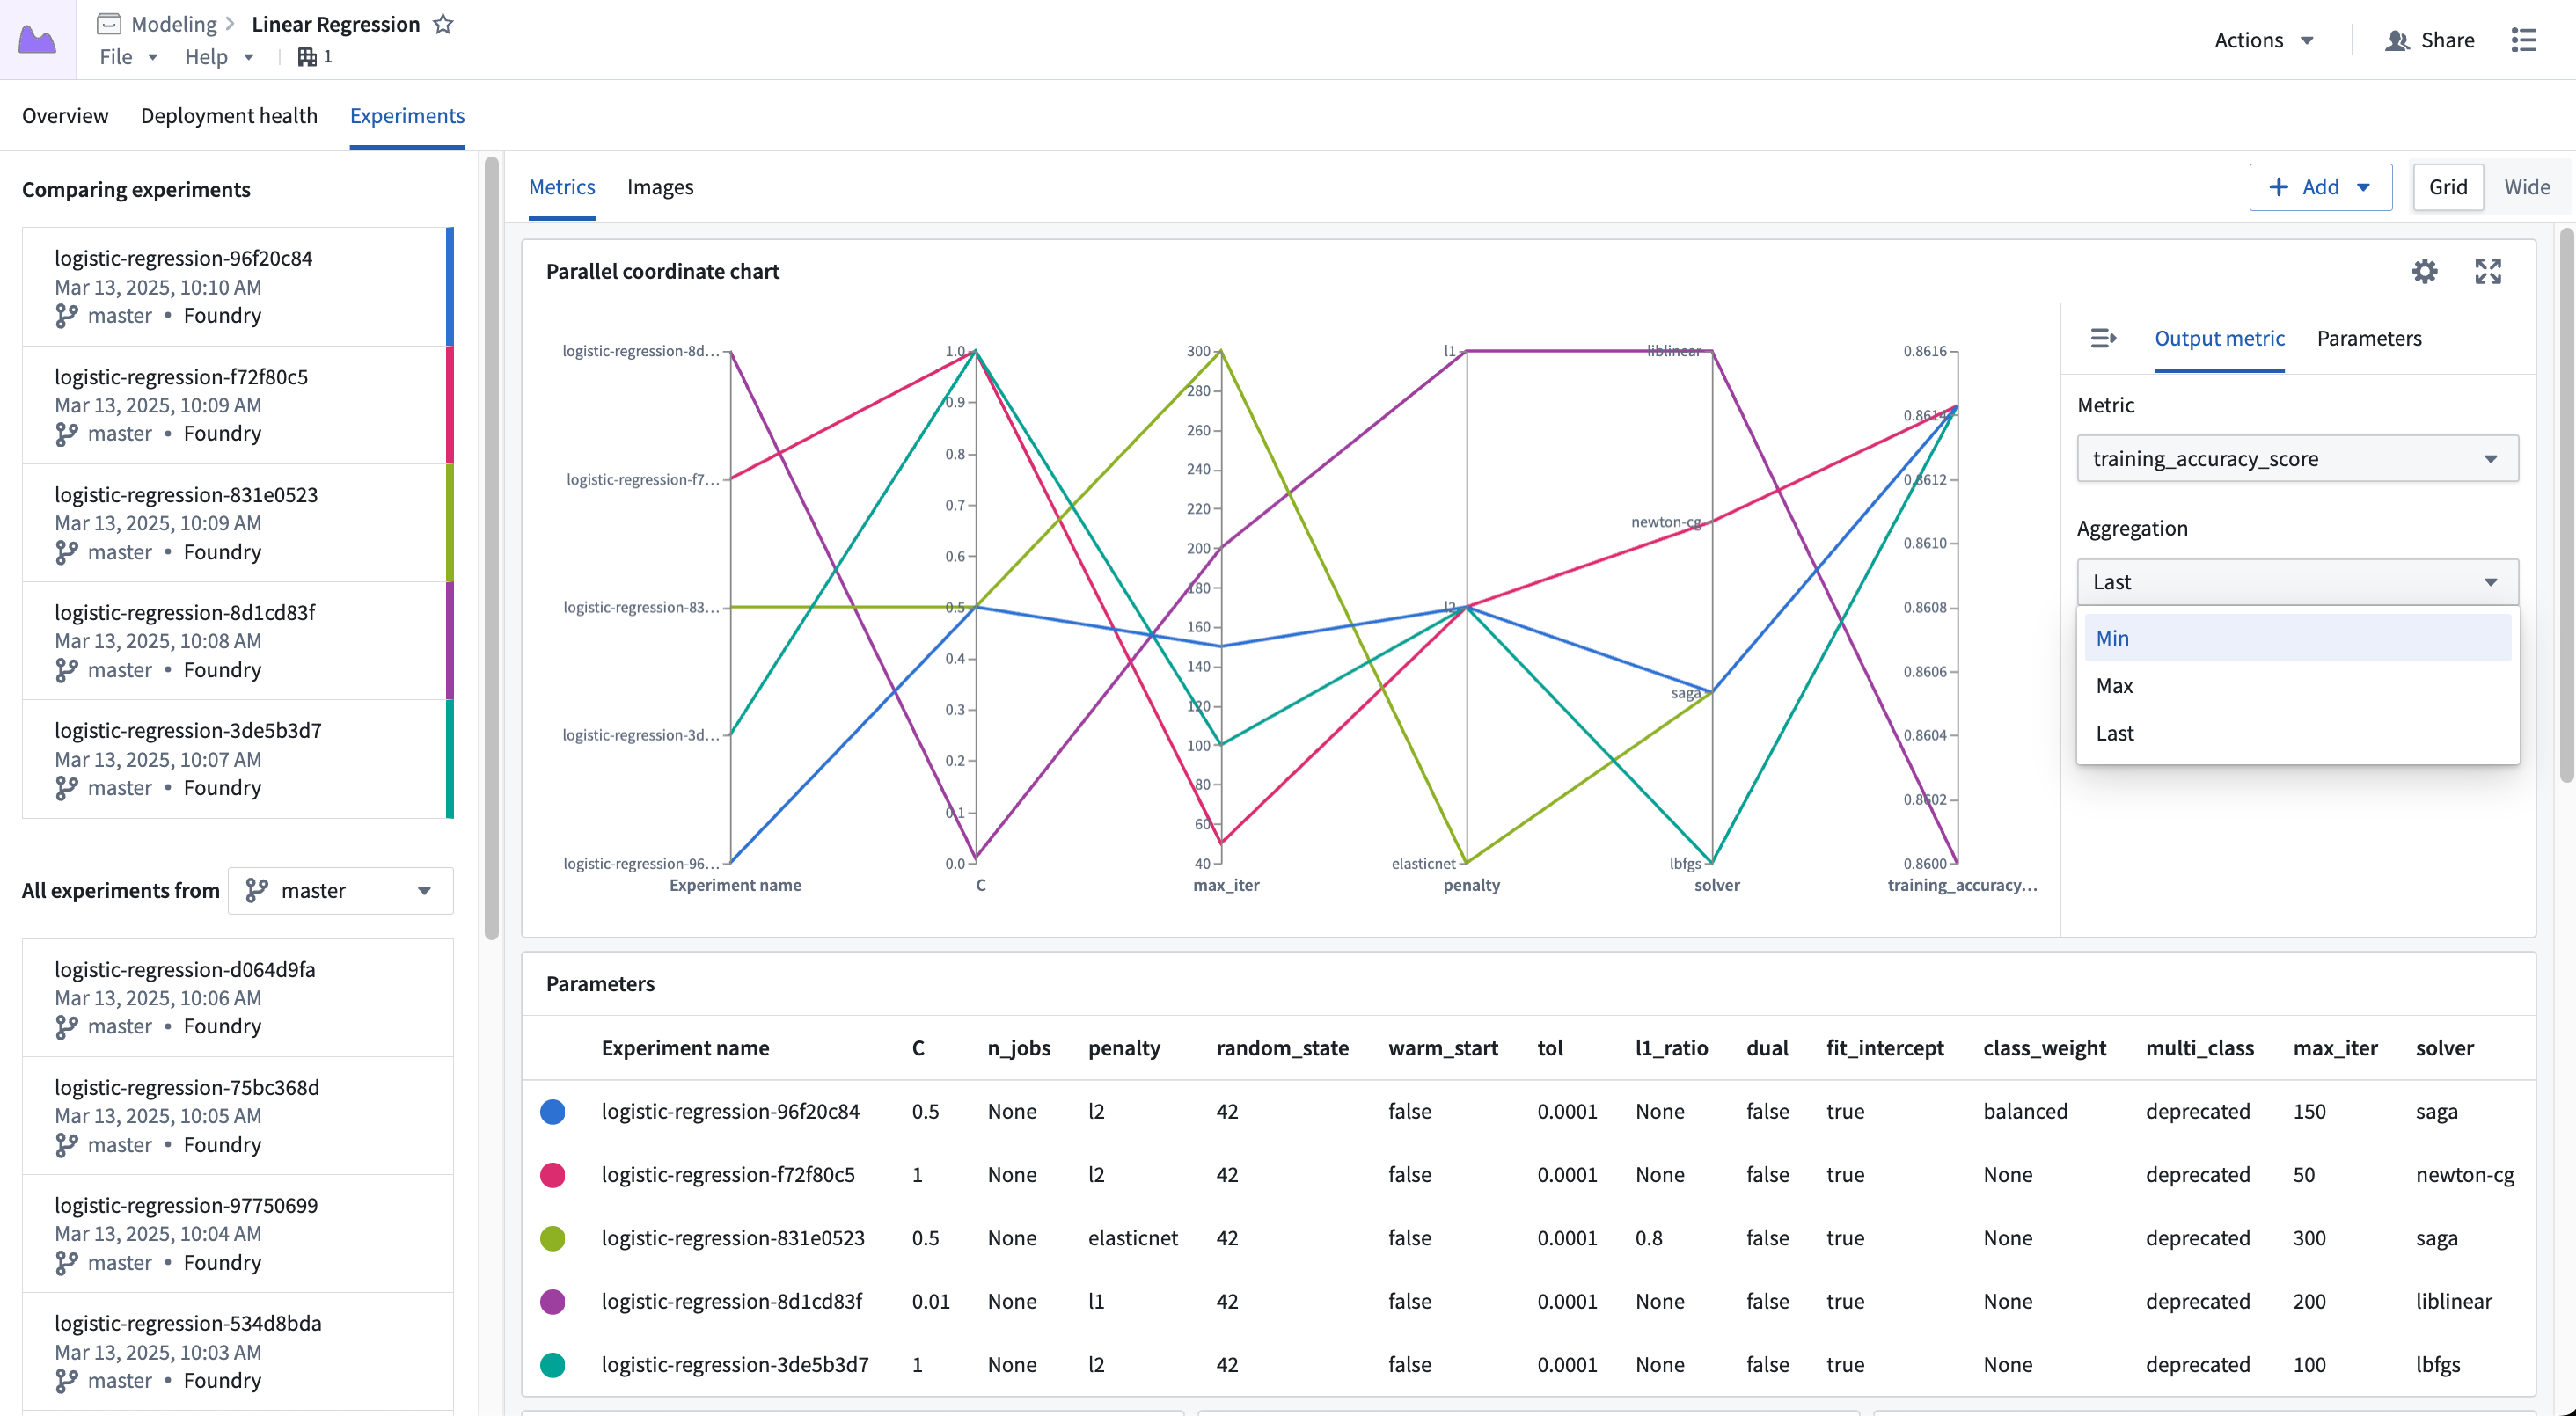
The output metric value is one of the metric series logged to the experiment, where you can choose to view the Last, Min, or Max value.
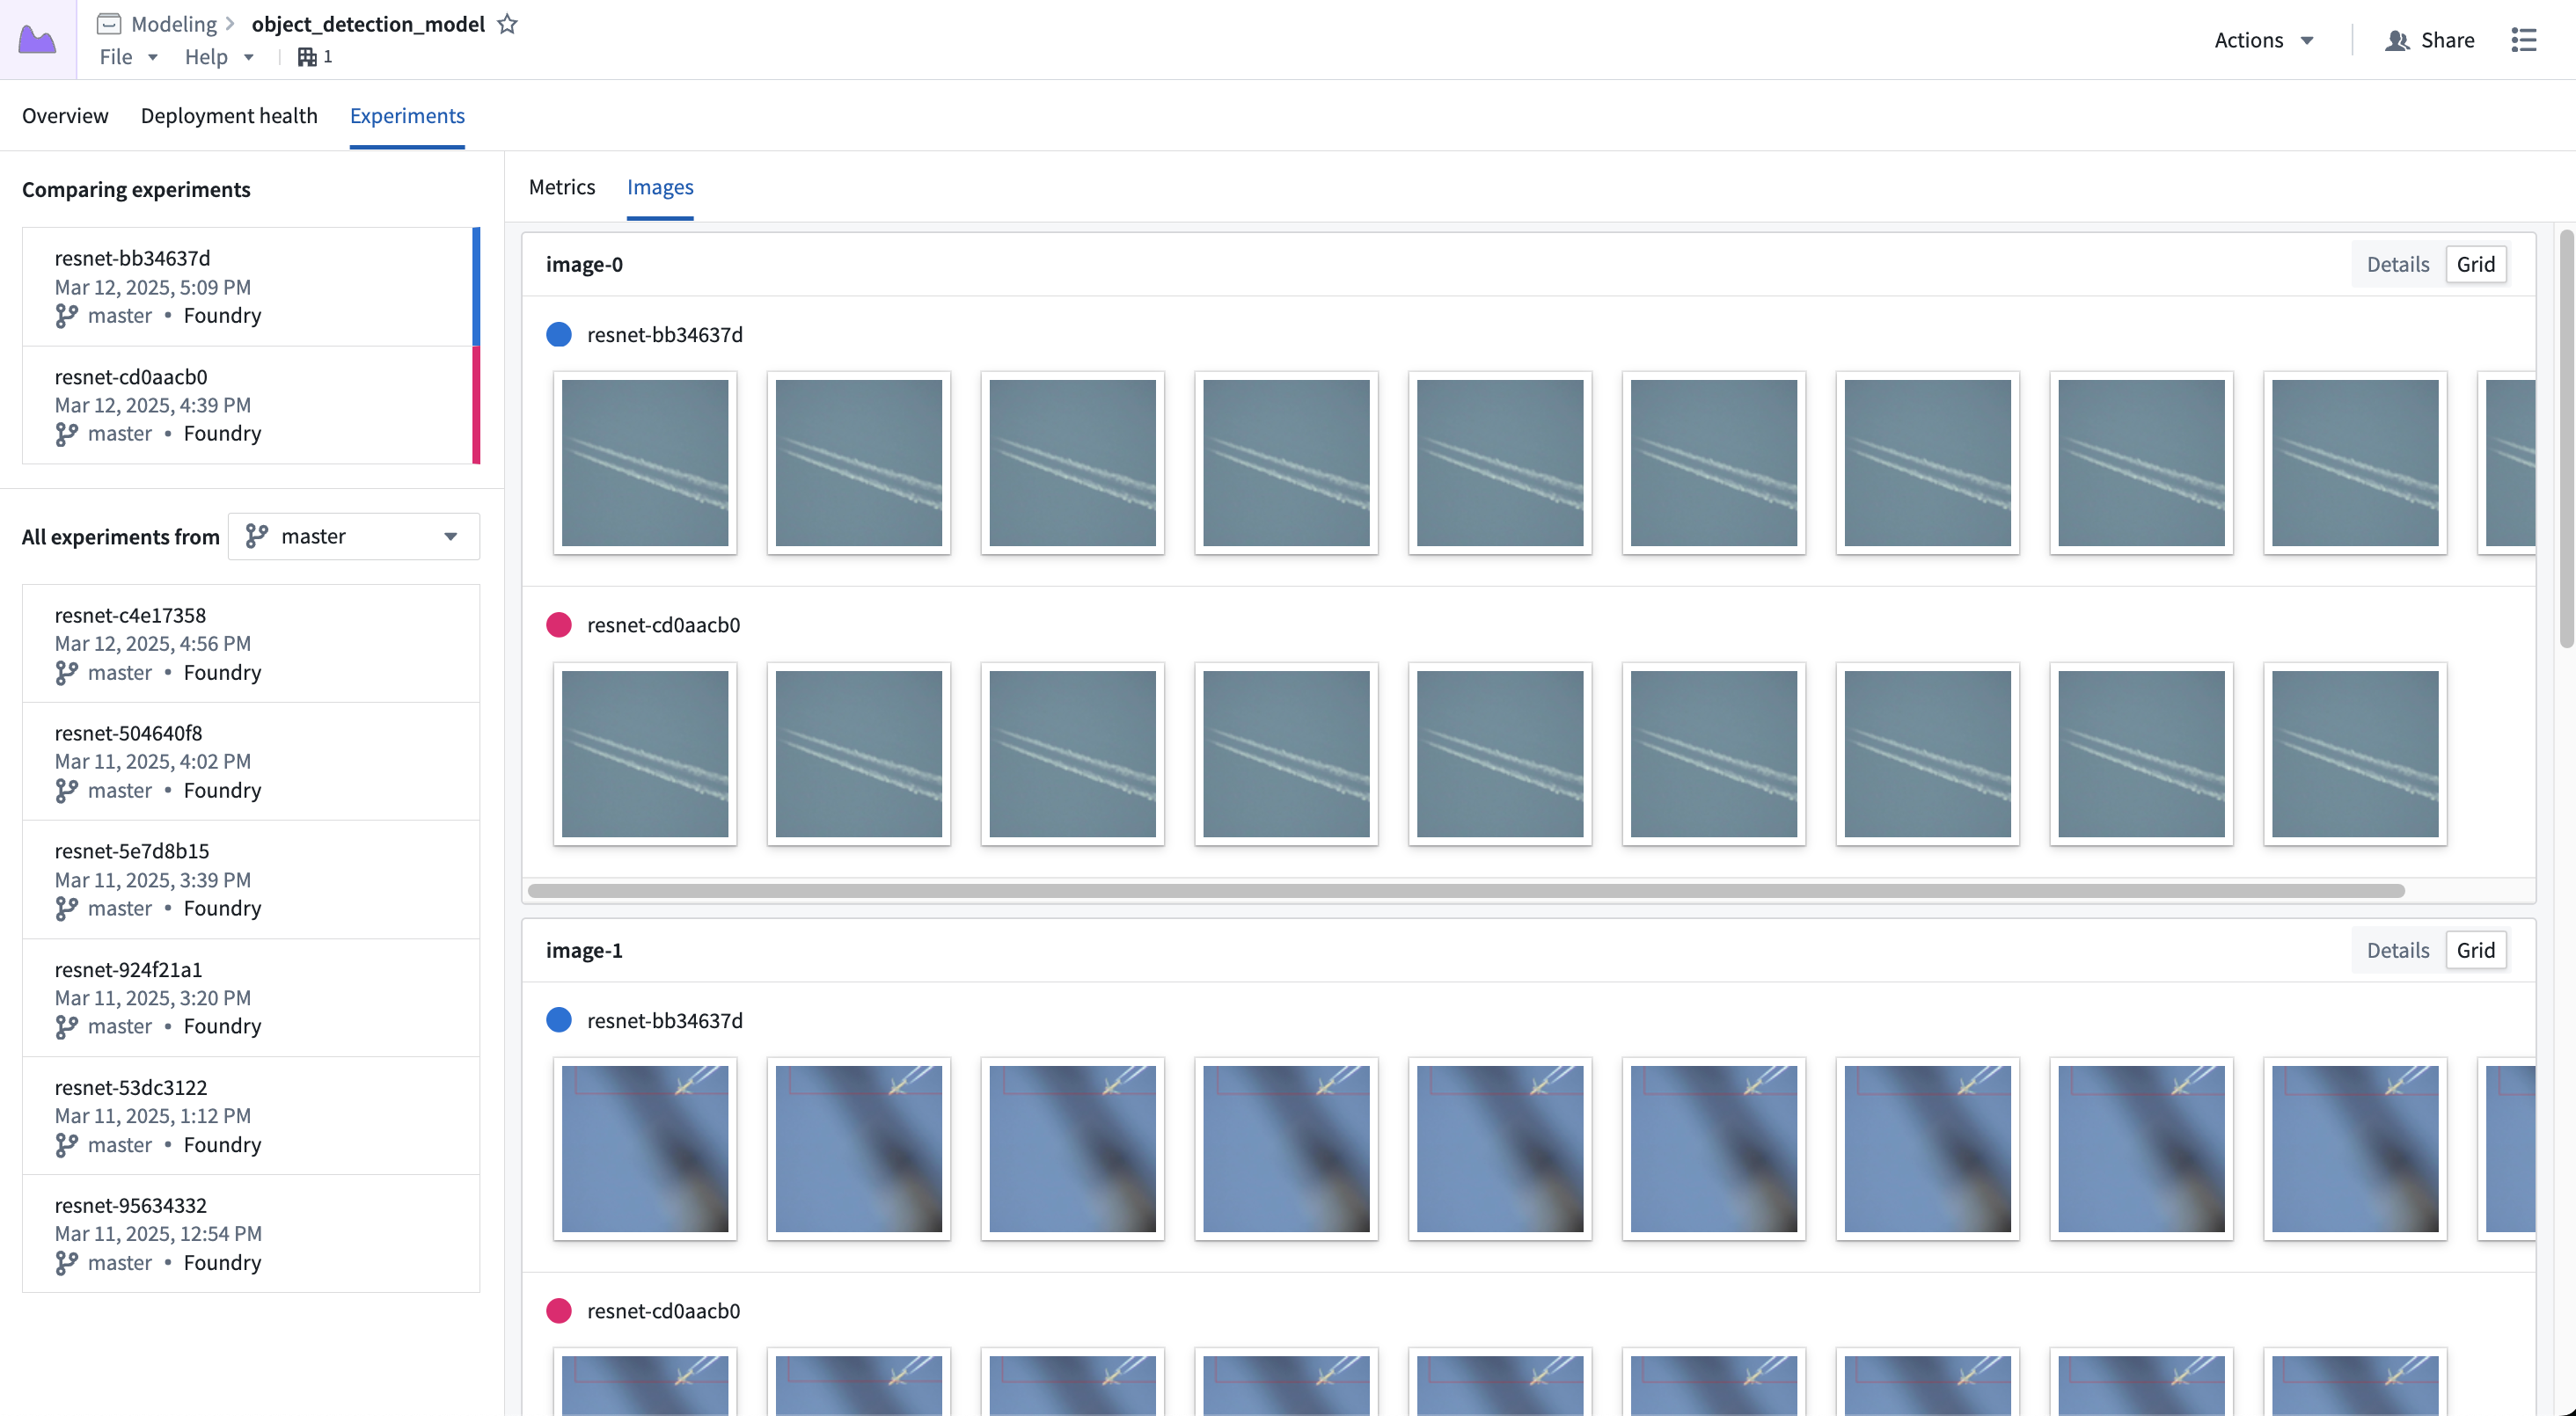
Images
Images can be viewed on the Images tab; selecting experiments will populate the view with the image series for that experiment.
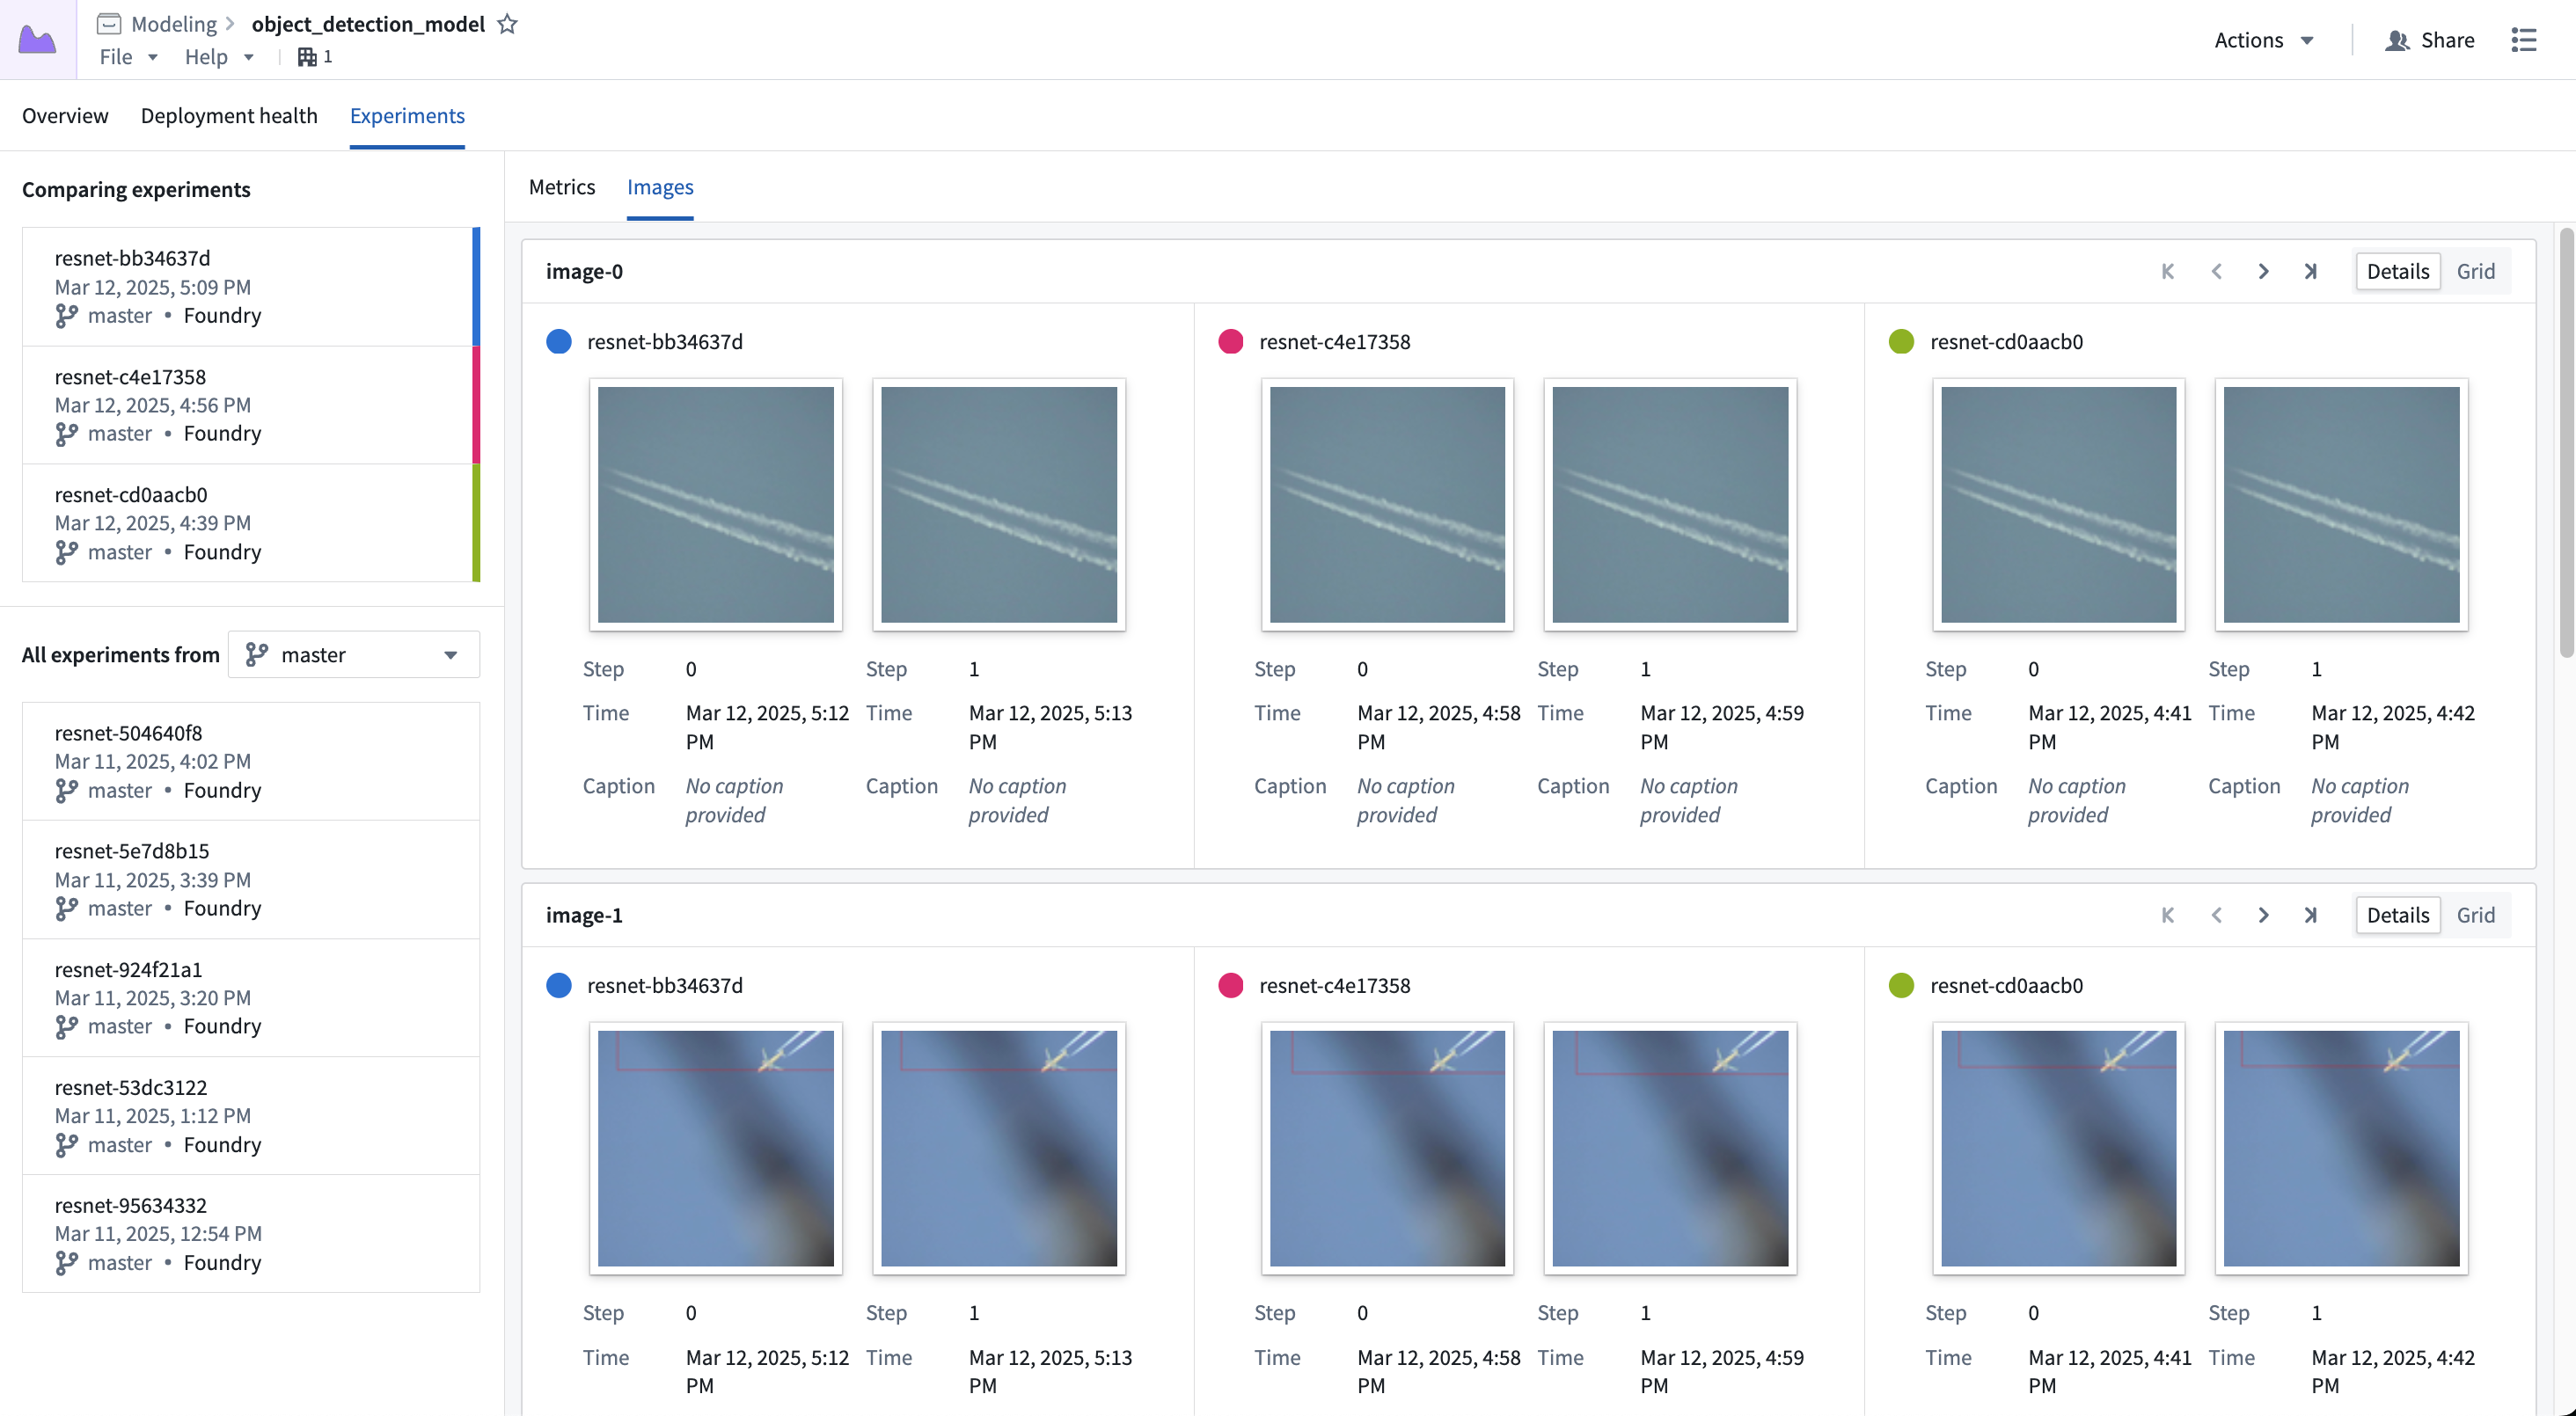
Each card represents a single image series, where each segment of the card represents the series for a given experiment. You can scroll through the images using the controls in the top right, or switch to the Grid view to see more images at once.
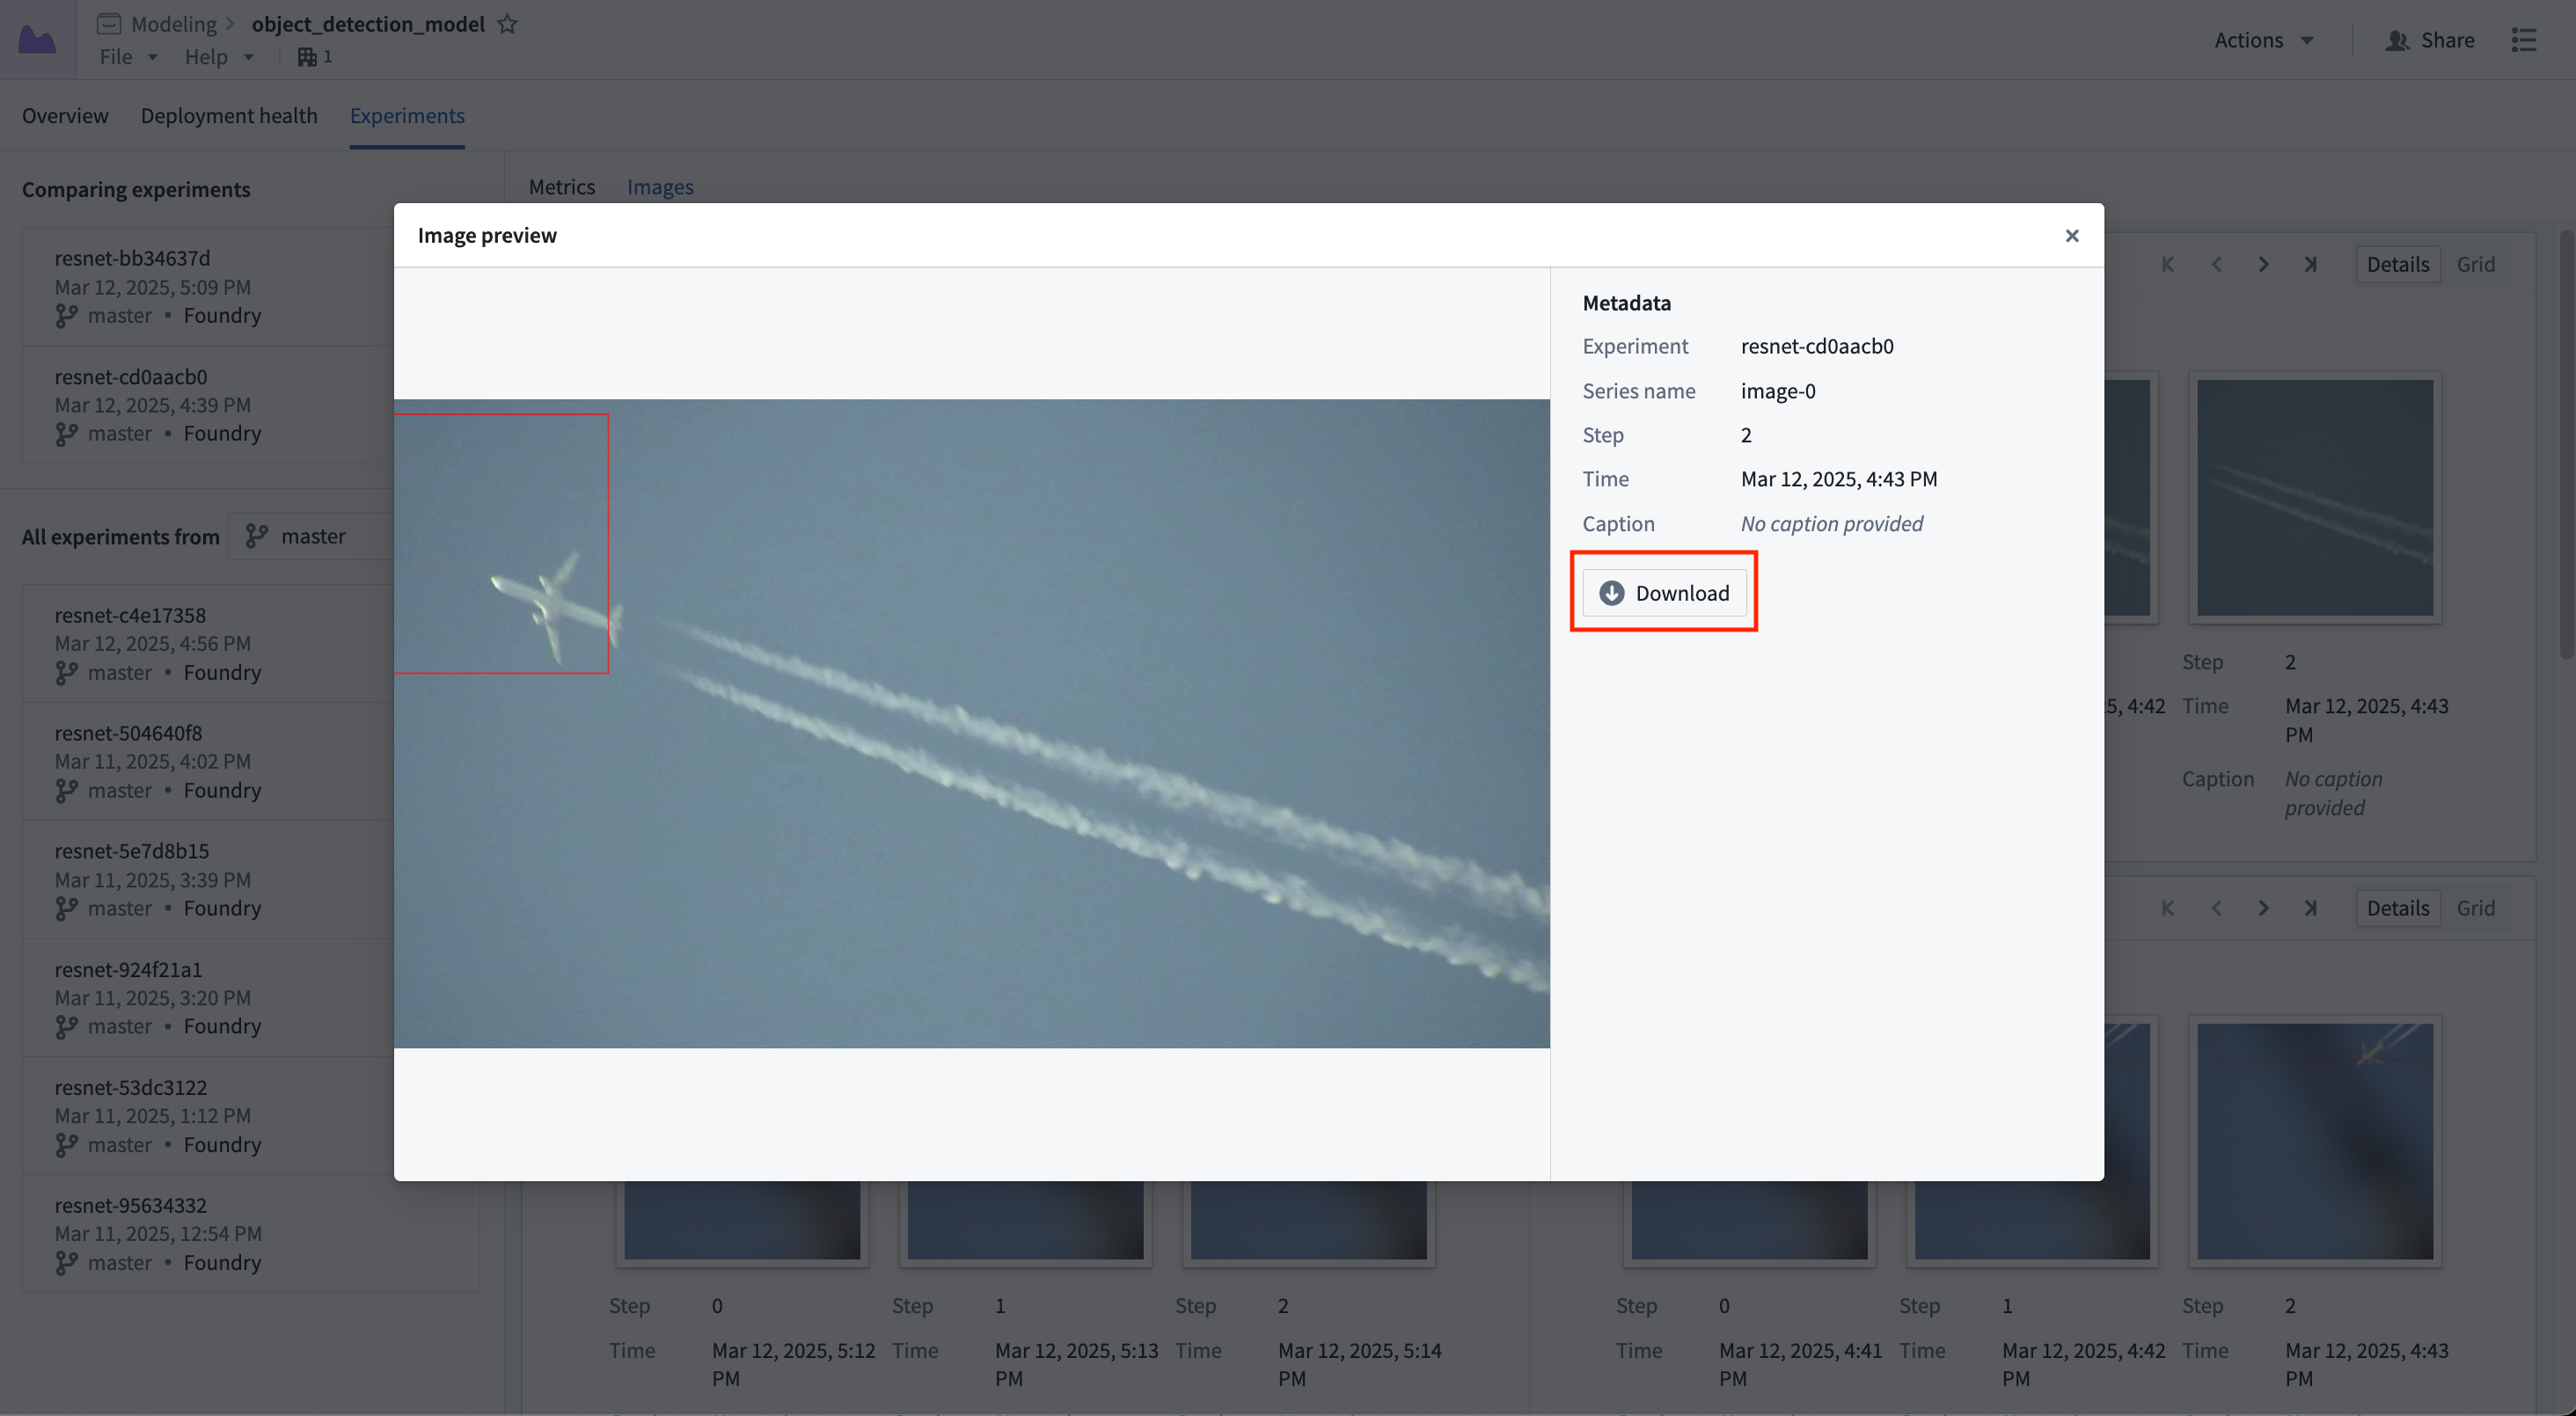
Selecting an image will show a larger view of the image; you can also download the image from this view.
Plots
Plots can be viewed in the Plots tab. Selecting experiments will populate the view with the plot series for that experiment.
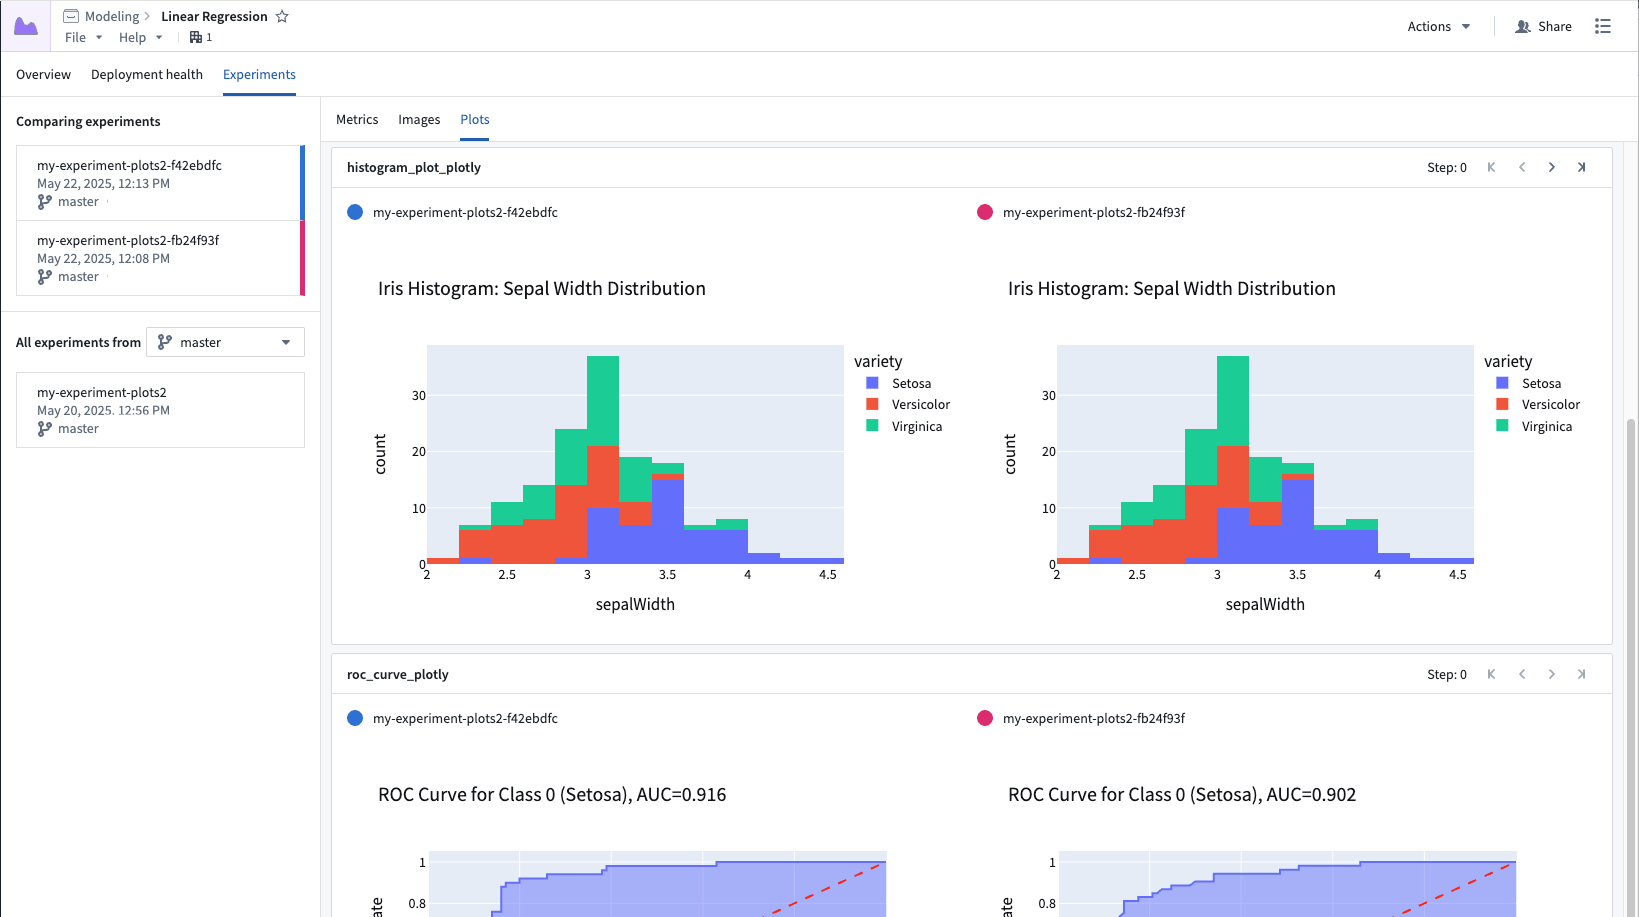
Each card represents a single plot series, where each segment of the card represents the series for a given experiment. You can scroll through the plots using the controls in the top right. Plots are interactive: hover to inspect points, zoom, and pan.
Tables
Tables can be viewed in the Tables tab. If multiple experiments are selected, their tables will be displayed inline.
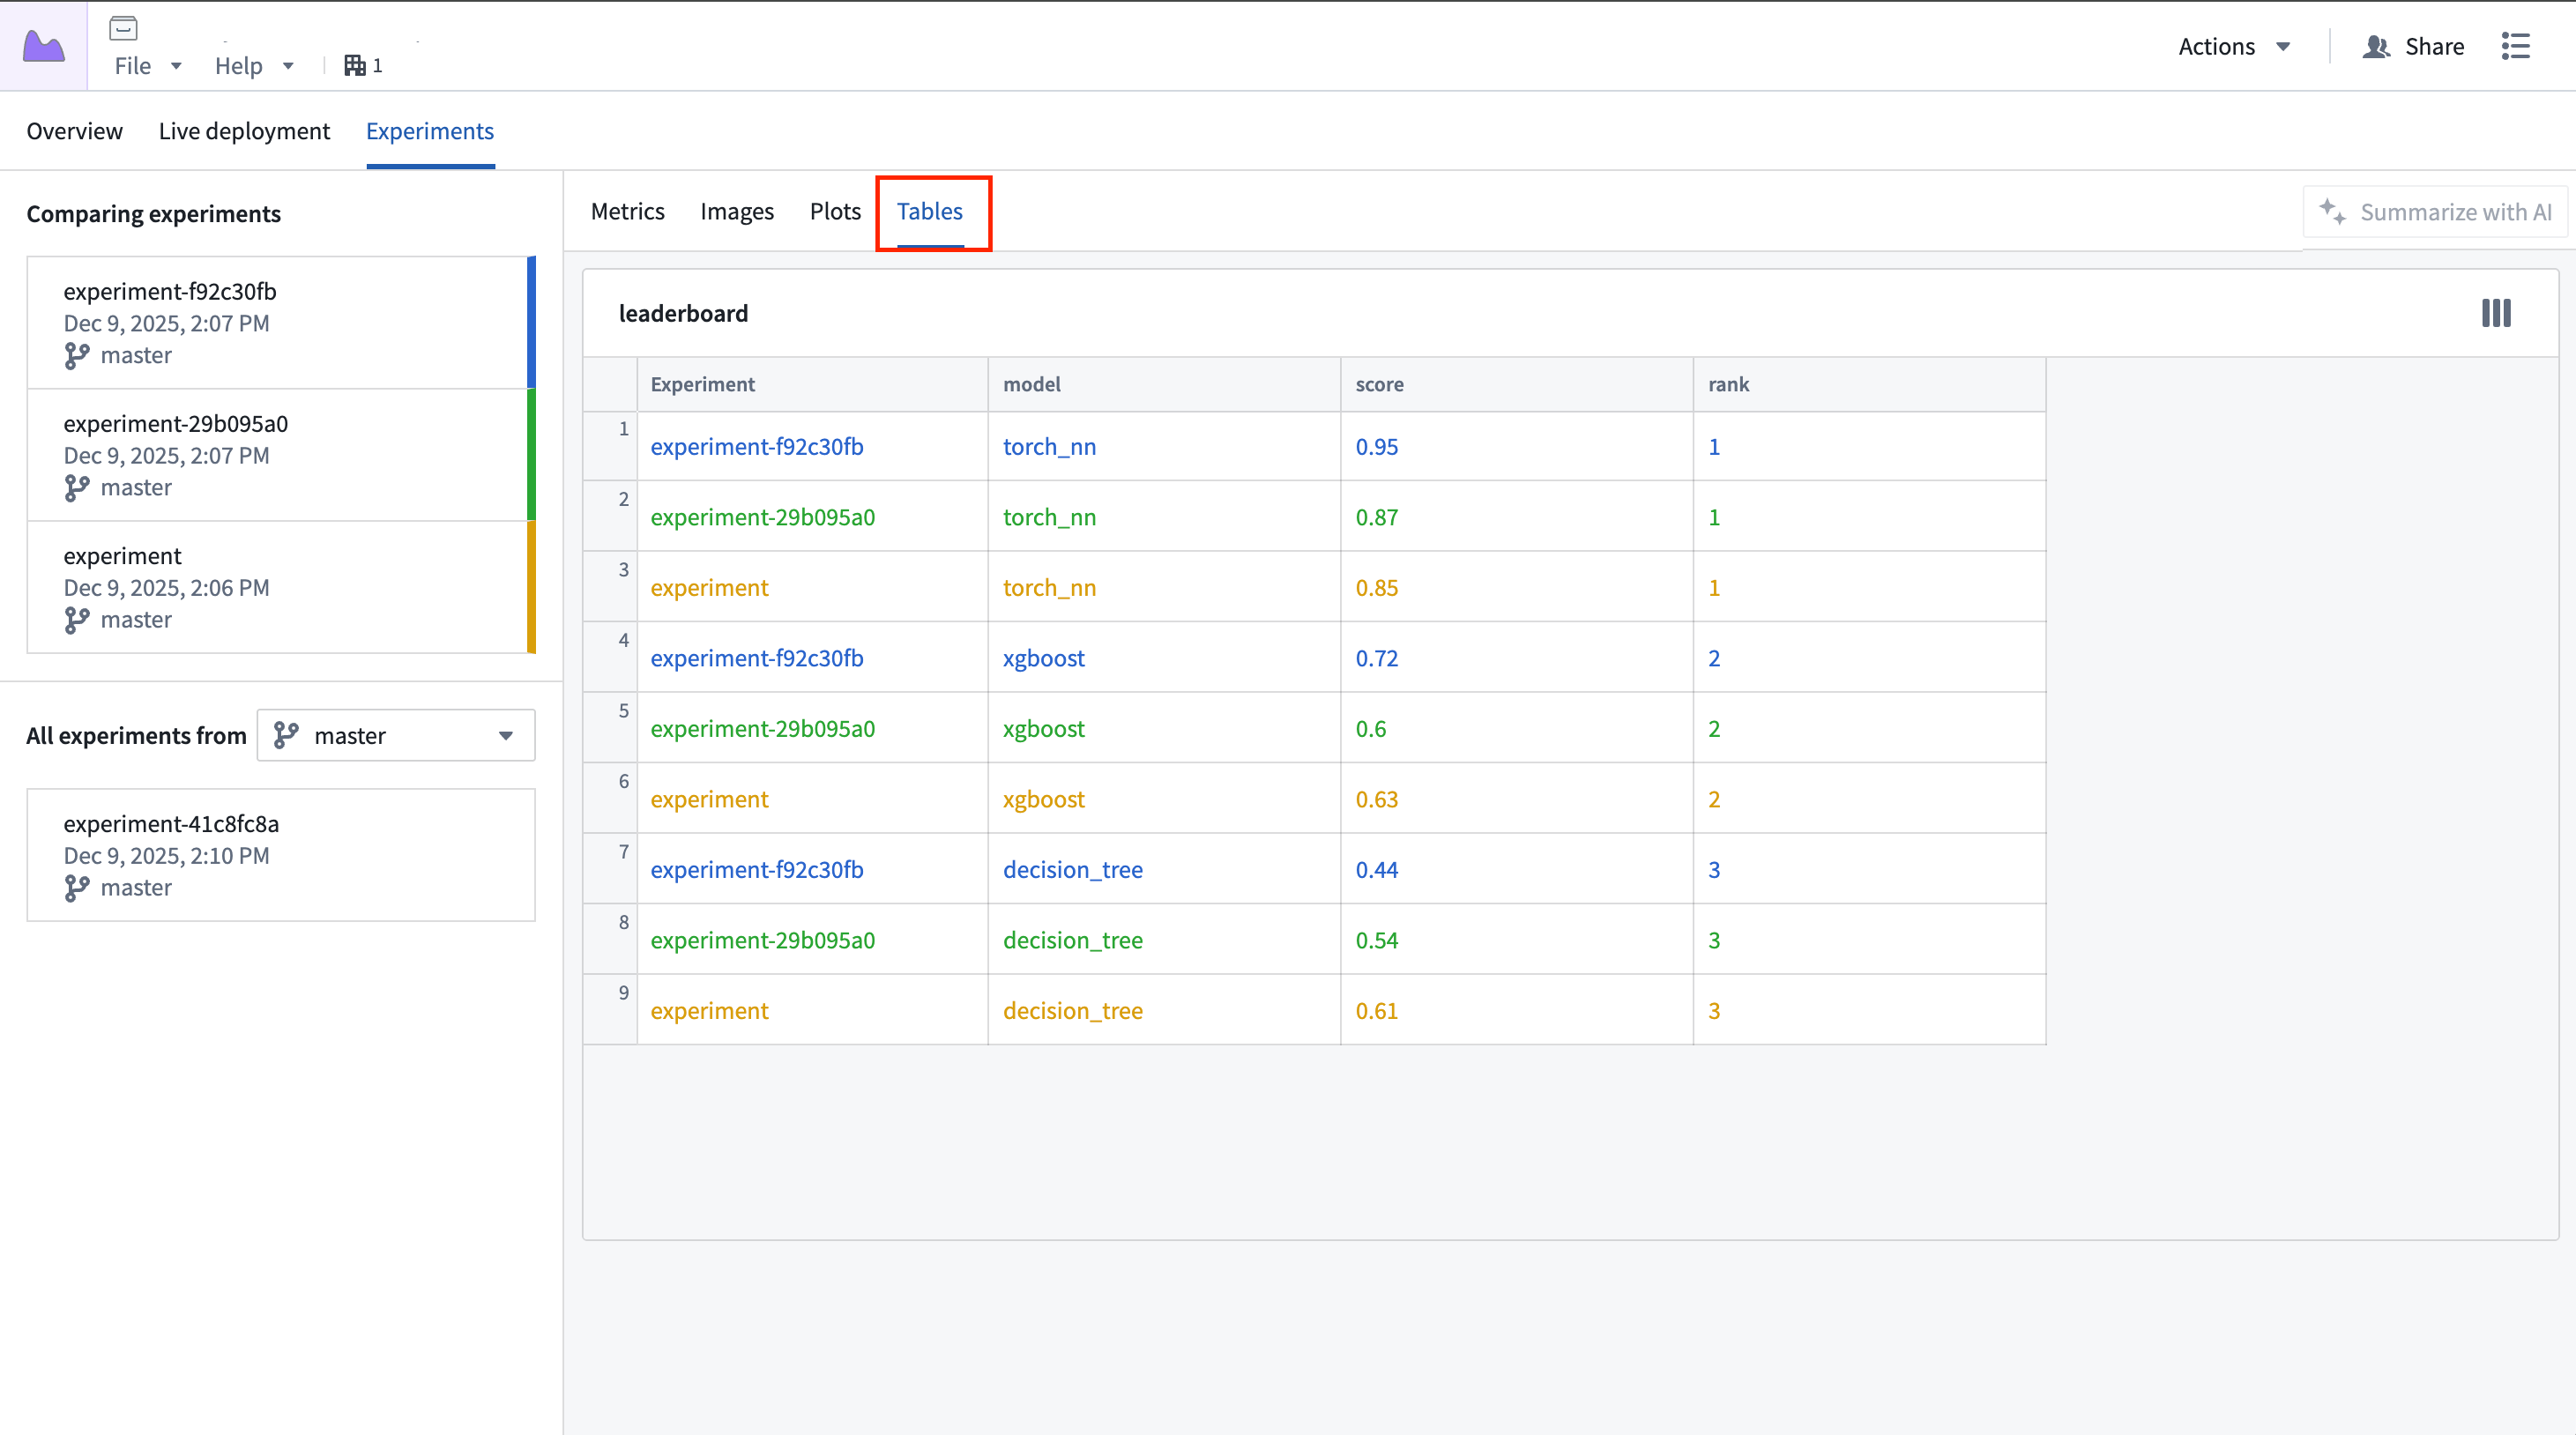
Each card represents a single table, where each experiment's table is displayed inline within the card, color-coded to match the color assigned to the experiment.
中文翻译
可视化实验(Visualize experiments)
一旦随模型版本一同发布,实验便可在模型页面的实验(Experiments)选项卡中立即查看和比较。
实验数据以超参数表(Hyperparameter table)的形式展示在顶部,下方是每个指标(Metric)的折线图。超参数表的每一行代表一个实验,每个实验的指标数据会叠加显示在图表上。
选择实验(Select experiments)
默认情况下,仅选择最新实验进行可视化。如需在视图中添加更多实验,请点击左侧边栏中任意实验旁的 + 图标。
最多可同时选择五个实验进行比较。
展开图表(Expand charts)
指标图表可展开为更大的视图,以便更深入地查看指标数据。
点击展开按钮可在弹出对话框中打开实验。
平行坐标图(Parallel coordinate plot)
平行坐标图可帮助用户了解参数值的变化如何影响训练作业的最终结果。如需在视图中添加平行坐标图,请选择添加(Add),然后选择平行坐标图(Parallel coordinate plot)。
添加新图表后,您可以配置要显示的参数以及要渲染的输出指标值。当前选定实验中记录的任何参数均可添加到视图中。
输出指标值是记录到实验的指标序列之一,您可以选择查看最后(Last)、最小(Min)或最大(Max)值。
图像(Images)
图像可在图像(Images)选项卡中查看;选择实验后,视图将显示该实验的图像序列。
每张卡片代表一个图像序列,卡片中的每个分段代表特定实验的序列。您可以使用右上角的控件滚动浏览图像,或切换到网格(Grid)视图以同时查看更多图像。
选择图像将显示更大的视图;您也可以在此视图中下载图像。
图表(Plots)
图表可在图表(Plots)选项卡中查看。选择实验后,视图将显示该实验的图表序列。
每张卡片代表一个图表序列,卡片中的每个分段代表特定实验的序列。您可以使用右上角的控件滚动浏览图表。图表支持交互:悬停可查看数据点,支持缩放和平移。
表格(Tables)
表格可在表格(Tables)选项卡中查看。如果选择了多个实验,它们的表格将以内联方式显示。
每张卡片代表一个表格,每个实验的表格以颜色编码内联显示在卡片中,颜色与分配给该实验的颜色相匹配。