Live deployment compute usage(实时部署计算用量)
A Foundry Machine Learning live deployment is a persistent, scalable deployment for model releases that can be interacted with via an API endpoint. Live deployments continuously reserve dedicated compute resources to ensure that the deployment can quickly respond to incoming traffic. As a result, hosting a live deployment uses Foundry compute-seconds while the deployment is active.
:::callout{theme="neutral"} The following documentation covers Modeling Objective-backed live deployments only. Neither JavaScript function-backed deployments nor direct deployments are covered here. Direct deployments are backed by compute modules and therefore follow the corresponding principles; however, the caveat on container-backed models requiring both deployment and model resources still applies. :::
When running live, Foundry Machine Learning compute usage is attributed to the Modeling Objective itself and is aggregated at the level of the Project that contains the Modeling Objective. For a deep dive on the definition of a compute-second in Foundry and the origins of the formulas used for computing usage, review the usage types documentation.
Measuring compute seconds
Foundry Machine Learning live deployments host their infrastructure on dedicated “replicas” that run in Foundry’s pod-based computation cluster. Each replica is assigned a set of computational resources, measured in vCPU’s and GiB of RAM. Each replica locally hosts the model and uses computational resources to service incoming requests.
A Foundry Machine Learning live deployment imported into a Modeling Objective uses compute-seconds while it is active, regardless of the number of incoming requests it receives. A deployment is considered “active” once it is started and remains "active" until the deployment is shut down through the graphical interface or API. If the Modeling Objective with which the live deployment is associated is sent to the platform trash, the live deployment will be shut down. Alternatively, a direct deployment started from a model resource rather than a Modeling Objective will auto-scale based on request volume and can be configured to support zero minimum replicas when there is no usage. Learn more about the differences between live deployment from Modeling Objectives and direct deployments and direct deployment auto-scaling behavior.
The number of compute-seconds that a live deployment will use is dependent on three main factors:
- The number of vCPU’s per replica
- For live deployments, vCPU’s are measured in millicores, each of which are 1/1000 of a vCPU
- The GiB of RAM per replica
- The number of GPUs per replica
- The number of replicas
- Each replica in the deployment will have an identical number of vCPU’s and GiB of RAM
When paying for Foundry usage, the default usage rates are the following:
| vCPU / GPU | Usage rate |
|---|---|
| vCPU | 0.2 |
| T4 GPU | 1.2 |
| A100 GPU | 1.3 |
| L4 GPU | 2.1 |
| A10G GPU | 1.5 |
| V100 GPU | 3 |
| H100 GPU | 4.7 |
These are the rates at which live models use compute based on their profile under Foundry's parallel compute framework. If you have an enterprise contract with Palantir, contact Palantir Support to discuss compute usage calculations.
The following formula measures vCPU compute seconds:
live_deployment_vcpu_compute_seconds = max(vCPUs_per_replica, GiB_RAM_per_replica / 7.5) * num_replicas * live_model_vcpu_usage_rate * time_active_in_seconds
The following formula measures GPU compute seconds:
live_deployment_gpu_compute_seconds = GPUs_per_replica * num_replicas * live_model_gpu_usage_rate * time_active_in_seconds
:::callout{theme="neutral" title="Container-backed models"} In the case of container-backed models, every replica comes with a container with its own dedicated GPU or vCPU resources, as specified in the container model version's runtime configuration. :::
Investigating Modeling Objective usage
All compute-second usage in the platform is available in the Resource Management application.
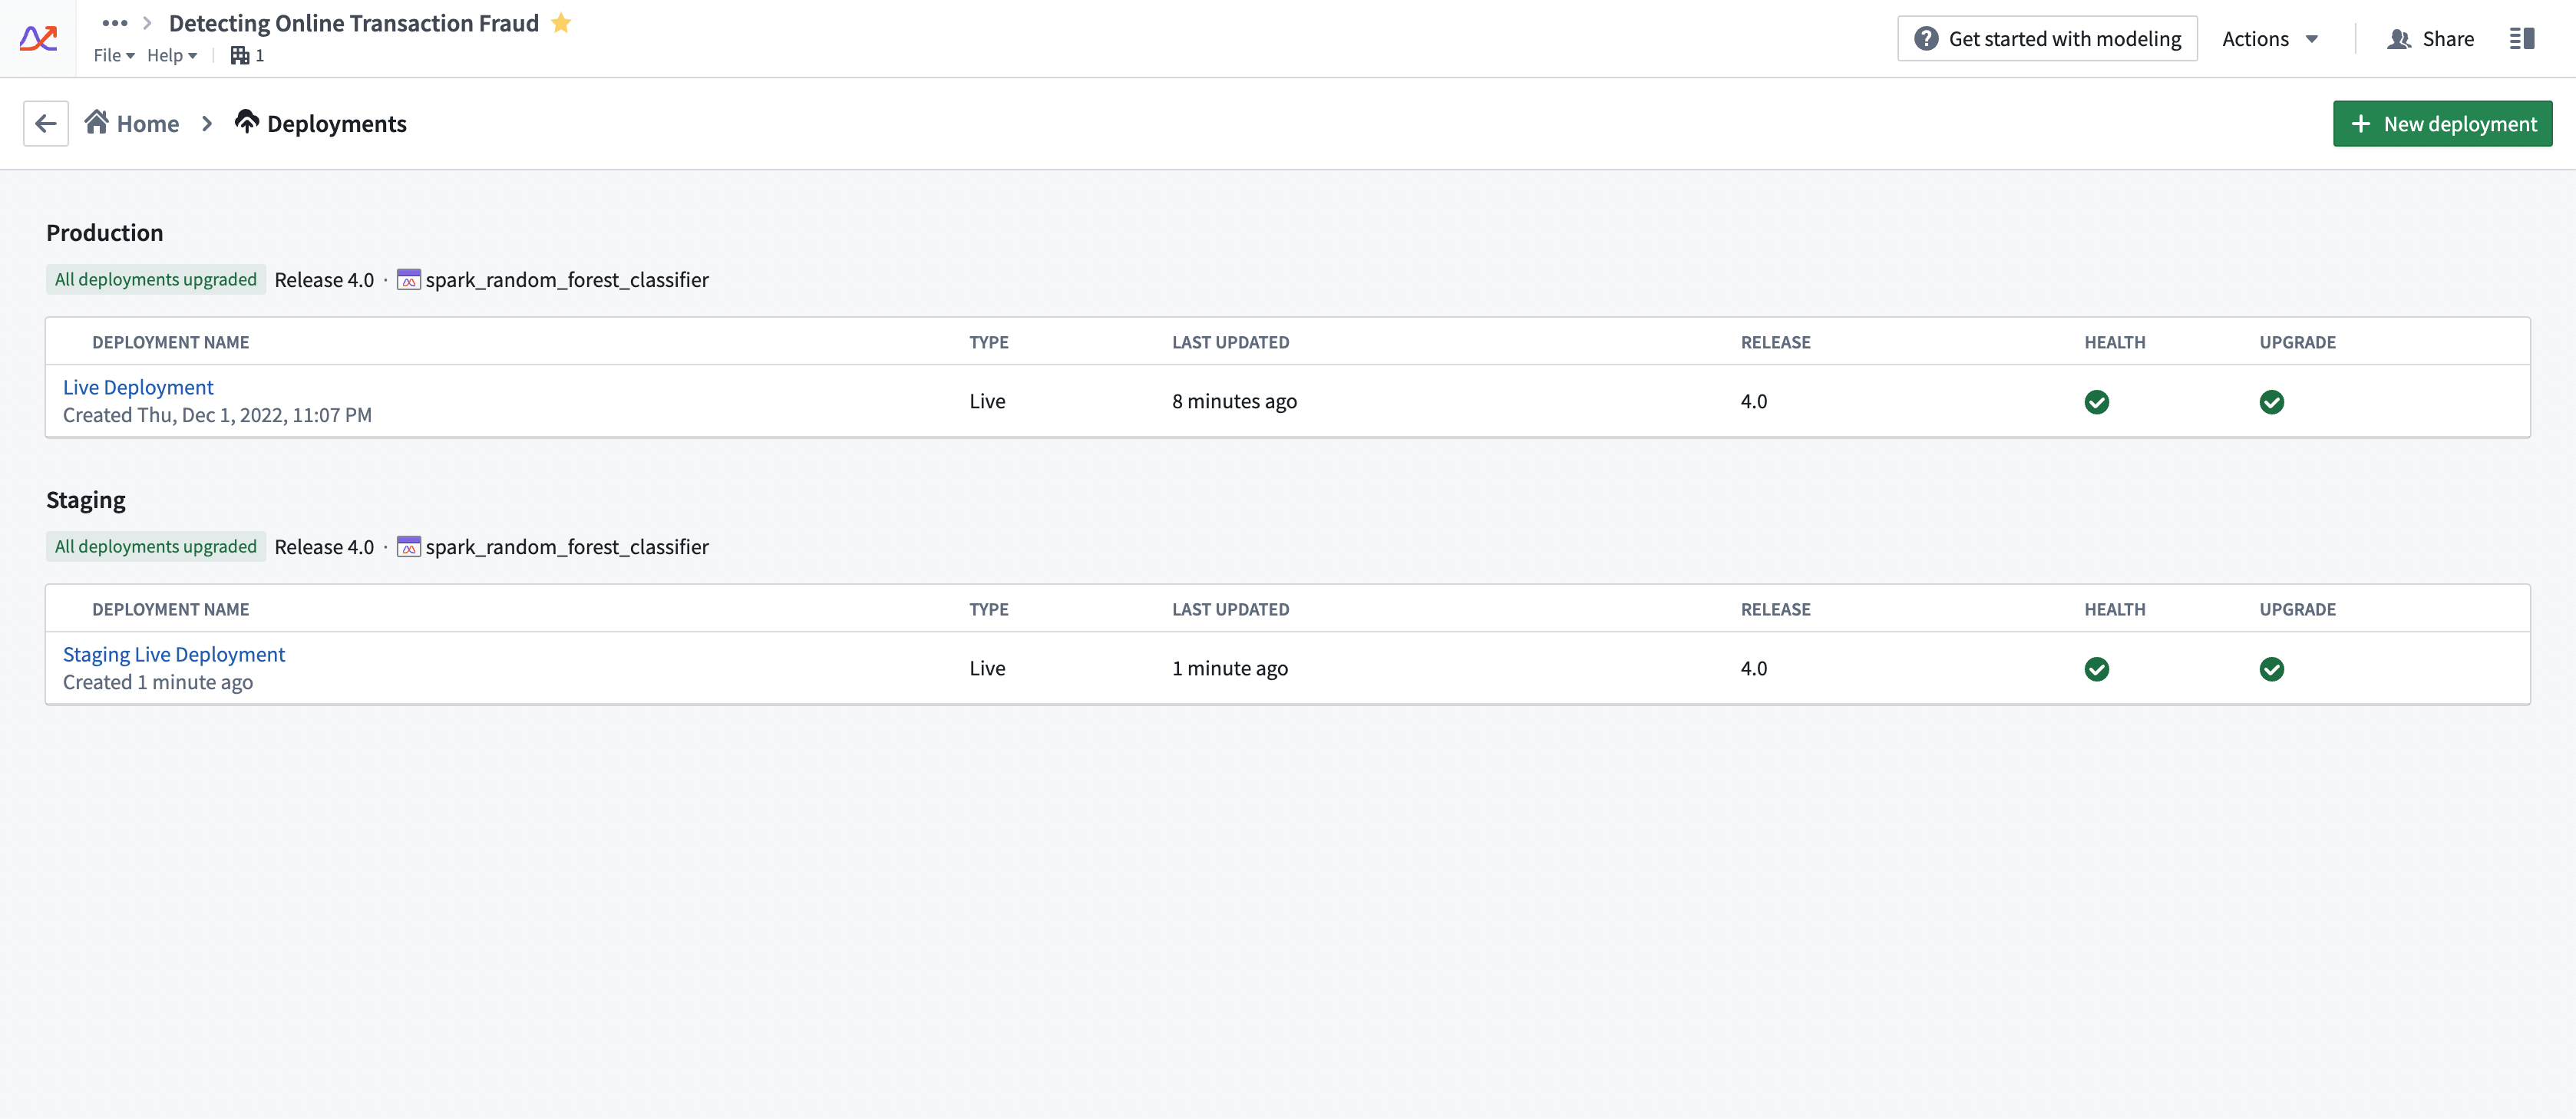
Compute usage for deployments is attached to the Modeling Objective from which it is deployed. Multiple live deployments can be active for any given objective. The live deployments of a Modeling Objective can be found under the Deployments section. See the screenshot below for an example.
Drivers of increased or decreased usage
Live deployments use compute-seconds while they are active. The following strategies can help control the overall usage of a deployment:
- Ensure that the deployment is tuned correctly for the request load that you expect. Deployments should be tuned for the peak expected number of simultaneous requests. If a deployment is under-resourced, it will start to return failed responses to requests. However, over-resourcing a deployment can use more compute seconds than necessary.
- We recommend that live deployment administrators run stress-tests against live deployment endpoints to determine the correct resource configuration before deploying the model into an operationally critical setting.
- Live deployments will run until they are explicitly stopped or canceled. It is important to monitor for live deployment usage to ensure that deployments are not erroneously left running when they are not needed. This can be common on staging deployments.
- Increasing/decreasing API load on a deployment without changing its profile does not affect its compute usage. A live deployment will service as many requests as its resources will allow it to without changing the number of compute-seconds it uses.
Configuring usage
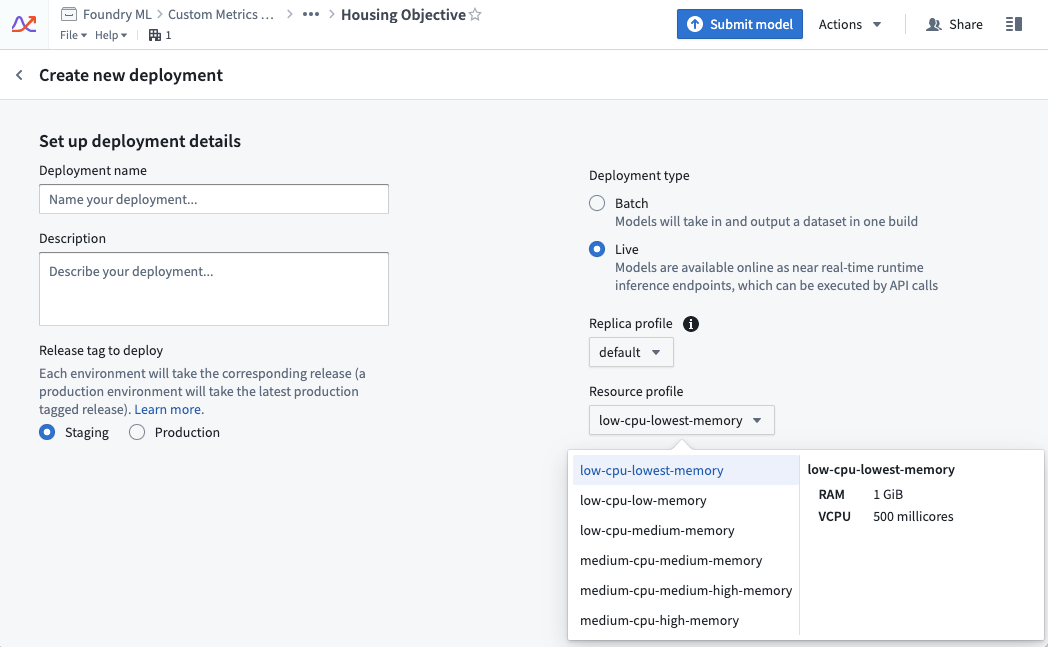
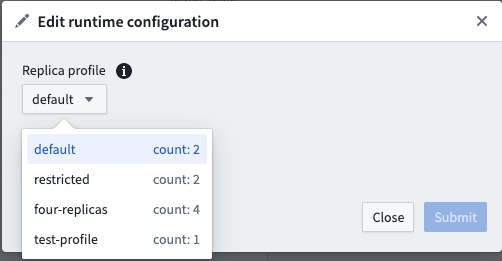
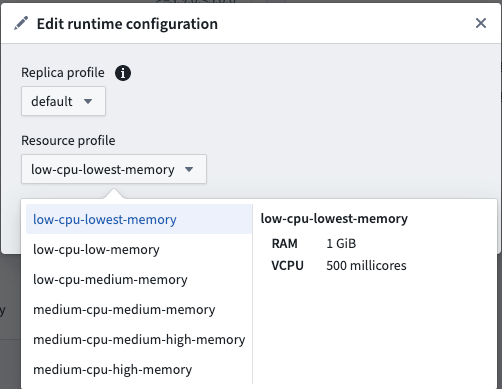
A live deployment’s resource usage is defined by its profile. The profile can be set at creation time of the live deployment. Profiles can be changed while the deployment is active. Deployments will automatically receive the updated profile with no downtime.
Managing usage
In enrollments where compute is managed through Resources Queues, Resource Management administrators can view which live deployments are currently running in a given queue using the steps below:
- Open the Resource Management application.
- Select Resource queues.
- Select a queue from the left sidebar.
- Choose the Continuous compute tab in the middle of the page.
- Select the filter icon on the far right side, then choose to filter by Live deployment.
Usage calculation examples
Example 1: vCPU compute
The following example shows a live deployment with the default replica profile of two replicas that is active for 20 seconds with the “low-cpu-lowest-memory” profile:
resource_config:
    num_replicas: 2
    vcpu_per_replica: 0.5 vCPU
    GiB_RAM_per_replica: 1 GiB
seconds_active: 20 seconds
live_model_vcpu_usage_rate: 0.2

compute seconds = max(vcpu_per_replica, GiB_RAM_per_replica / 7.5) * num_replicas * live_model_vcpu_usage_rate * time_active_in_seconds
                = max(0.5vCPU, 1GiB / 7.5) * 2replicas * 0.2 * 20sec
                = 0.5 * 2 * 0.2 * 20
                = 4 compute-seconds
Example 2: GPU compute
The following example shows the usage rate for a live deployment. The live deployment has a default replica profile with two replicas and is active for 20 seconds with a GPU V100 profile.
resource_config:
    num_replicas: 2
    gpu_per_replica: 1 V100 GPU
seconds_active: 20 seconds
live_model_gpu_usage_rate: 3

compute seconds = gpu_per_replica * num_replicas * live_model_gpu_usage_rate * time_active_in_seconds
                = 1 * 2replicas * 3 * 20sec
                = 1 * 2 * 3 * 20
                = 120 compute-seconds
Example 3: Container-backed model compute
Deployment resource_config:
    num_replicas: 2
    vcpu_per_replica: 0.5 vCPU
    GiB_RAM_per_replica: 1 GiB

Model image resource_config:
    CPU: 4 cores
    Memory: 30 GiB

seconds_active: 20 seconds
live_model_vpcu_usage_rate: 0.2

total compute seconds = (compute seconds deployment resource) + (compute seconds model resource)

compute seconds deployment resource = max(vcpu_per_replica, GiB_RAM_per_replica / 7.5) * num_replicas * live_model_vcpu_usage_rate * time_active_in_seconds
                = 0.5 * 2replicas * 0.2 * 20sec
                = 0.5 * 2replicas * 0.2 * 20sec
                = 4 compute seconds

compute seconds model resources = max(cores, Memory / 7.5) * num_replicas * live_model_vcpu_usage_rate * time_active_in_seconds
compute seconds model resources = 30 / 7.5 * 2 * 0.2 * 20
compute seconds model resources = 32 compute seconds

total compute seconds = 36 compute seconds
中文翻译
实时部署计算用量
Foundry Machine Learning 实时部署(live deployment)是一种持久化、可扩展的模型发布部署方式,可通过 API 端点进行交互。实时部署会持续预留专用计算资源,以确保部署能够快速响应传入流量。因此,托管实时部署在部署处于活动状态时会消耗 Foundry 计算秒数(compute-seconds)。
:::callout{theme="neutral"} 以下文档仅涵盖基于建模目标(Modeling Objective)的实时部署。不涉及基于 JavaScript 函数的部署或直接部署(direct deployments)。直接部署由计算模块(compute modules)支持,因此遵循相应原则;但关于基于容器的模型(container-backed models)需要同时占用部署和模型资源的注意事项仍然适用。 :::
在实时运行时,Foundry Machine Learning 计算用量归属于建模目标本身,并在包含该建模目标的项目(Project)层级进行汇总。如需深入了解 Foundry 中计算秒数的定义以及用量计算公式的起源,请查阅用量类型(usage types)文档。
计算秒数的测量
Foundry Machine Learning 实时部署将其基础设施托管在专用的"副本(replicas)"上,这些副本运行在 Foundry 基于 Pod 的计算集群中。每个副本被分配一组计算资源,以 vCPU 和 GiB 内存(RAM)为单位进行衡量。每个副本在本地托管模型,并使用计算资源来处理传入的请求。
导入到建模目标中的 Foundry Machine Learning 实时部署在活动状态下会消耗计算秒数,无论其接收的请求数量多少。部署一旦启动即被视为"活动状态",并保持该状态直至通过图形界面或 API 关闭部署。如果与实时部署关联的建模目标被移至平台回收站,实时部署将被关闭。或者,从模型资源而非建模目标启动的直接部署将根据请求量自动扩缩容,并可配置为在无用量时支持零最小副本。了解更多关于建模目标实时部署与直接部署的区别以及直接部署自动扩缩容行为的信息。
实时部署消耗的计算秒数取决于三个主要因素:
- 每个副本的 vCPU 数量
- 对于实时部署,vCPU 以毫核(millicores)为单位衡量,每个毫核为 1/1000 个 vCPU
- 每个副本的 GiB 内存
- 每个副本的 GPU 数量
- 副本数量
- 部署中的每个副本将拥有相同数量的 vCPU 和 GiB 内存
在支付 Foundry 用量时,默认用量费率如下:
| vCPU / GPU | 用量费率 |
|---|---|
| vCPU | 0.2 |
| T4 GPU | 1.2 |
| A100 GPU | 1.3 |
| L4 GPU | 2.1 |
| A10G GPU | 1.5 |
| V100 GPU | 3 |
| H100 GPU | 4.7 |
这些是实时模型在 Foundry 并行计算框架下根据其配置使用计算的费率。如果您与 Palantir 签订了企业合同,请联系 Palantir 支持以讨论计算用量计算事宜。
以下公式用于测量 vCPU 计算秒数:
live_deployment_vcpu_compute_seconds = max(vCPUs_per_replica, GiB_RAM_per_replica / 7.5) * num_replicas * live_model_vcpu_usage_rate * time_active_in_seconds
以下公式用于测量 GPU 计算秒数:
live_deployment_gpu_compute_seconds = GPUs_per_replica * num_replicas * live_model_gpu_usage_rate * time_active_in_seconds
:::callout{theme="neutral" title="基于容器的模型"} 对于基于容器的模型,每个副本都附带一个容器,该容器拥有其专用的 GPU 或 vCPU 资源,如容器模型版本的运行时配置中所指定。 :::
调查建模目标用量
平台中的所有计算秒数用量均可通过资源管理(Resource Management)应用程序查看。
部署的计算用量归属于从中部署的建模目标。对于任何给定的目标,可以有多个实时部署同时处于活动状态。建模目标的实时部署可以在部署(Deployments)部分找到。请参见下方截图示例。
用量增减的驱动因素
实时部署在活动状态下消耗计算秒数。以下策略有助于控制部署的整体用量:
- 确保部署针对您预期的请求负载进行了正确调优。部署应针对预期的峰值并发请求数进行调优。如果部署资源不足,将开始对请求返回失败响应。然而,过度配置部署资源可能会消耗比必要更多的计算秒数。
- 我们建议实时部署管理员在将模型部署到关键业务环境之前,对实时部署端点进行压力测试,以确定正确的资源配置。
- 实时部署将持续运行,直到被显式停止或取消。监控实时部署用量非常重要,以确保在不需要时不会错误地让部署保持运行。这在暂存部署中很常见。
- 在不更改部署配置的情况下增加/减少部署的 API 负载不会影响其计算用量。实时部署将根据其资源能力处理尽可能多的请求,而不会改变其消耗的计算秒数。
配置用量
实时部署的资源用量由其配置(profile)定义。配置可以在创建实时部署时设置。配置可以在部署处于活动状态时更改。部署将自动接收更新后的配置,且不会出现停机。
管理用量
在通过资源队列(Resources Queues)管理计算的注册环境中,资源管理管理员可以使用以下步骤查看当前在给定队列中运行的实时部署:
- 打开资源管理应用程序。
- 选择资源队列。
- 从左侧边栏中选择一个队列。
- 选择页面中间的持续计算(Continuous compute)选项卡。
- 选择最右侧的筛选图标,然后选择按实时部署(Live deployment)进行筛选。
用量计算示例
示例 1:vCPU 计算
以下示例显示了一个实时部署,使用默认副本配置,两个副本,活动 20 秒,采用"low-cpu-lowest-memory"配置:
resource_config:
    num_replicas: 2
    vcpu_per_replica: 0.5 vCPU
    GiB_RAM_per_replica: 1 GiB
seconds_active: 20 seconds
live_model_vcpu_usage_rate: 0.2

compute seconds = max(vcpu_per_replica, GiB_RAM_per_replica / 7.5) * num_replicas * live_model_vcpu_usage_rate * time_active_in_seconds
                = max(0.5vCPU, 1GiB / 7.5) * 2replicas * 0.2 * 20sec
                = 0.5 * 2 * 0.2 * 20
                = 4 compute-seconds
示例 2:GPU 计算
以下示例显示了一个实时部署的用量费率。该实时部署使用默认副本配置,两个副本,活动 20 秒,采用 GPU V100 配置。
resource_config:
    num_replicas: 2
    gpu_per_replica: 1 V100 GPU
seconds_active: 20 seconds
live_model_gpu_usage_rate: 3

compute seconds = gpu_per_replica * num_replicas * live_model_gpu_usage_rate * time_active_in_seconds
                = 1 * 2replicas * 3 * 20sec
                = 1 * 2 * 3 * 20
                = 120 compute-seconds
示例 3:基于容器的模型计算
Deployment resource_config:
    num_replicas: 2
    vcpu_per_replica: 0.5 vCPU
    GiB_RAM_per_replica: 1 GiB

Model image resource_config:
    CPU: 4 cores
    Memory: 30 GiB

seconds_active: 20 seconds
live_model_vpcu_usage_rate: 0.2

total compute seconds = (compute seconds deployment resource) + (compute seconds model resource)

compute seconds deployment resource = max(vcpu_per_replica, GiB_RAM_per_replica / 7.5) * num_replicas * live_model_vcpu_usage_rate * time_active_in_seconds
                = 0.5 * 2replicas * 0.2 * 20sec
                = 0.5 * 2replicas * 0.2 * 20sec
                = 4 compute seconds

compute seconds model resources = max(cores, Memory / 7.5) * num_replicas * live_model_vcpu_usage_rate * time_active_in_seconds
compute seconds model resources = 30 / 7.5 * 2 * 0.2 * 20
compute seconds model resources = 32 compute seconds

total compute seconds = 36 compute seconds