Set up and use a live deployment(设置并使用实时部署)
A live deployment is a persistent, scalable deployment for your releases that you can interact with via an API endpoint. Live deployments can be managed together with your batch deployments in a modeling objective, receiving all the same benefits of automated upgrades, observability, and permissions structure. Live deployments can now also be configured on the model page directly without requiring objectives.
Requirements
Before creating a new live deployment, the modeling objective must contain an existing release with the corresponding tag (either Staging or Production).
Create deployment
To create a new live deployment, navigate to the Deployments section at the bottom of your modeling objective, and select the blue + Create a deployment button.
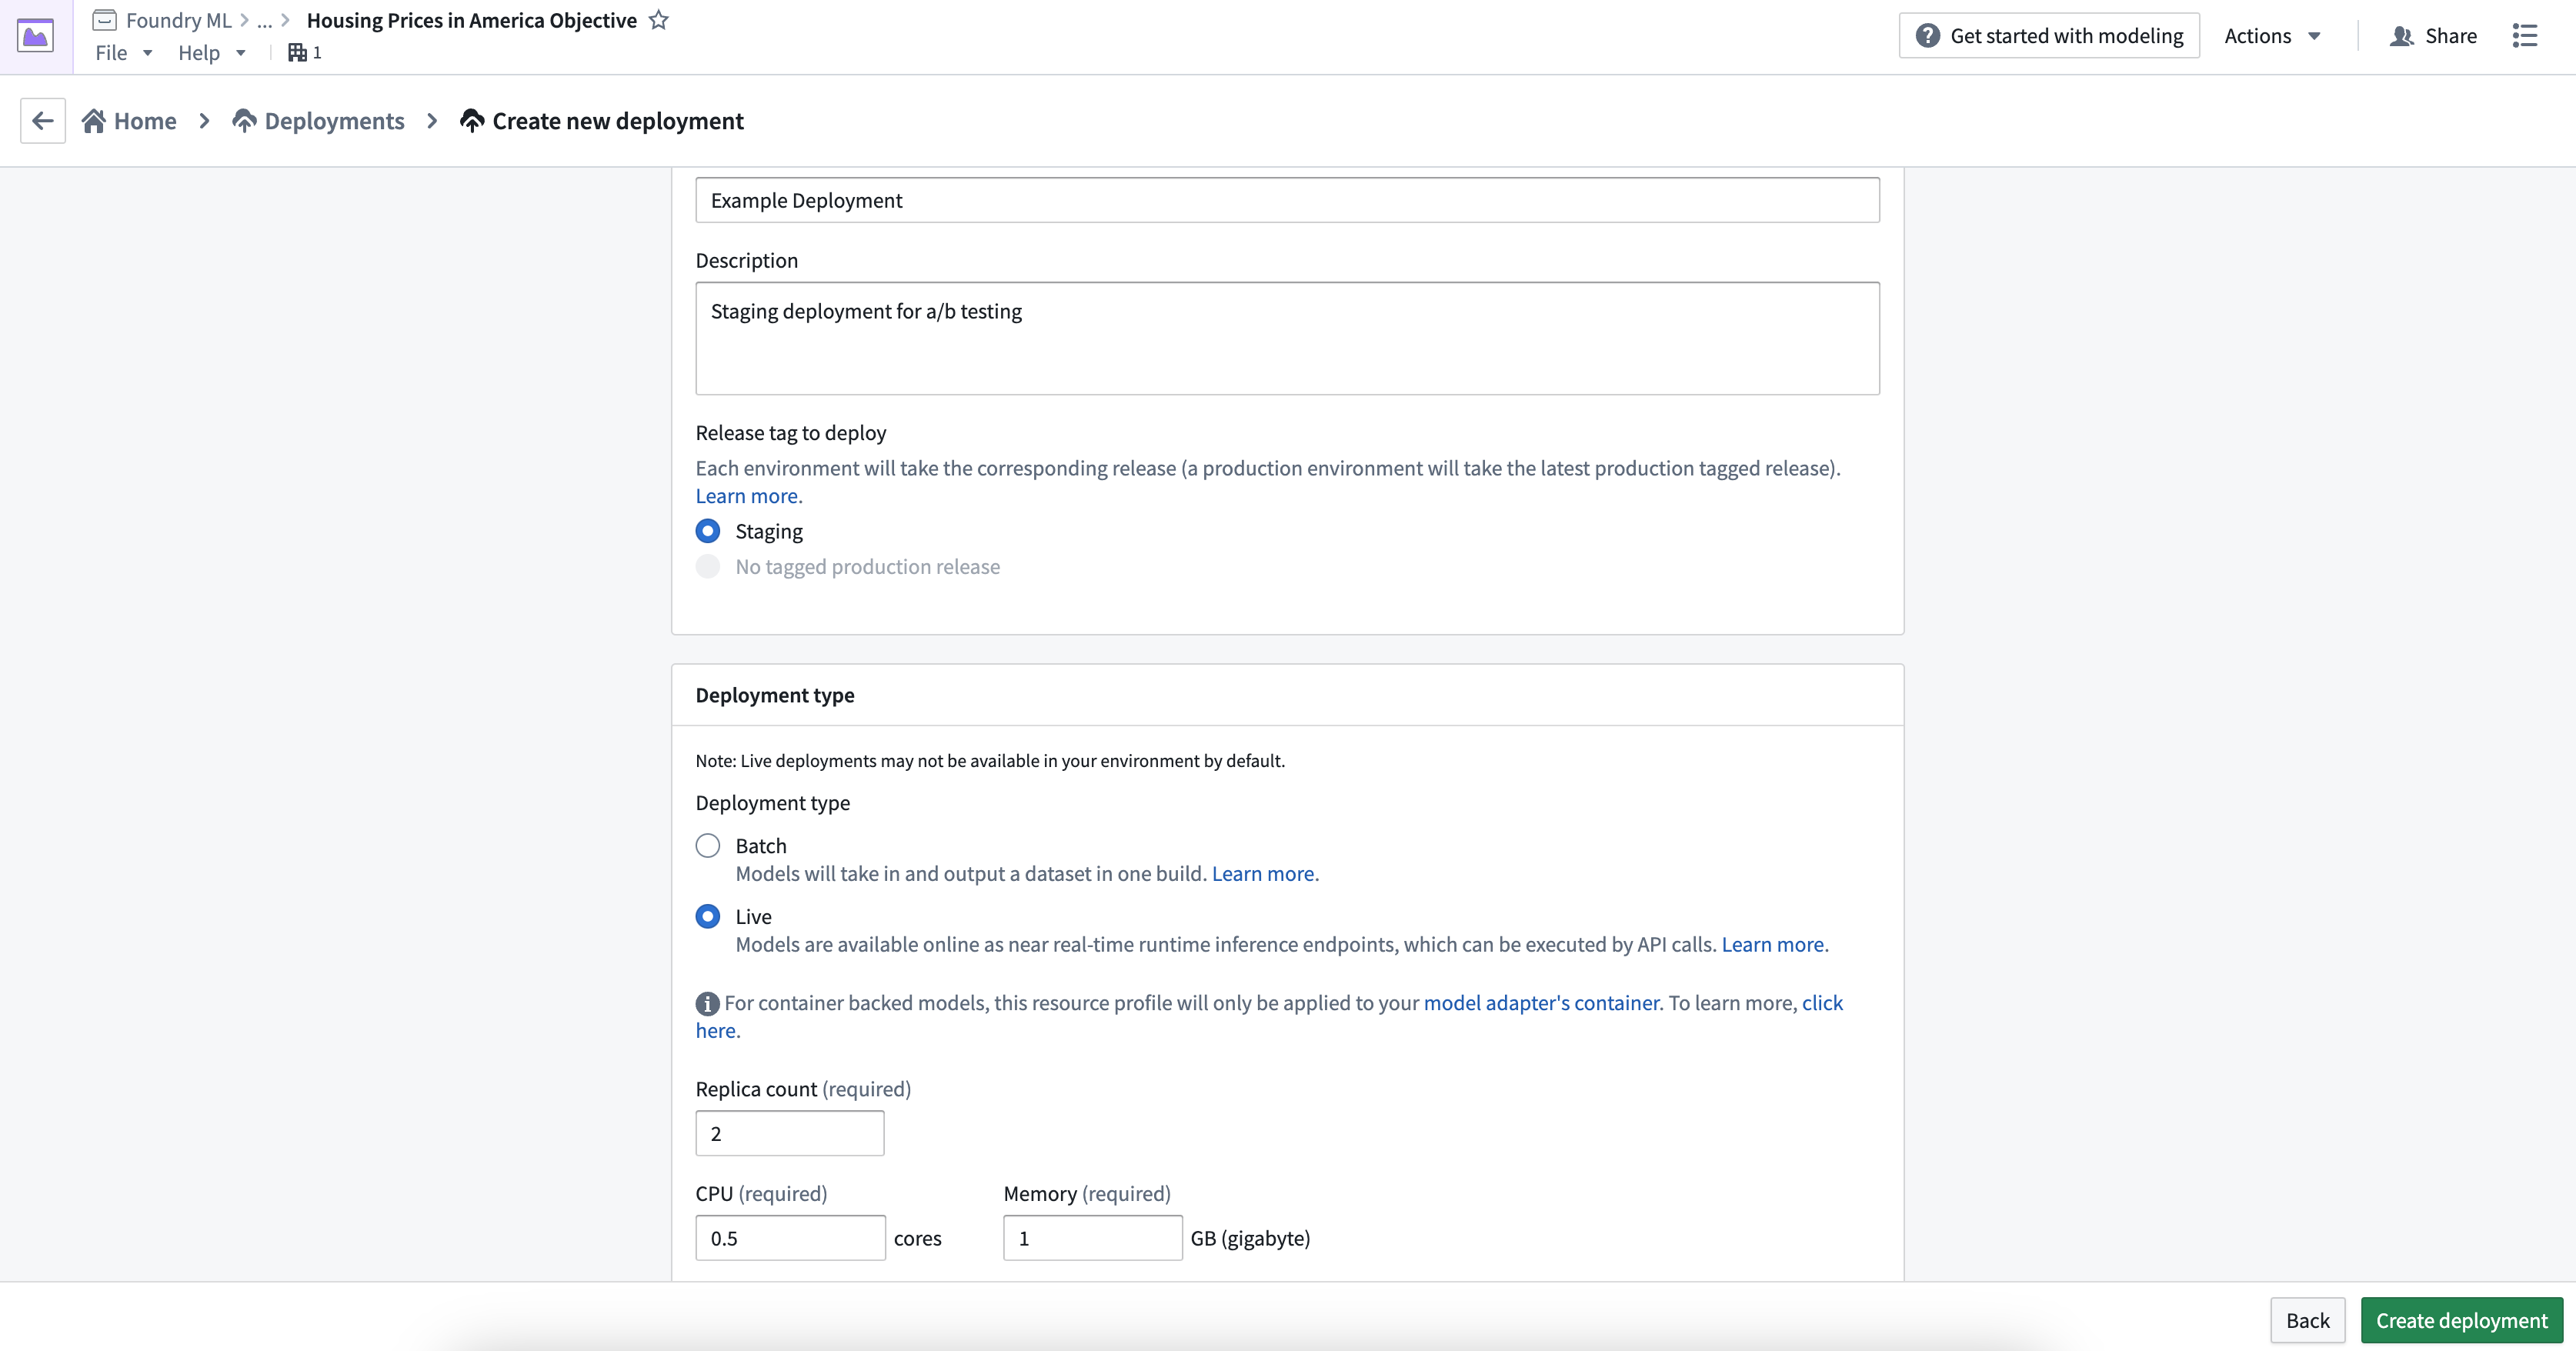
Fill out the deployment name, a description, and whether this deployment should be based on the current staging or production released model. Once configuration is complete, select Create deployment.
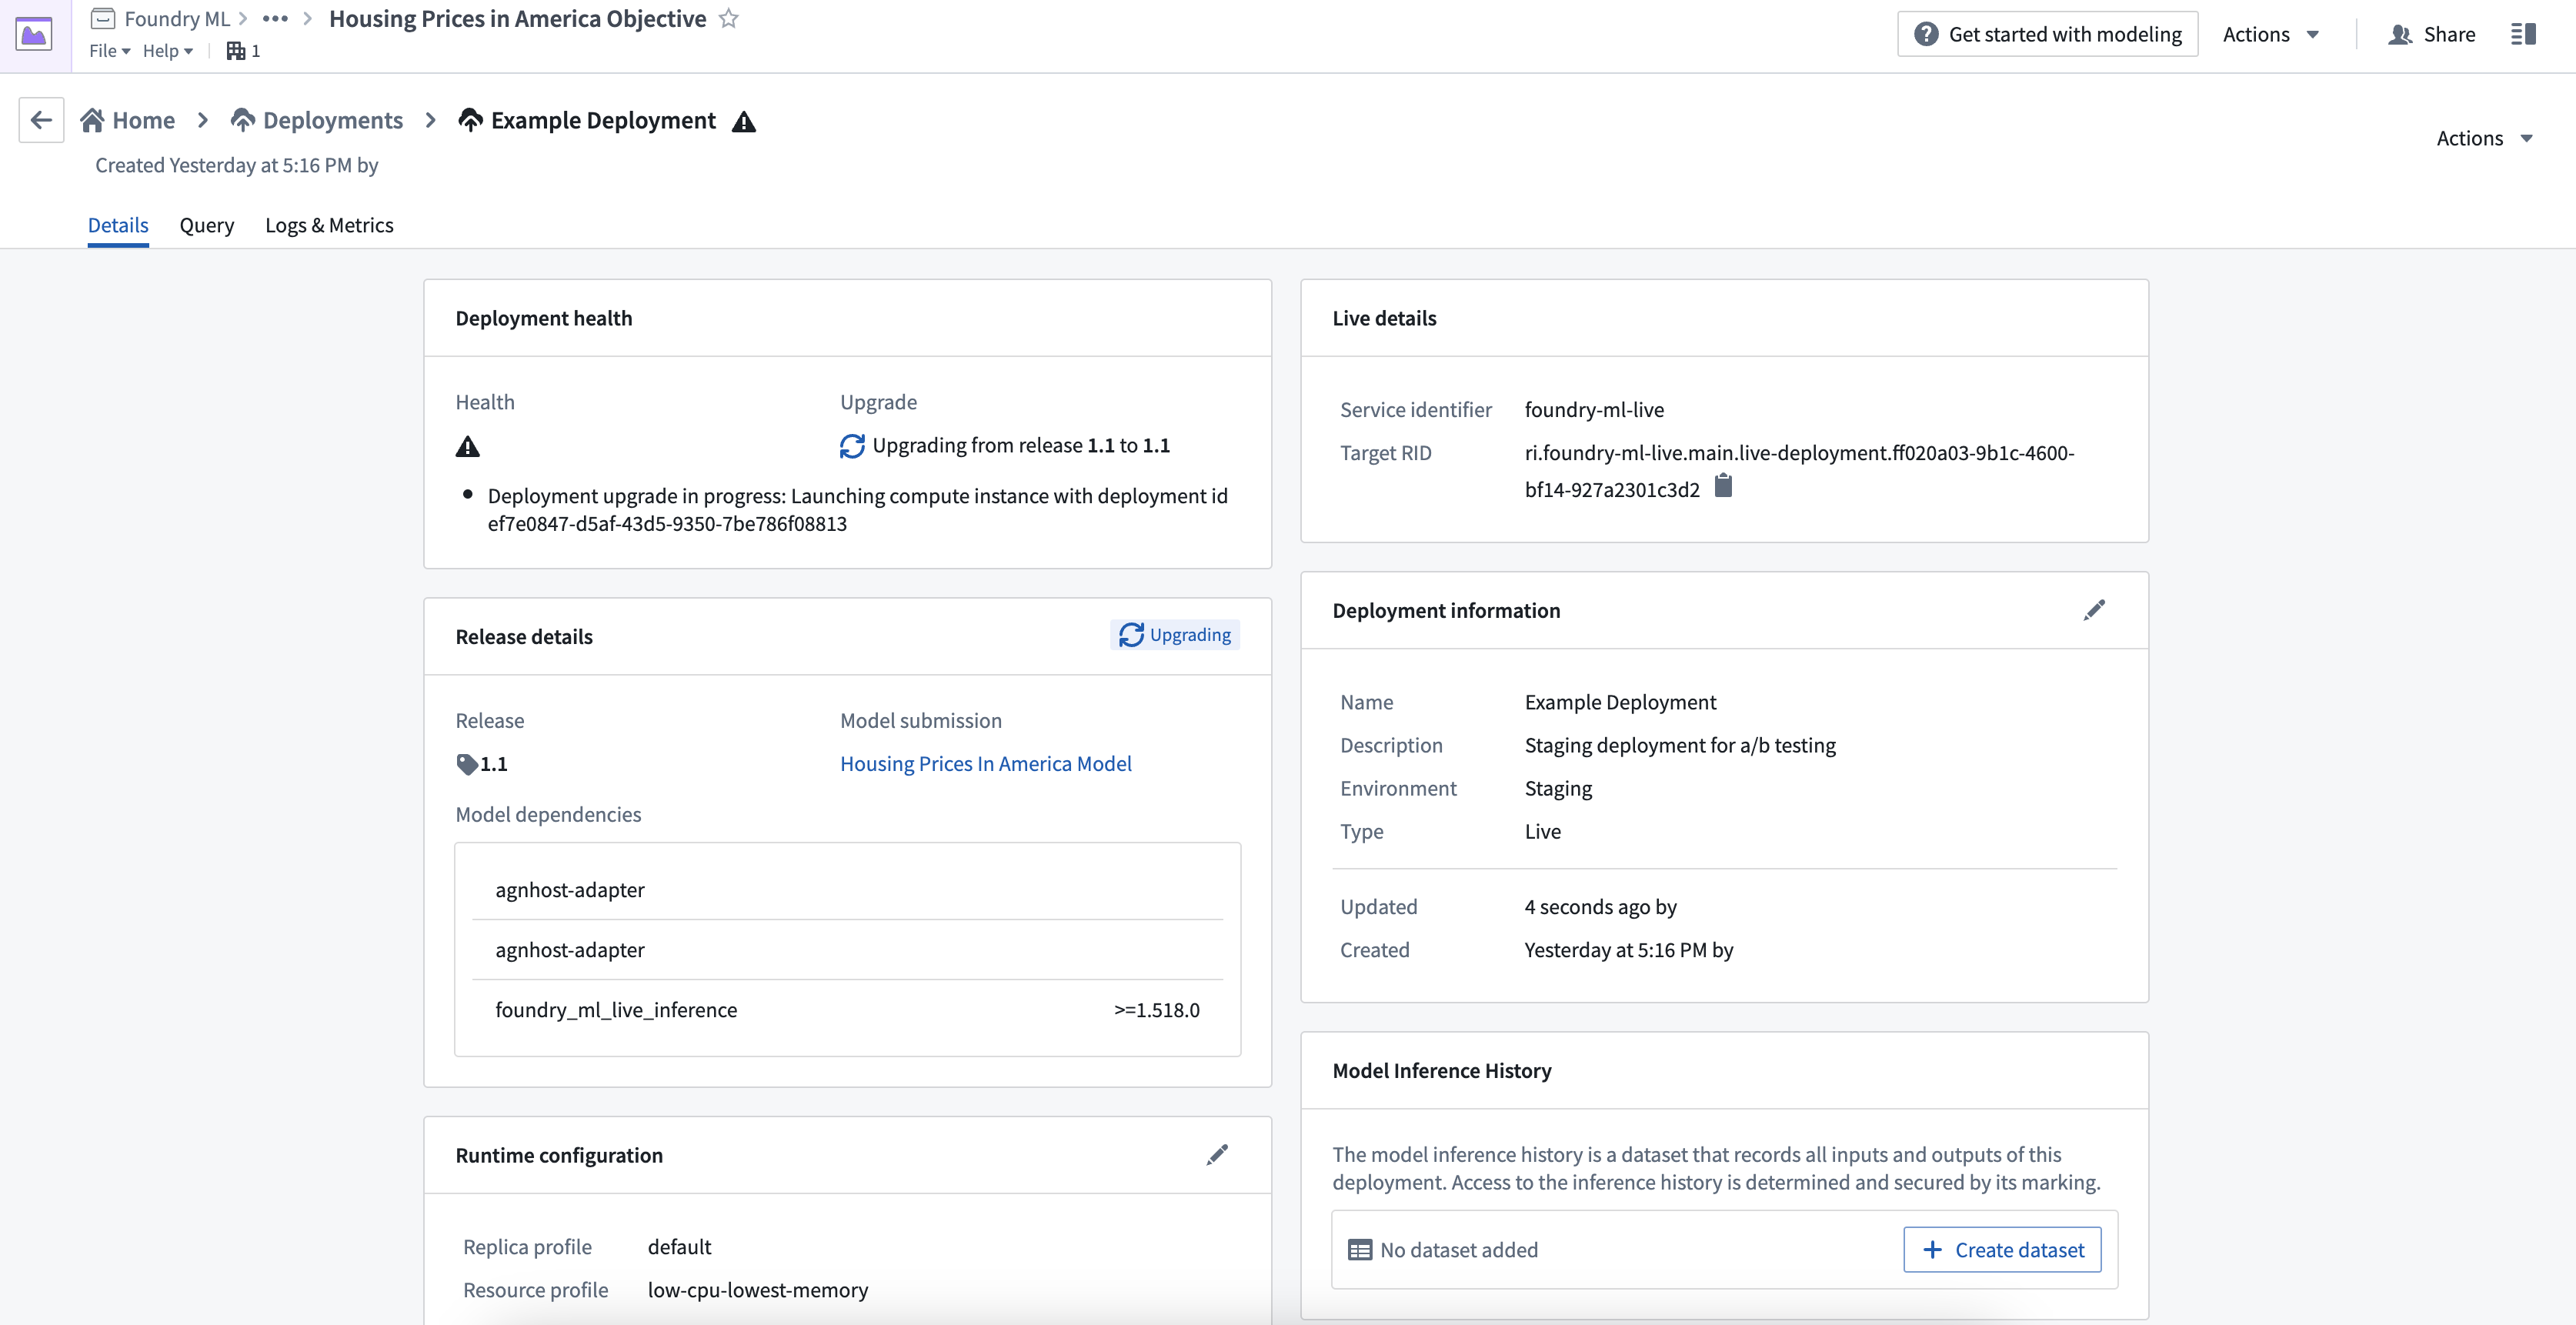
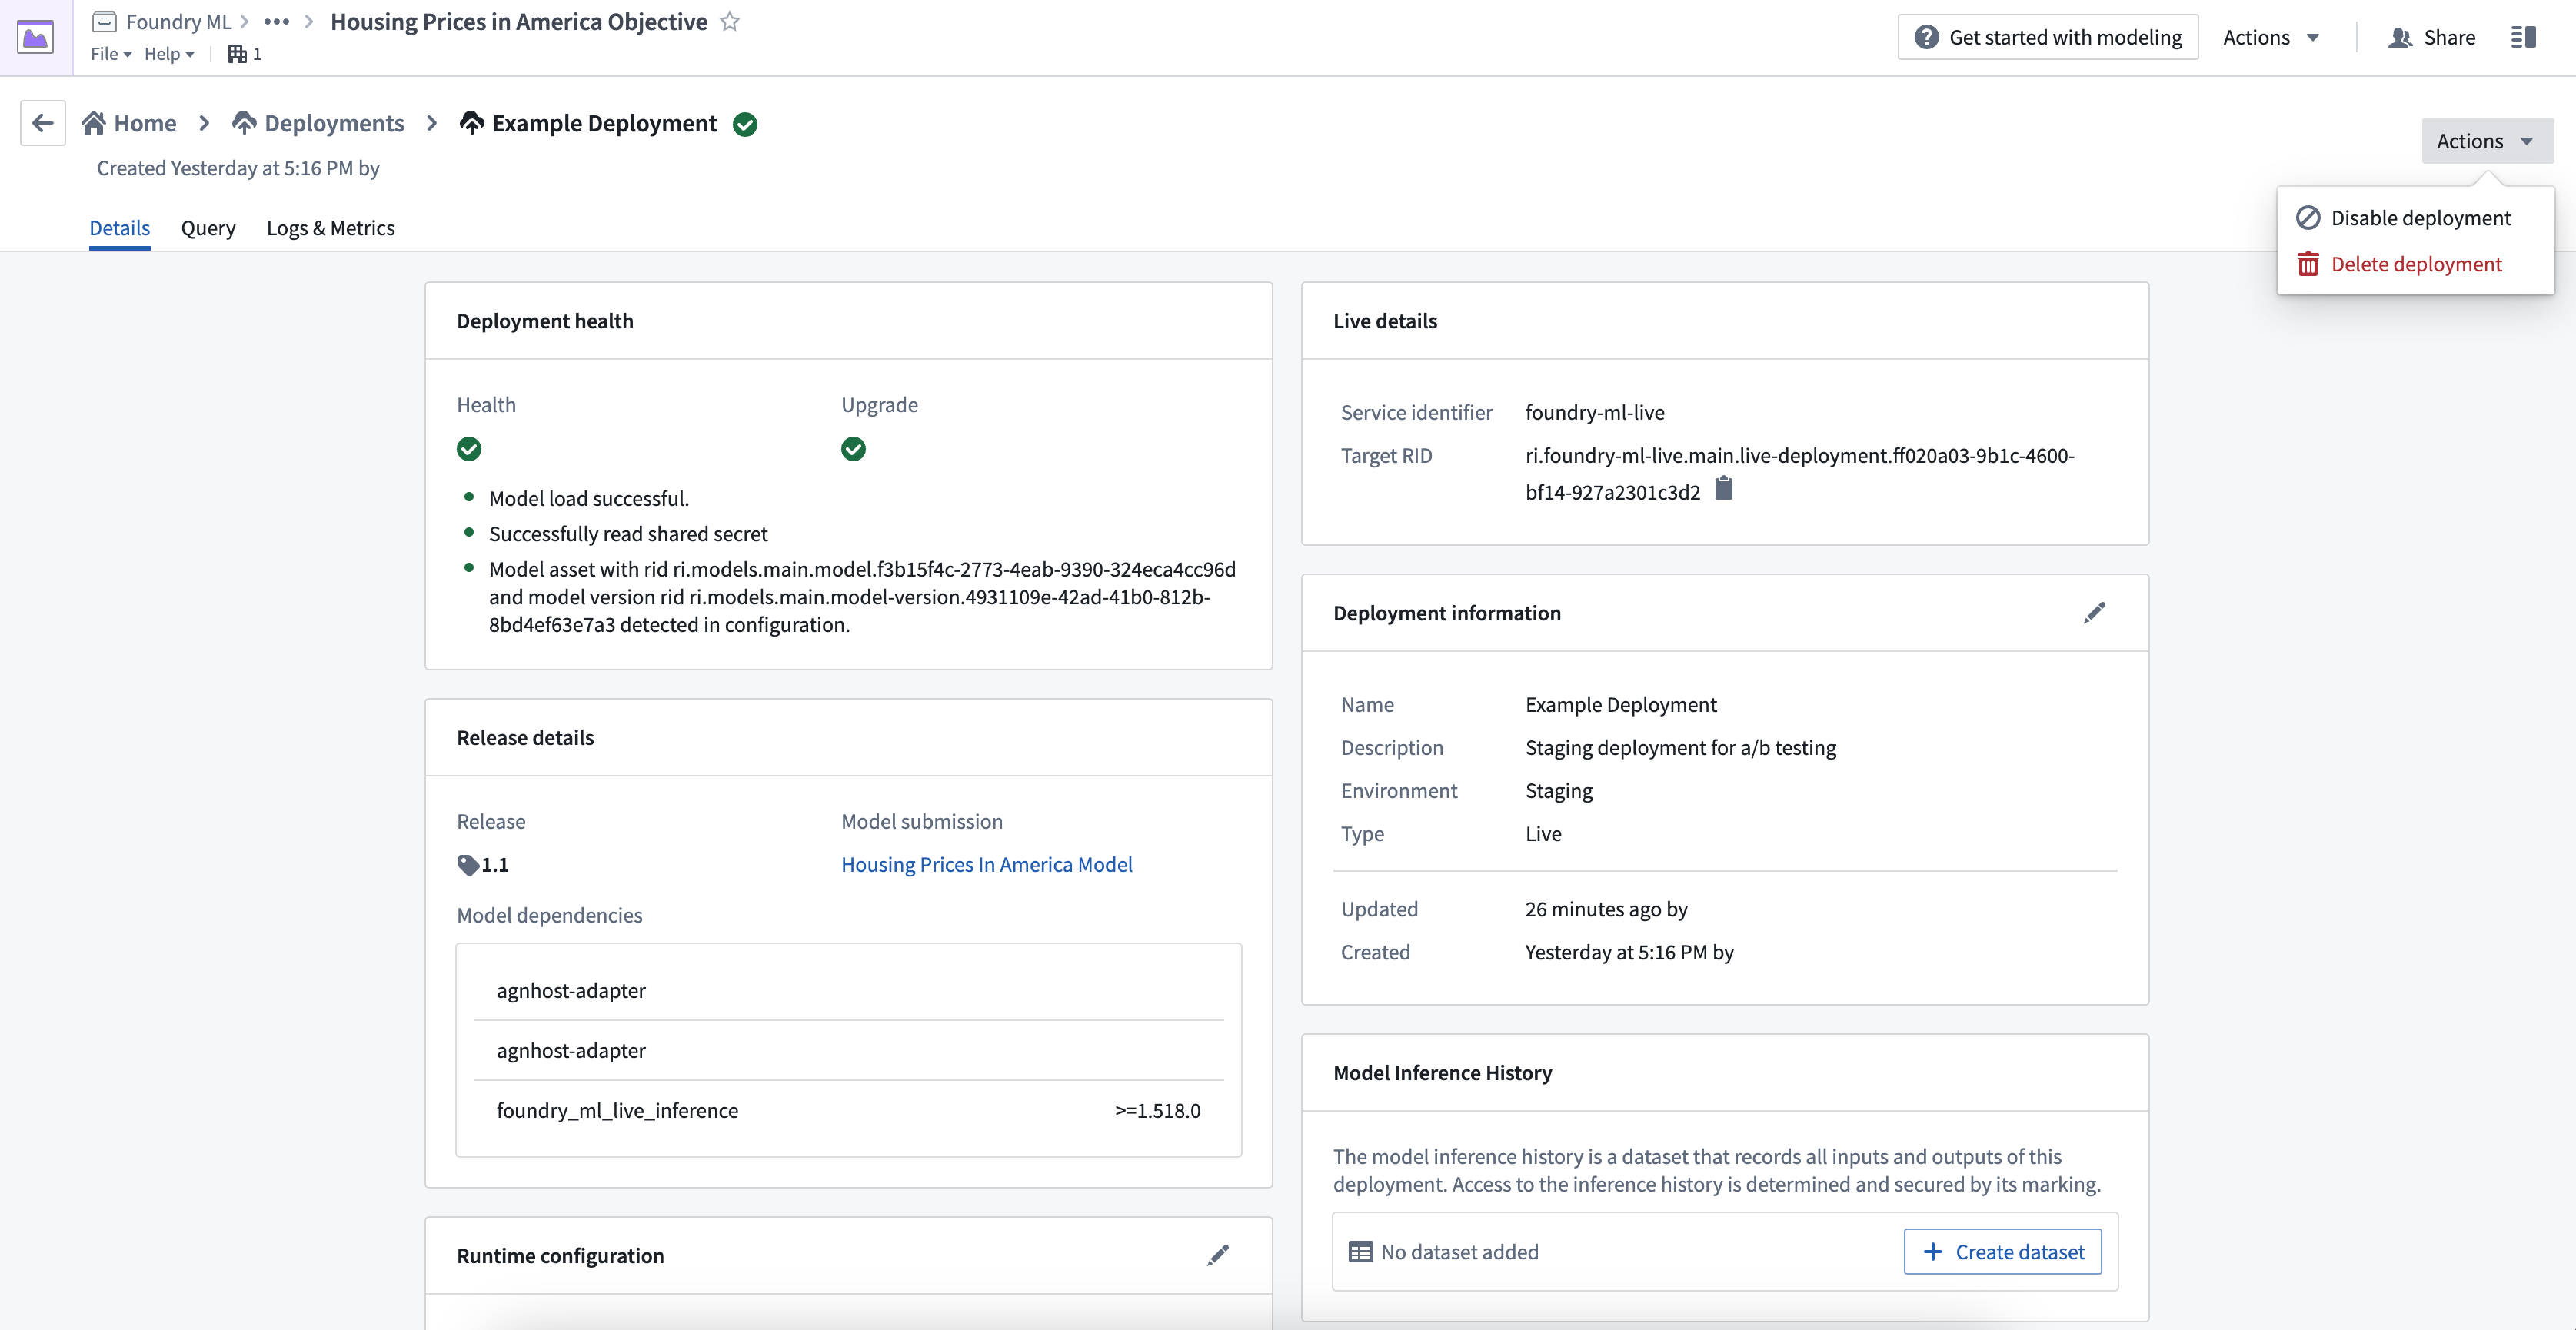
Select the newly created deployment to open the details where you will see interim statuses, indicating that the container image containing the latest release and inference code is being deployed.
Publish function
You can publish a function for the deployment, enabling usage of models for live inference in Workshop, Vertex, and other end-user applications.
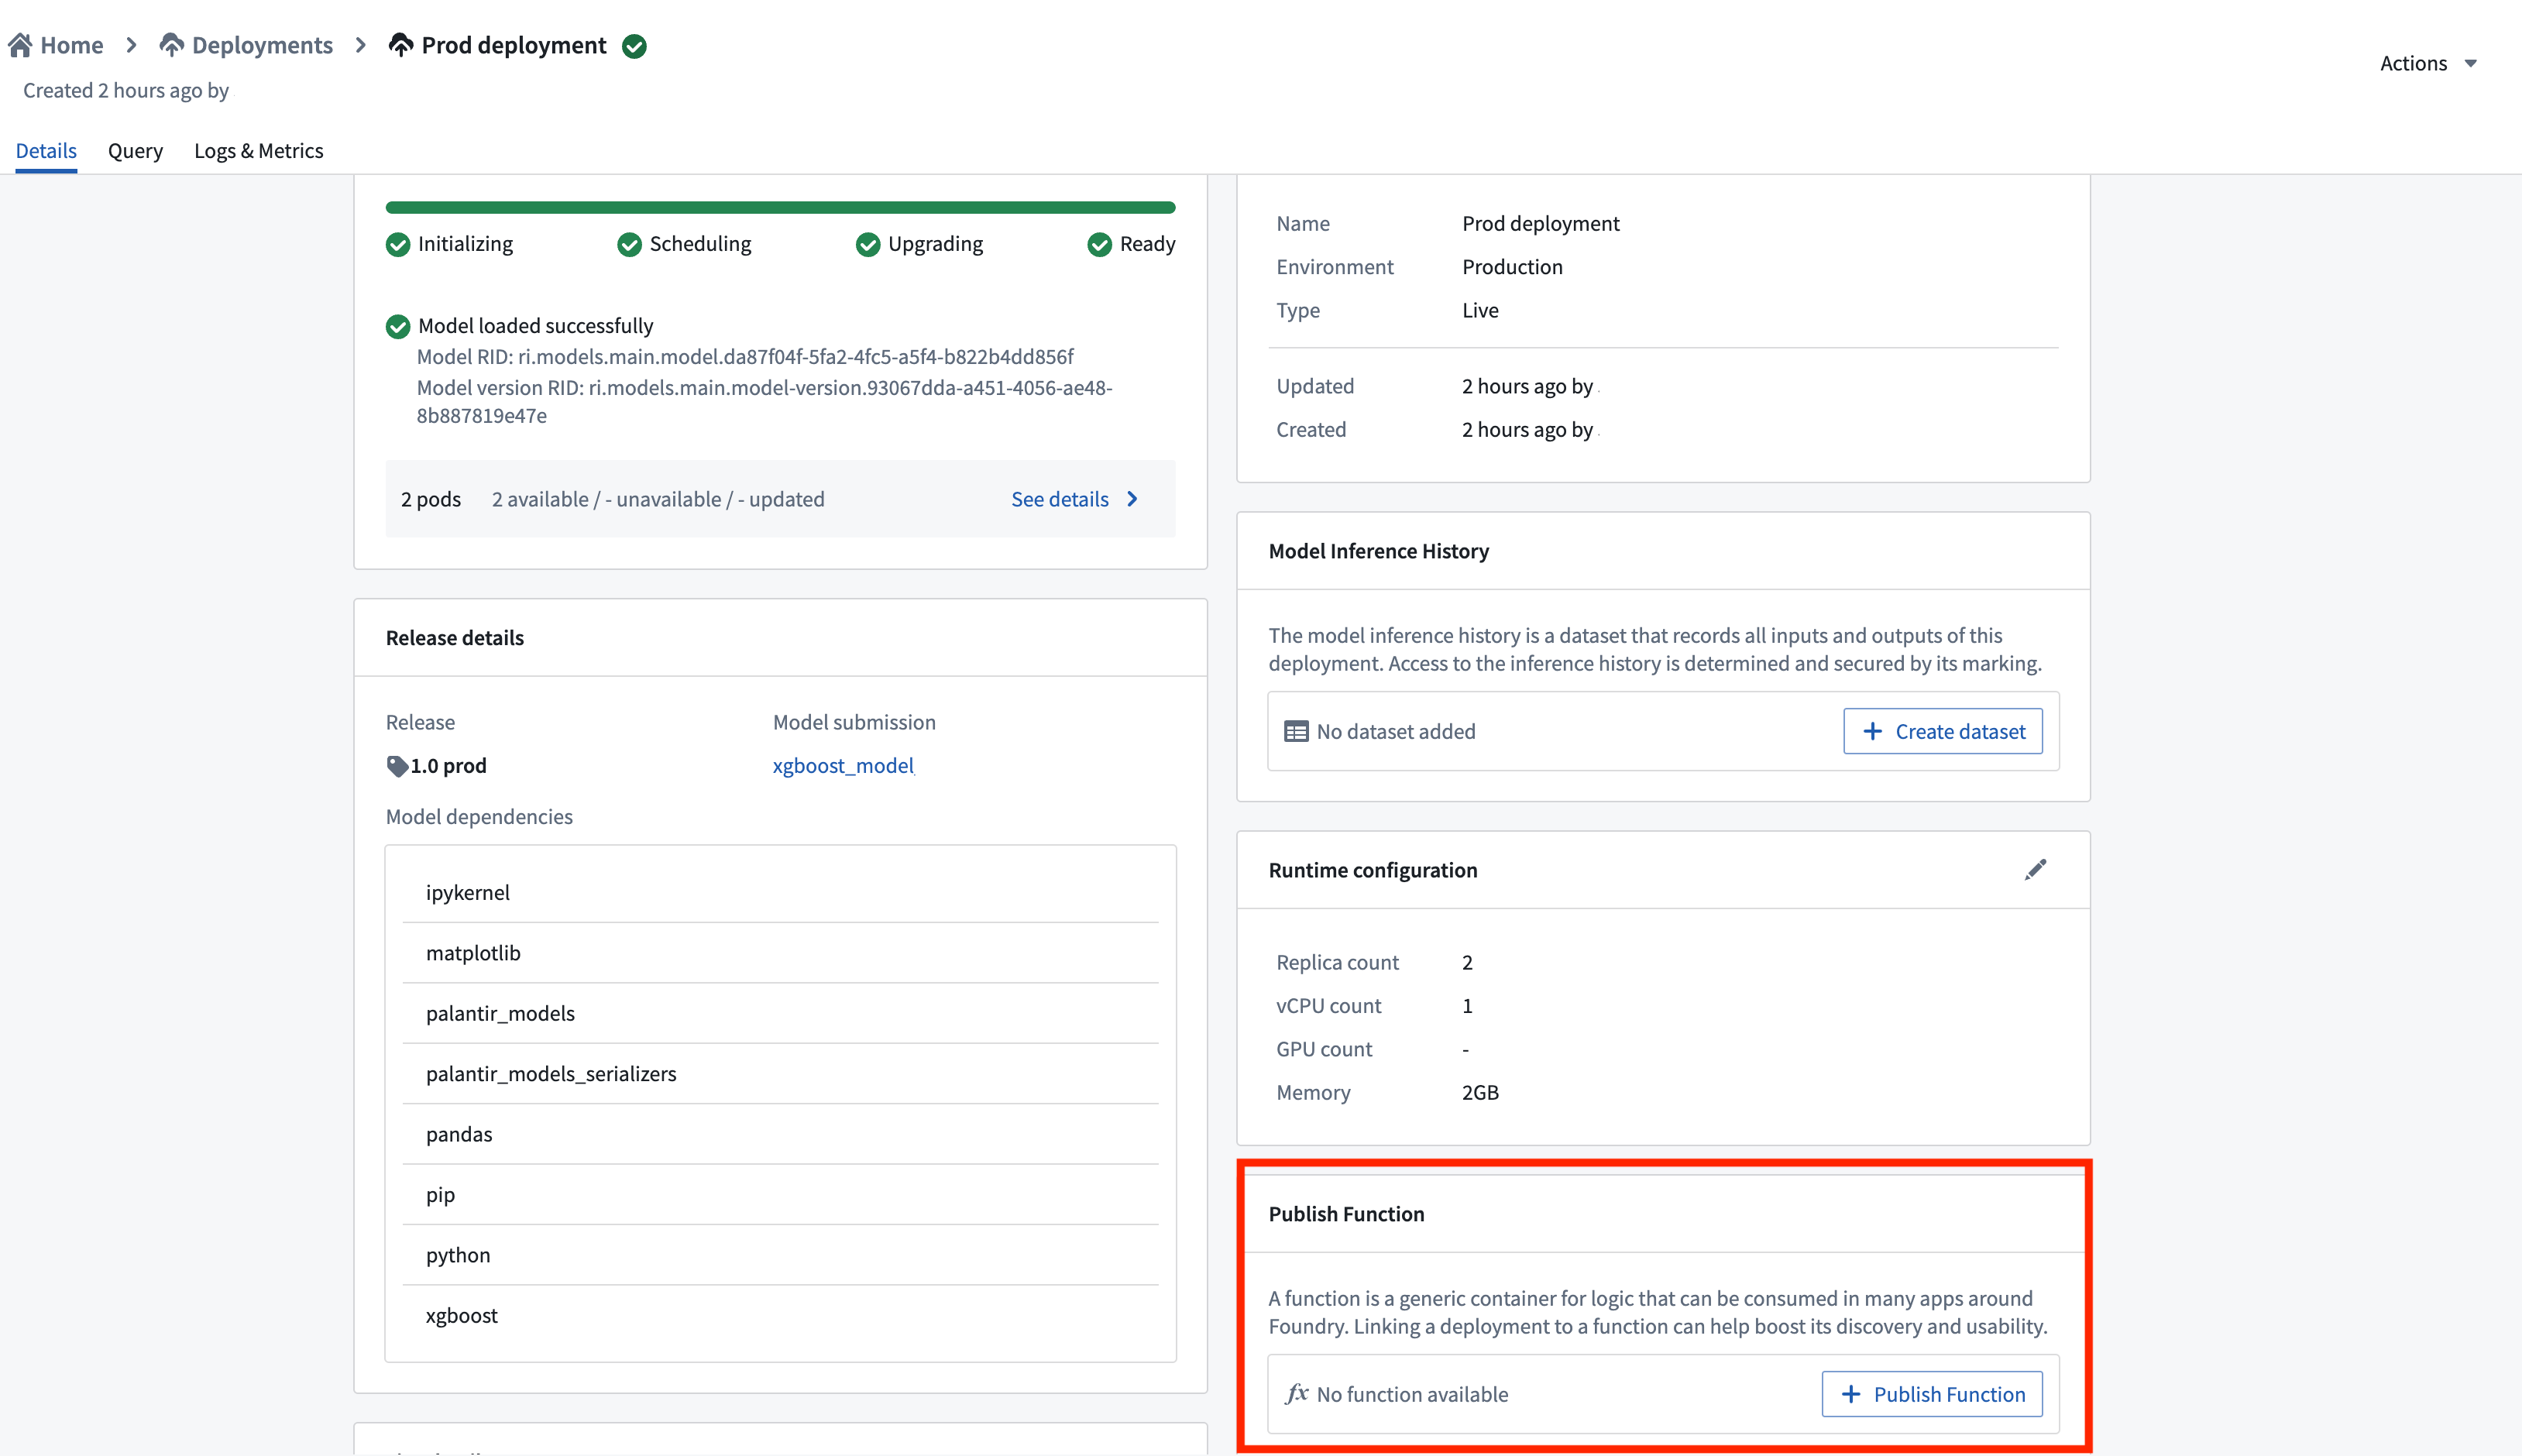
To publish a function, navigate to the Details page of your deployment and select Publish Function. This creates a wrapper function with the same input and output API as your model, which can be imported and called from a functions repository to add custom business logic.
For details on function behavior, version upgrades, and configuration options, see the Model functions developer guide.
Status and health
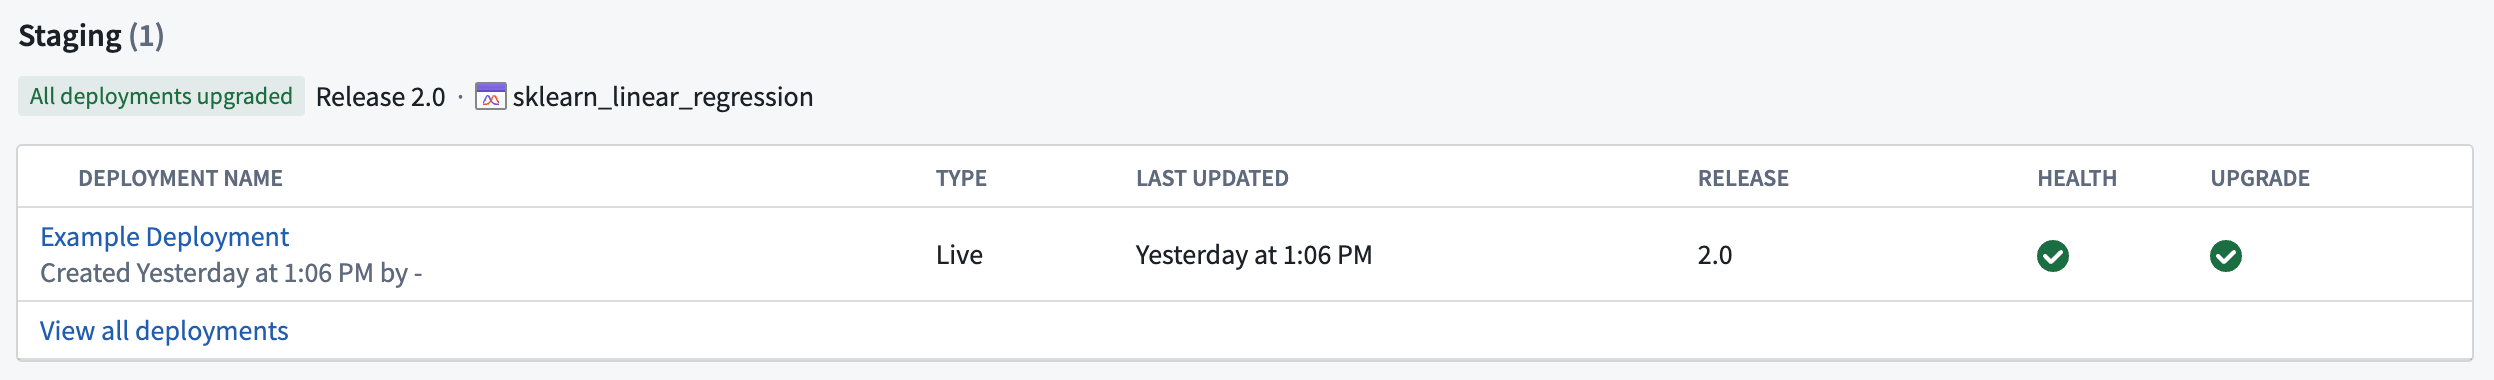
After the deployment finishes updating, the status and health should both appear as green checkmarks. These indicate the deployment is ready for querying and has been successfully updated to contain the latest released model.
Test live deployment
You can test the live deployment endpoint by going to the Query tab on the deployment details page. You can author the input request, send it to the live endpoint, and view the model output response. Two query types are available: single I/O and multi I/O.
Single I/O queries only support single tabular input/output, while multi I/O queries only support the ModelAdapter API defined in a model asset. Model assets support both single I/O and multi I/O query types, while dataset-backed deployments only support single I/O queries.
Example command
Below is an example of how to query a live deployment via curl using single I/O with the transform endpoint:
curl -X POST https://<URL>/foundry-ml-live/api/inference/transform/ri.foundry-ml-live.main.live-deployment.<RID>
-H "Authorization: <BEARER_TOKEN>" -H "Accept: application/json" -H "Content-Type: application/json" -d
'{"requestData":[{"house-location":"New York", "bedrooms":3,"bathrooms":1.5}],
 "requestParams":{}}'
Alternatively, the example below shows how to query a live deployment via curl using multi I/O with the transformV2 endpoint:
curl -X POST https://<URL>/foundry-ml-live/api/inference/transform/ri.foundry-ml-live.main.live-deployment.<RID>/v2
-H "Authorization: <BEARER_TOKEN>" -H "Accept: application/json" -H "Content-Type: application/json" -d
'{"input_df":[{"house-location":"New York", "bedrooms":3,"bathrooms":1.5},{"house-location":"San Francisco", "bedrooms":2,"bathrooms":1}]}'
Deployment actions
Management actions
There are two options to take on a running live deployment:
- Disable to turn off the deployment but still allow for re-enablement to leverage the same Target RID.
- Delete to remove the deployment completely. The old Target RID will no longer be able to be queried.
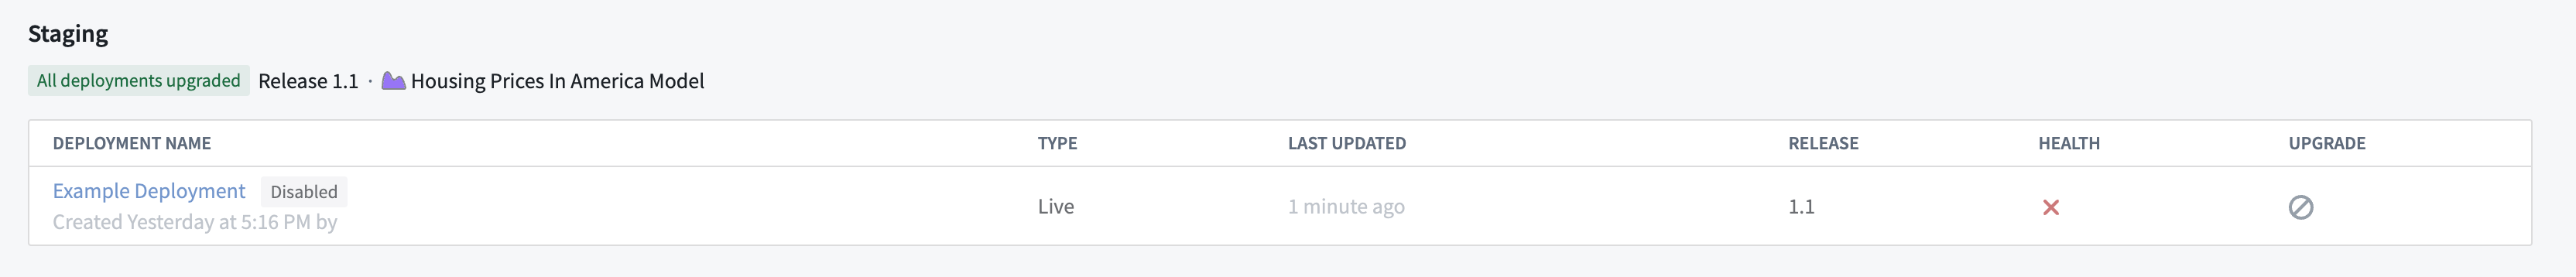
A disabled live deployment will still appear in the Deployments page on an objective and is available to be enabled again.
Resource configuration
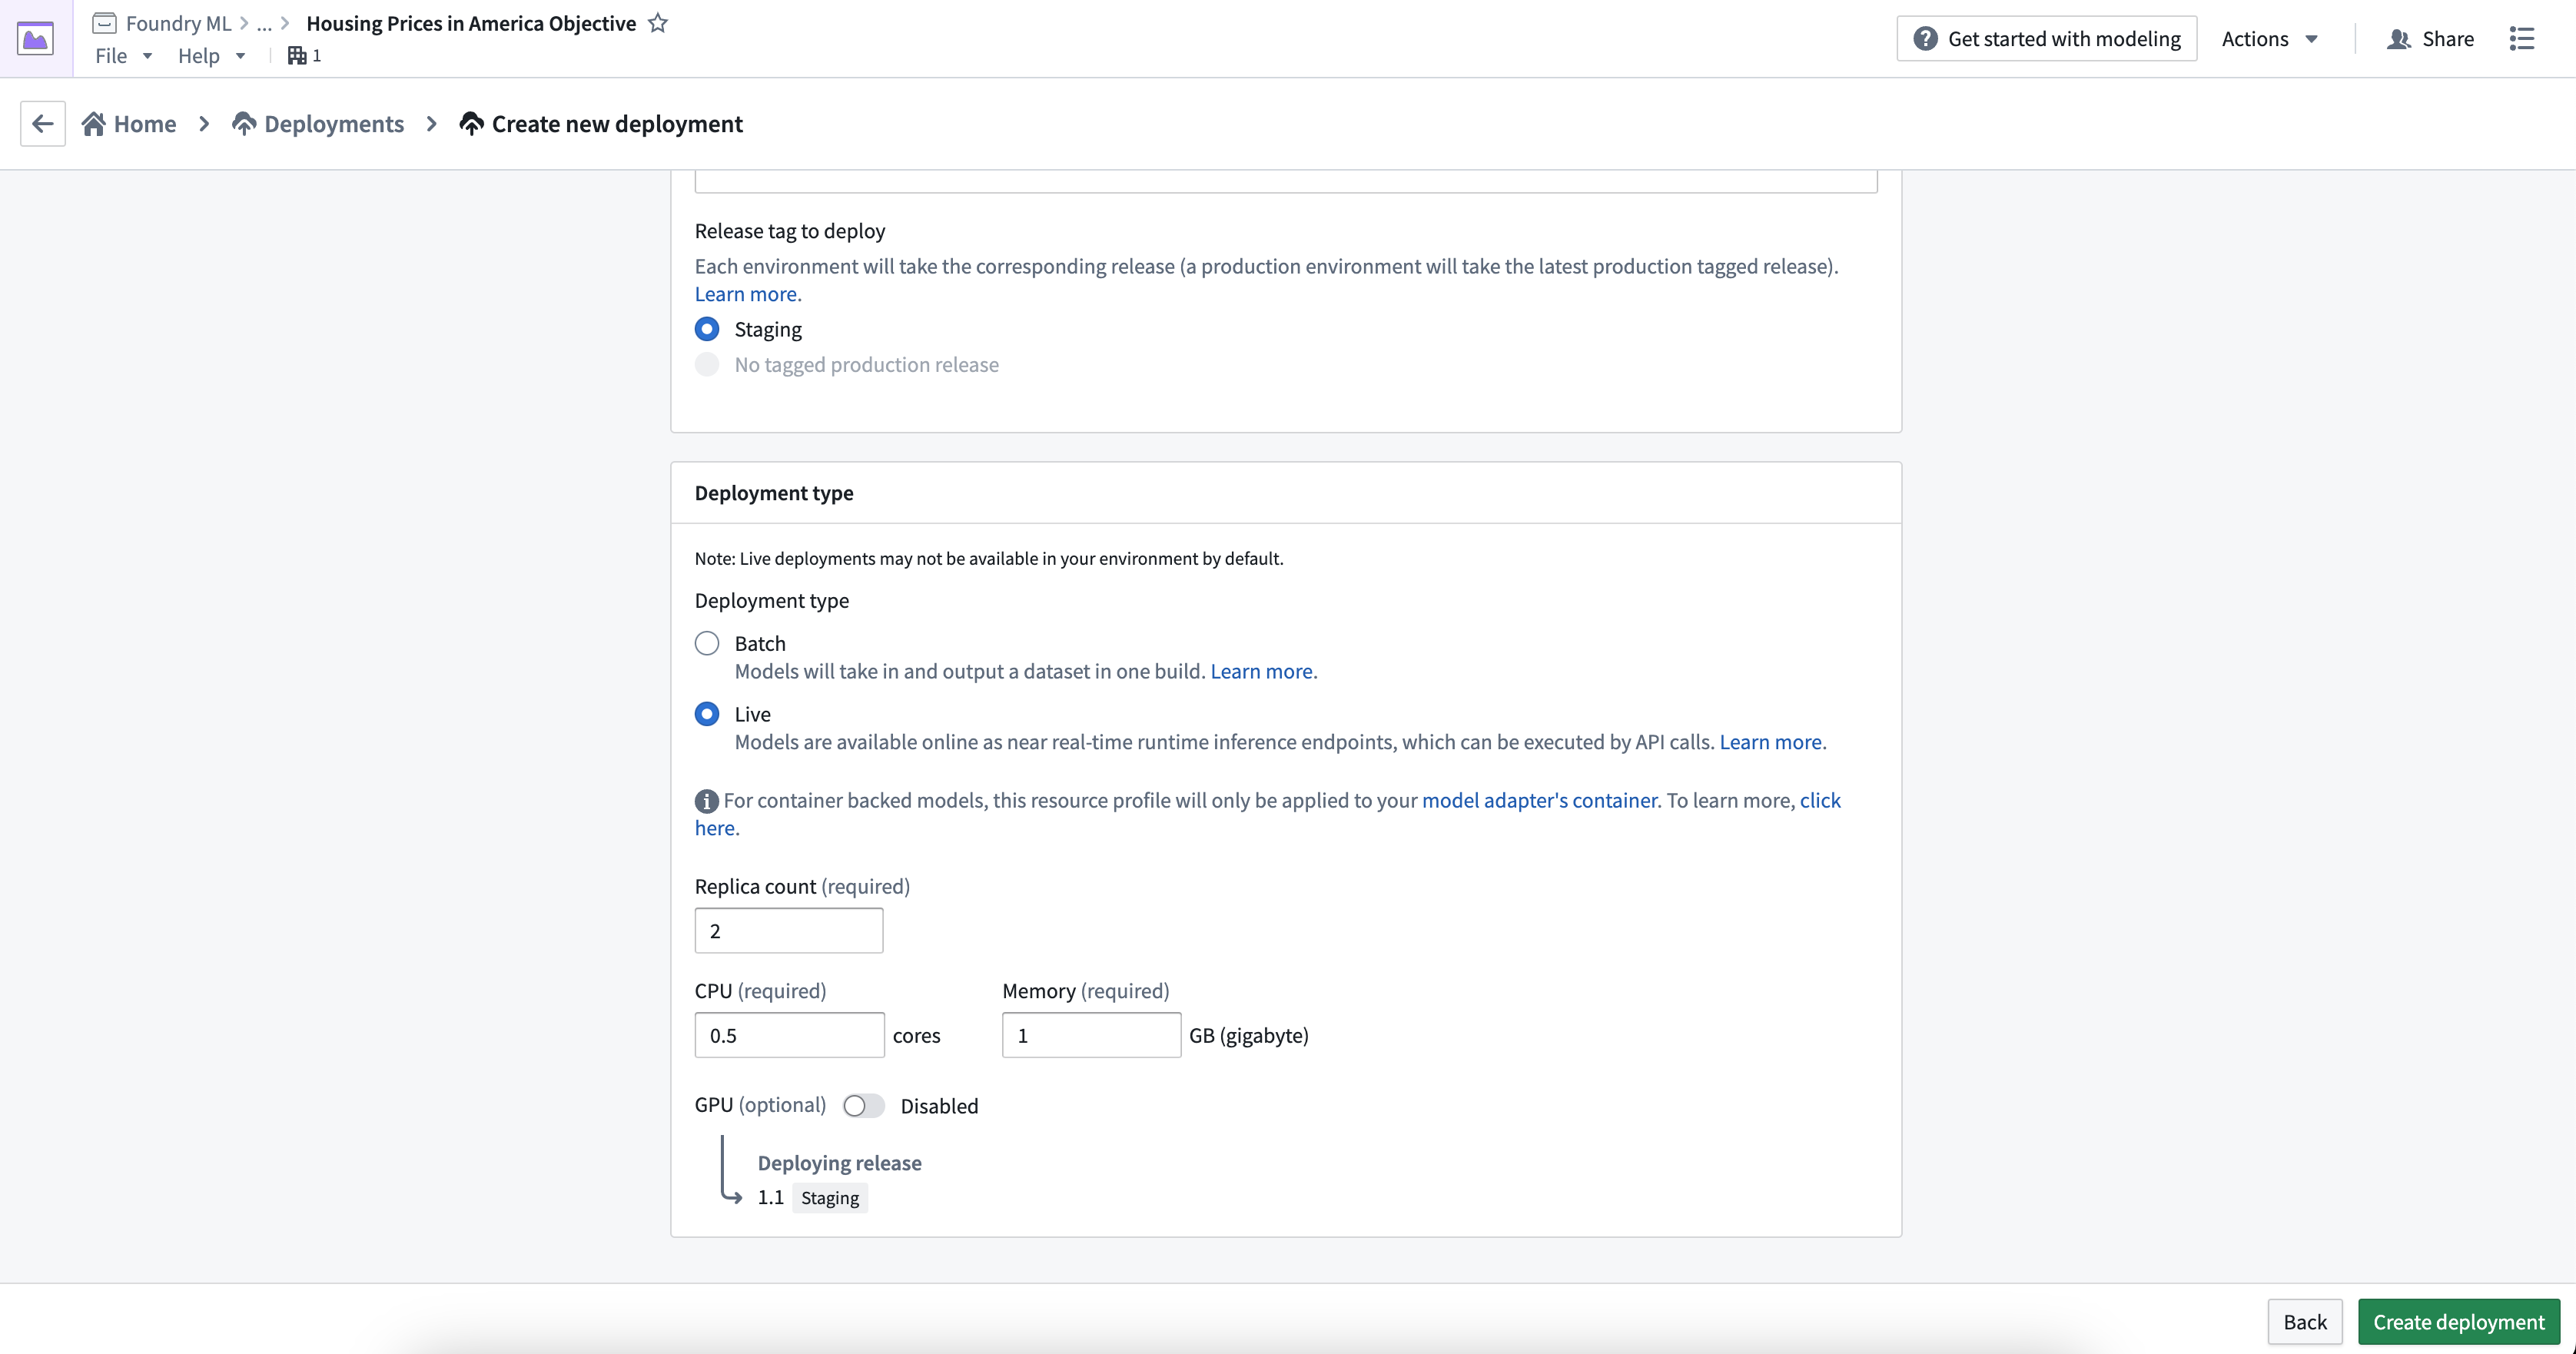
A live deployment is configured with both a replica count as well as CPU and GPU counts.
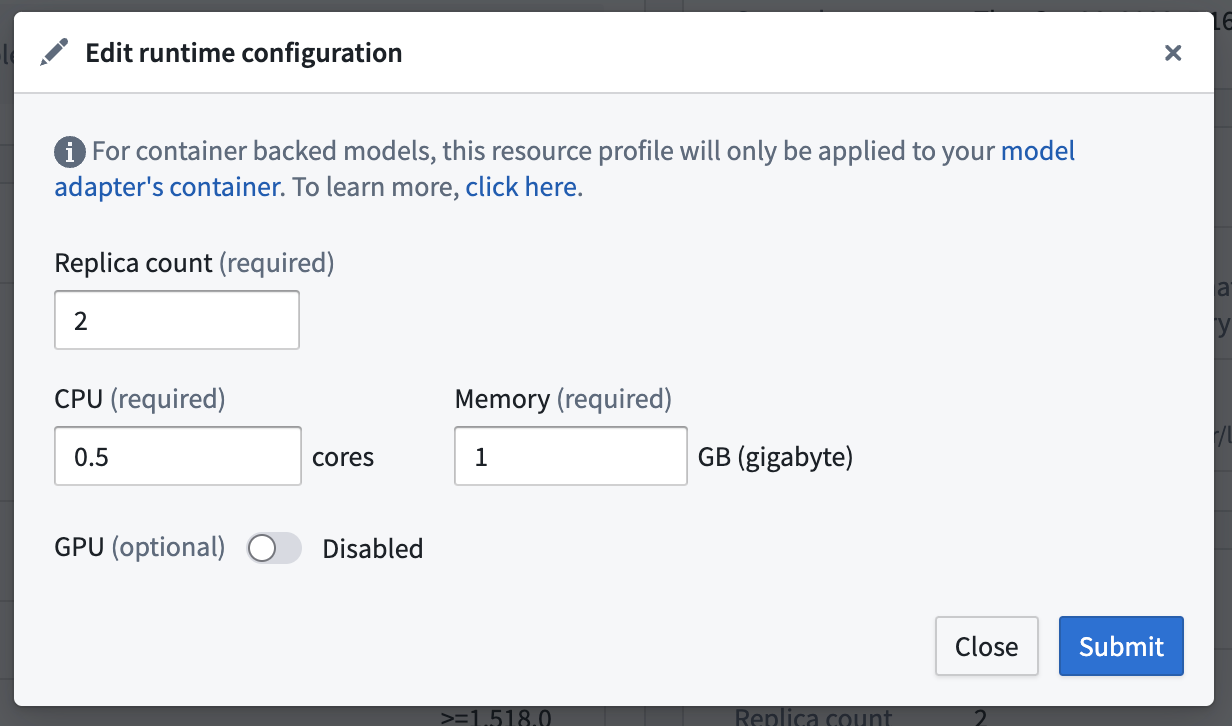
You can configure resource requirements upon deployment creation, as well as edit after the fact. Editing the runtime configuration will automatically trigger a re-run of the deployment, which will upgrade the endpoint with no downtime.
To configure a new live deployment, select Create deployment, select Live under Deployment type, then input a replica count and resource configuration.
To edit the configured replica and resources, navigate to the Deployments section in your modeling project, choose your deployment from the listed deployments, and select the edit button under Runtime configuration to edit the replica or resource configuration.
View deployment service logs
A series of logs that describe the deployment's startup progress are emitted from each live deployment; these logs include the URIs of the Conda packages in the release environment that the deployment will attempt to download and install, as well as details around downloading the model itself. In the event that a deployment fails to start successfully, there may be a relevant warning or error level log that can help you understand what happened.
To view service logs directly from the running live deployment, navigate to the Logs & Metrics tab on the deployment details page. You can specify a time window to search within, filter logs by any of the fields, and add or remove columns from the view. You can also download all logs as a text file using the download button in the top right corner.
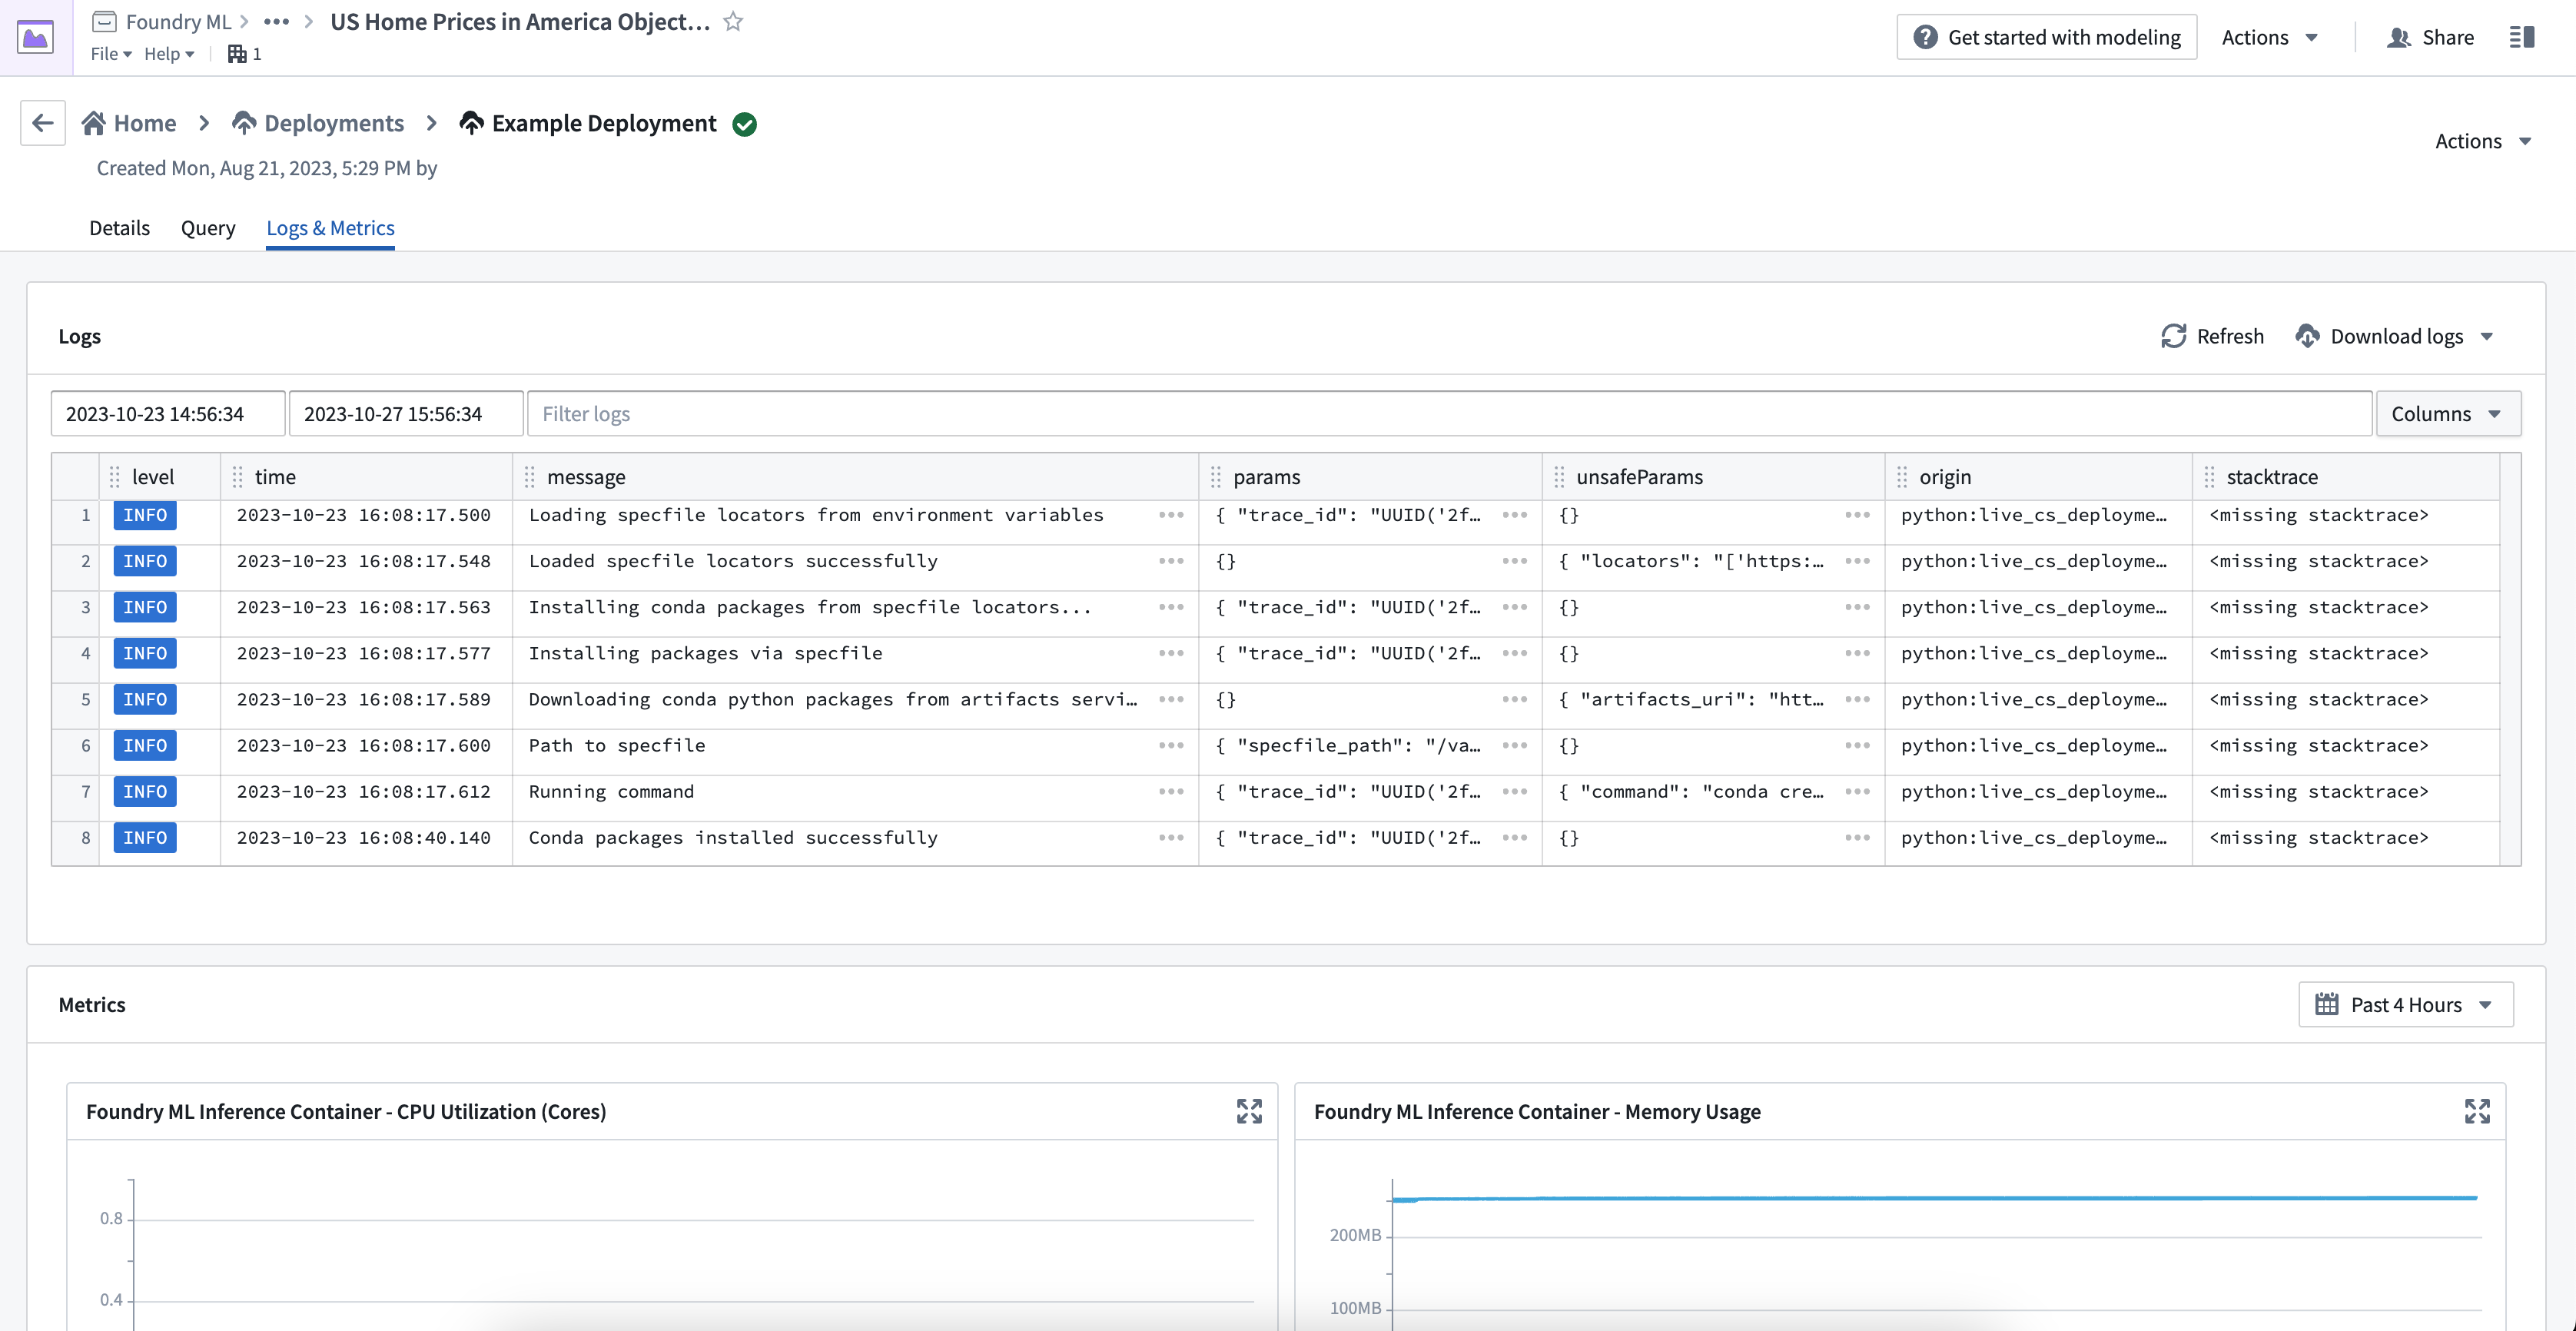
Because you may have configured your deployment to run with multiple replicas, you may see seemingly duplicated logs - each set coming from a different replica. However, each log includes a tag with a unique node_id which you can use to filter by replica if needed. You can use the following notation for this:
tags.node_id:{Insert UUID here}
To emit logs directly from your model, you can use the standard python logging module. Live deployments will make each log line available to be queried from within the Logs & Metrics tab.
import logging

log = logging.getLogger('model-logger')
log.info("Emitting info directly from the model")
To emit logs from a container-backed model, enable telemetry when configuring a model version.
Logs from your live deployment have a retention period of 7 days, after which time they will be unavailable to either view or download.
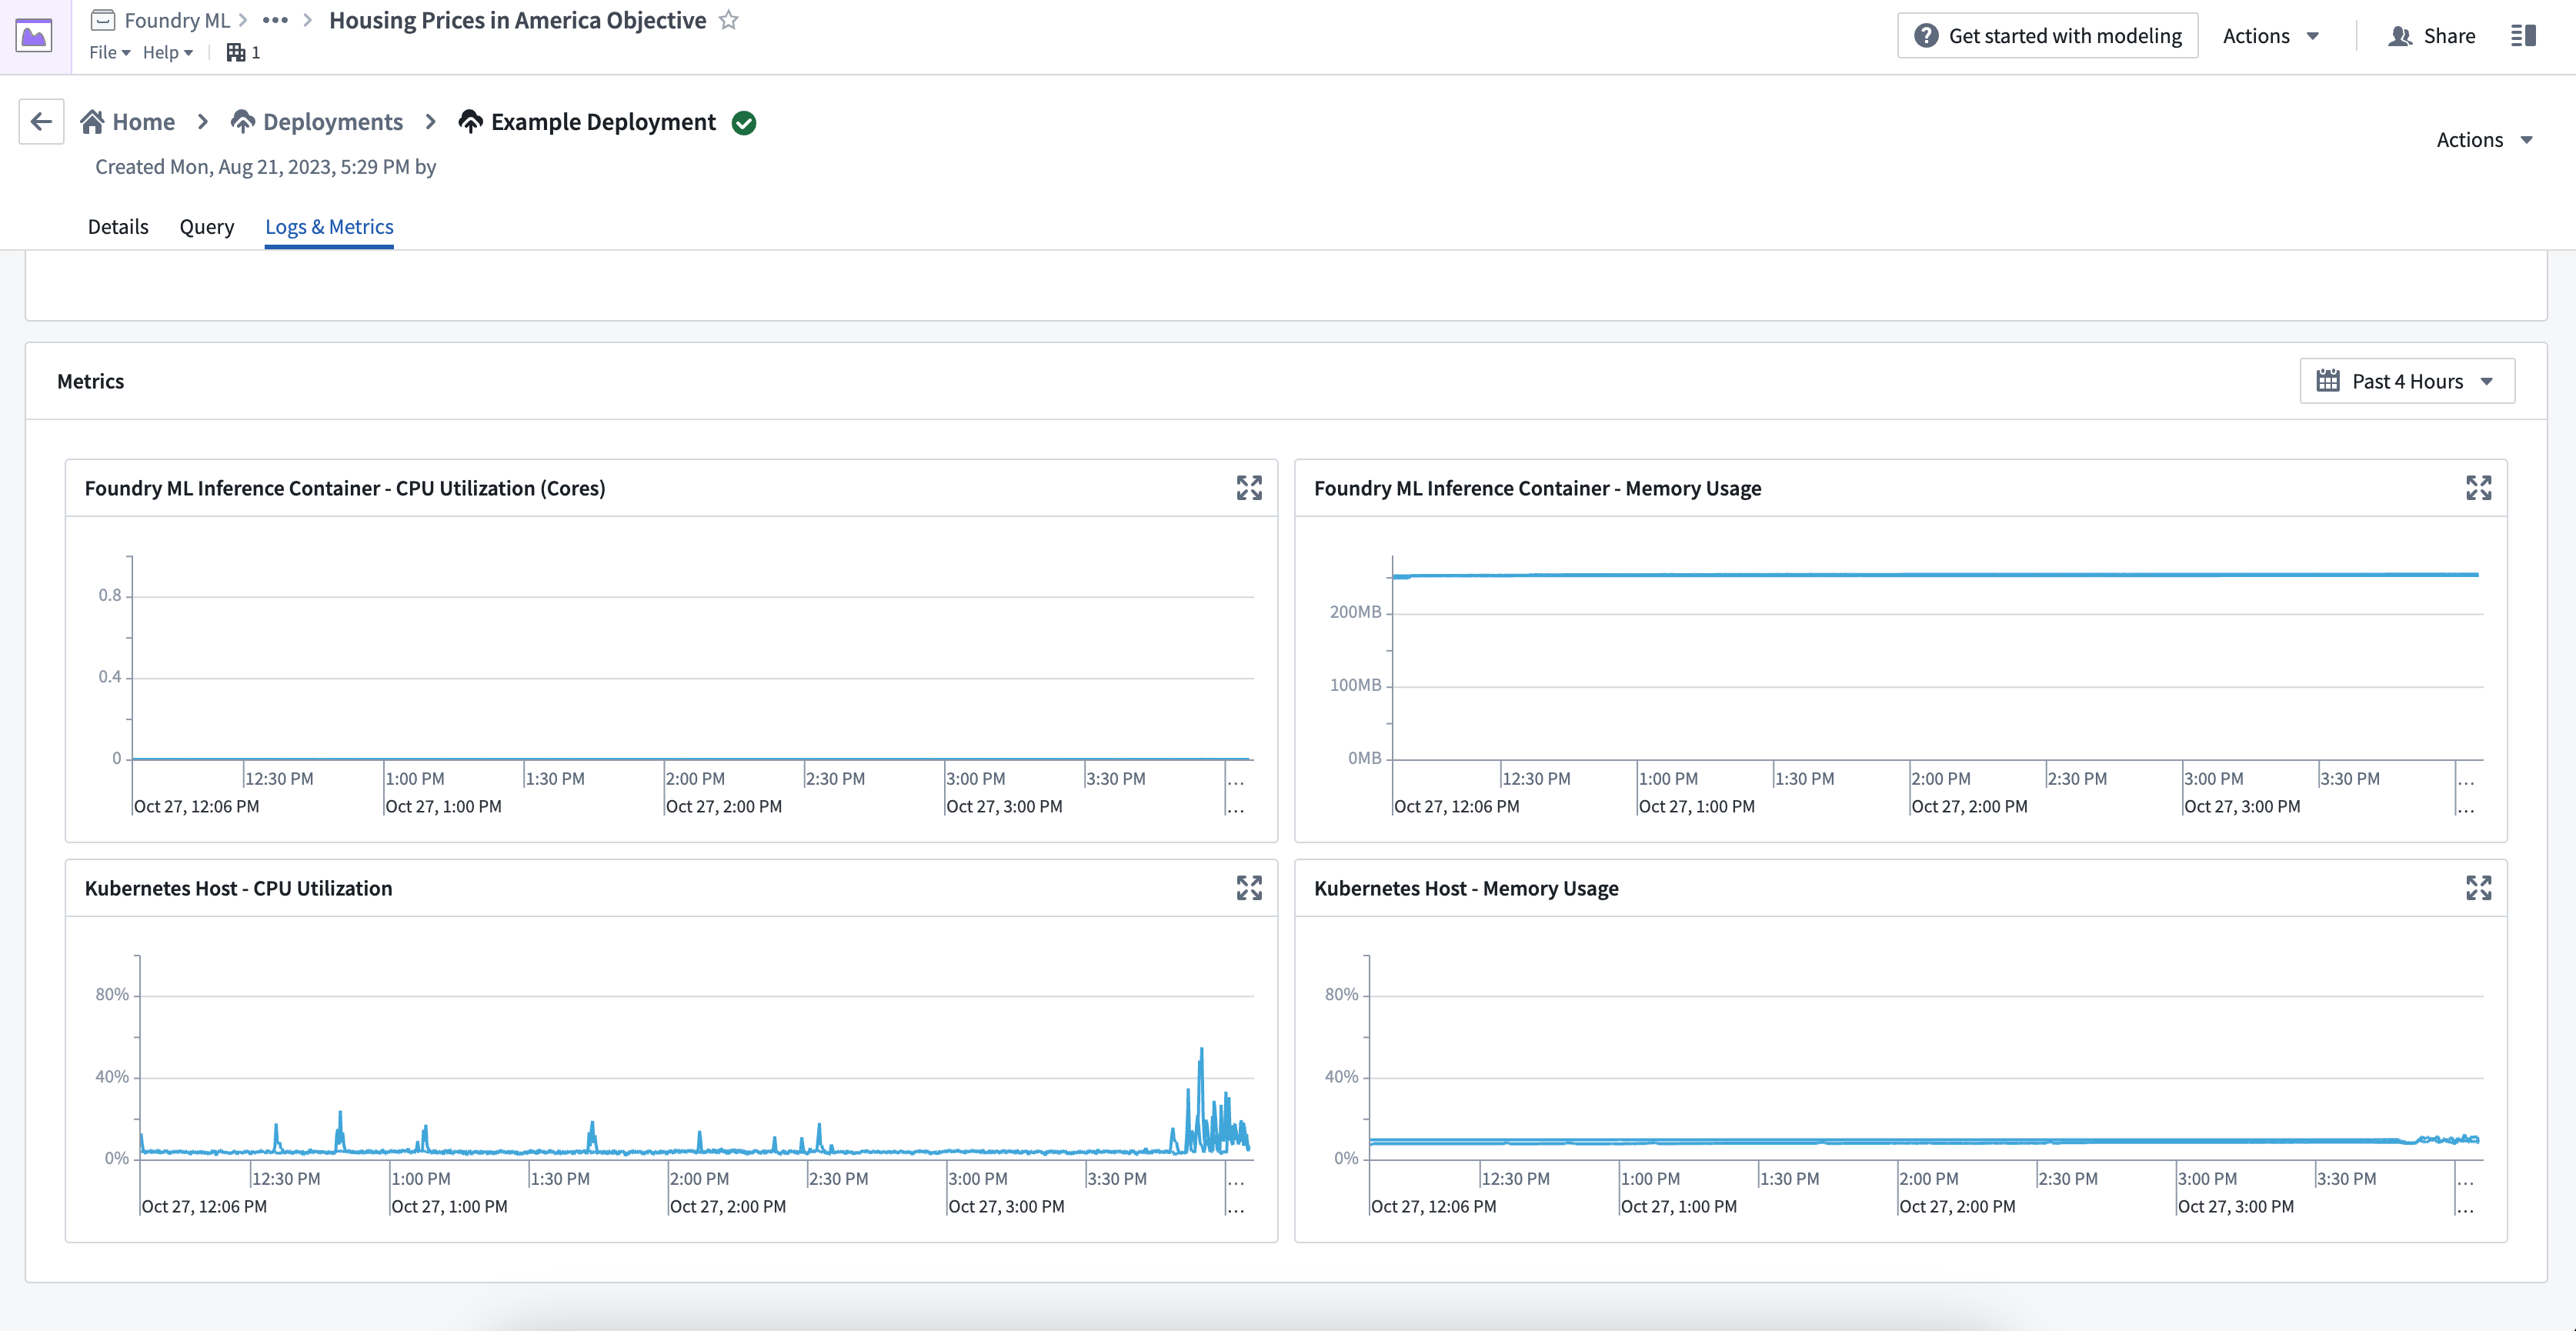
View deployment metrics
The Logs & Metrics tab provides two types of metrics: Kubernetes host and inference container. Be sure to understand the difference between these metric types to properly monitor and debug your models.
Kubernetes host metrics
Kubernetes host metrics show the percentage of memory and CPU usage used by all processes running on the host, not just the processes related to a specific model. These metrics are important for debugging issues related to scheduling and resource throttling. For instance, if your model's performance is slow but the host metrics are at 100%, your model might be getting throttled by the Kubernetes host.
Inference container metrics
Inference container metrics are helpful for debugging resource usage in Python models and model adapter logic. These metrics provide the exact memory usage and CPU core usage of the inference container, independent of the entire Kubernetes host. Currently, usage metrics are not available for container-based models.
:::callout{theme="warning"} If you can only view the Kubernates host metrics and not the inference container metrics, your container may be running on an outdated version of live deployments. Restart your live deployment to update the version and view all metrics. :::
Spark model support
:::callout{theme="neutral" title="Beta"} Supported Spark versions are subject to change in upcoming releases and back-compatibility is not guaranteed. If your model is not compatible with the current Spark version, you may need to rebuild it. :::
All live deployments are now initialized with both a JDK and a Spark distribution installed. This allows Spark models to be compatible with live deployments. In this interactive environment, only local Spark is supported, meaning all processing is done within a single JVM.
If your model expects a Spark DataFrame input, data conversion issues are more likely to occur since the requests are sent as JSON. When developing a custom model which expects Spark dataframes, you should perform this conversion manually either in a pre-processing stage or directly in the transform function. A simple example of this is below:
import pandas as pd
from pyspark.sql import SparkSession

def _transform(model, df):
    if isinstance(df, pd.DataFrame):
        df = SparkSession.builder.getOrCreate().createDataFrame(df)
    return model.predict_spark_df(df)
中文翻译
设置并使用实时部署
实时部署是一种持久化、可扩展的部署方式,您可以通过 API 端点与发布版本进行交互。实时部署可以与批量部署一起在建模目标(modeling objective)中进行管理,并享有自动化升级、可观测性和权限结构等所有优势。现在也可以直接在模型页面上配置实时部署,无需创建目标。
前提条件
在创建新的实时部署之前,建模目标必须包含一个带有相应标签(Staging 或 Production)的现有发布版本。
创建部署
要创建新的实时部署,请导航至建模目标底部的 Deployments 部分,然后选择蓝色的 + Create a deployment 按钮。
填写部署名称、描述,并选择此部署应基于当前的 staging 还是 production 发布模型。配置完成后,选择 Create deployment。
选择新创建的部署以打开详情页面,您将看到中间状态,表示包含最新发布版本和推理代码的容器镜像正在部署中。
发布函数
您可以为部署发布一个函数,从而在 Workshop、Vertex 和其他终端用户应用中使用模型进行实时推理。
要发布函数,请导航至部署的 Details 页面,然后选择 Publish Function。这将创建一个包装函数(wrapper function),其输入和输出 API 与您的模型相同,可以从函数仓库中导入和调用以添加自定义业务逻辑。
有关函数行为、版本升级和配置选项的详细信息,请参阅模型函数开发者指南。
状态与健康
部署完成更新后,状态和健康应均显示为绿色对勾。这表示部署已准备好接受查询,并已成功更新为包含最新发布的模型。
测试实时部署
您可以通过部署详情页面上的 Query 选项卡来测试实时部署端点。您可以编写输入请求,将其发送到实时端点,并查看模型输出响应。提供两种查询类型:单 I/O 和多 I/O。
单 I/O 查询仅支持单表格式输入/输出,而多 I/O 查询仅支持模型资产(model asset)中定义的 ModelAdapter API。模型资产同时支持单 I/O 和多 I/O 查询类型,而基于数据集(dataset-backed)的部署仅支持单 I/O 查询。
示例命令
以下是通过 curl 使用单 I/O 和 transform 端点查询实时部署的示例:
curl -X POST https://<URL>/foundry-ml-live/api/inference/transform/ri.foundry-ml-live.main.live-deployment.<RID>
-H "Authorization: <BEARER_TOKEN>" -H "Accept: application/json" -H "Content-Type: application/json" -d
'{"requestData":[{"house-location":"New York", "bedrooms":3,"bathrooms":1.5}],
 "requestParams":{}}'
或者,以下示例展示了如何通过 curl 使用多 I/O 和 transformV2 端点查询实时部署:
curl -X POST https://<URL>/foundry-ml-live/api/inference/transform/ri.foundry-ml-live.main.live-deployment.<RID>/v2
-H "Authorization: <BEARER_TOKEN>" -H "Accept: application/json" -H "Content-Type: application/json" -d
'{"input_df":[{"house-location":"New York", "bedrooms":3,"bathrooms":1.5},{"house-location":"San Francisco", "bedrooms":2,"bathrooms":1}]}'
部署操作
管理操作
对正在运行的实时部署有两种操作选项:
- Disable:关闭部署,但允许重新启用以利用相同的 Target RID。
- Delete:完全删除部署。旧的 Target RID 将无法再被查询。
已禁用的实时部署仍会显示在目标的 Deployments 页面上,并且可以重新启用。
资源配置
实时部署配置了副本数以及 CPU 和 GPU 数量。
您可以在创建部署时配置资源需求,也可以在事后进行编辑。编辑运行时配置将自动触发部署的重新运行,从而升级端点且不会造成停机。
要配置新的实时部署,请选择 Create deployment,在 Deployment type 下选择 Live,然后输入副本数和资源配置。
要编辑已配置的副本和资源,请导航至建模项目中的 Deployments 部分,从列出的部署中选择您的部署,然后选择 Runtime configuration 下的编辑按钮来编辑副本或资源配置。
查看部署服务日志
每个实时部署都会发出一系列描述部署启动进度的日志;这些日志包括部署将尝试下载和安装的发布环境中 Conda 包的 URI,以及下载模型本身的详细信息。如果部署未能成功启动,可能会有相关的警告或错误级别日志帮助您了解发生了什么。
要直接从正在运行的实时部署查看服务日志,请导航至部署详情页面上的 Logs & Metrics 选项卡。您可以指定搜索的时间窗口,按任何字段过滤日志,以及添加或删除视图中的列。您还可以使用右上角的下载按钮将所有日志下载为文本文件。
由于您可能已将部署配置为运行多个副本,您可能会看到看似重复的日志——每组来自不同的副本。但是,每条日志都包含一个带有唯一 node_id 的标签,您可以根据需要使用该标签按副本进行过滤。您可以使用以下表示法:
tags.node_id:{在此处插入 UUID}
要从模型直接发出日志,您可以使用标准的 Python 日志记录模块。实时部署将使每条日志行可在 Logs & Metrics 选项卡中查询。
import logging

log = logging.getLogger('model-logger')
log.info("直接从模型发出信息")
实时部署的日志保留期为 7 天,之后将无法查看或下载。
查看部署指标
Logs & Metrics 选项卡提供两种类型的指标:Kubernetes host 和 inference container。请务必了解这些指标类型之间的区别,以便正确监控和调试模型。
Kubernetes 主机指标
Kubernetes 主机指标显示主机上运行的所有进程(不仅仅是特定模型相关的进程)所使用的内存和 CPU 百分比。这些指标对于调试与调度和资源限制相关的问题非常重要。例如,如果模型性能缓慢但主机指标为 100%,则模型可能正在被 Kubernetes 主机限制。
推理容器指标
推理容器指标有助于调试 Python 模型和模型适配器逻辑中的资源使用情况。这些指标提供推理容器的精确内存使用量和 CPU 核心使用量,与整个 Kubernetes 主机无关。目前,基于容器的模型不提供使用指标。
:::callout{theme="warning"} 如果您只能查看 Kubernetes 主机指标而无法查看推理容器指标,则您的容器可能正在运行旧版本的实时部署。请重启实时部署以更新版本并查看所有指标。 :::
Spark 模型支持
:::callout{theme="neutral" title="Beta"} 支持的 Spark 版本在未来的发布中可能会发生变化,且不保证向后兼容性。如果您的模型与当前 Spark 版本不兼容,您可能需要重新构建它。 :::
所有实时部署现在都预装了 JDK 和 Spark 发行版。这使得 Spark 模型能够与实时部署兼容。在此交互式环境中,仅支持本地 Spark,这意味着所有处理都在单个 JVM 内完成。
如果您的模型期望 Spark DataFrame 输入,由于请求以 JSON 格式发送,数据转换问题更可能发生。在开发期望 Spark DataFrame 的自定义模型时,您应在预处理阶段或直接在 transform 函数中手动执行此转换。以下是一个简单示例:
import pandas as pd
from pyspark.sql import SparkSession

def _transform(model, df):
    if isinstance(df, pd.DataFrame):
        df = SparkSession.builder.getOrCreate().createDataFrame(df)
    return model.predict_spark_df(df)